Estimated zip code population in 2022: 13,024 Zip code population in 2010: 9,453 Zip code population in 2000: 7,501
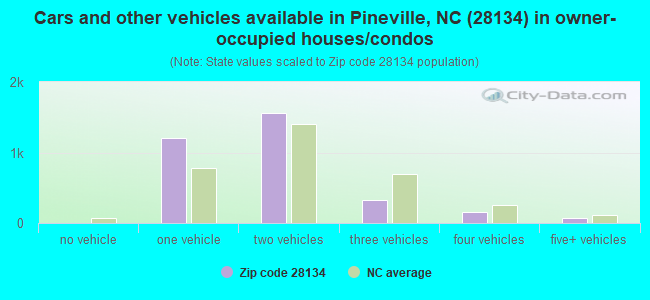
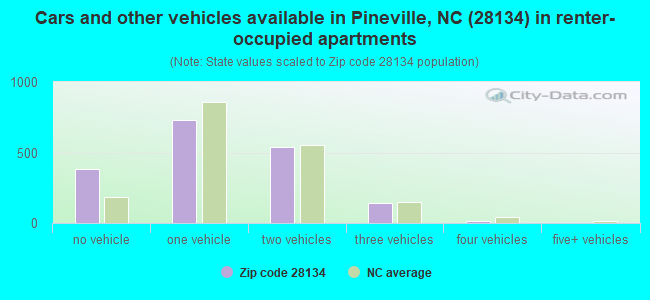
Houses and condos: 5,227 Renter-occupied apartments: 1,821
% of renters here:
35%
State:
33%
March 2022 cost of living index in zip code 28134: 94.4 (less than average, U.S. average is 100)
Land area: 8.6 sq. mi. Water area: 0.0 sq. mi.
Population density: 1,521 people per square mile
(low).
OSM Map
General Map
Google Map
MSN Map
OSM Map
General Map
Google Map
MSN Map
OSM Map
General Map
Google Map
MSN Map
OSM Map
General Map
Google Map
MSN Map
Please wait while loading the map...
Real estate property taxes paid for housing units in 2022:
This zip code:
0.6% ($2,262)
North Carolina:
0.6% ($1,769)
Median real estate property taxes paid for housing units with mortgages in 2022: $2,229 (0.6%) Median real estate property taxes paid for housing units with no mortgage in 2022: $2,318 (0.8%)
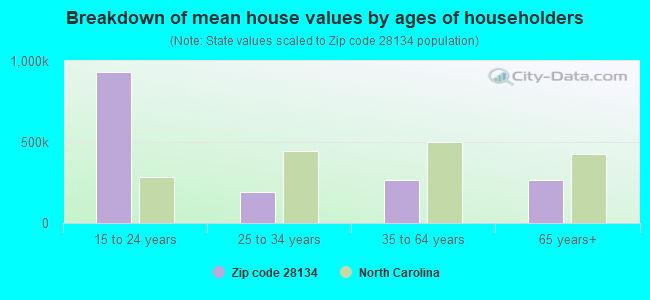
Estimated median house/condo value in 2022: $348,928
28134:
$348,928
North Carolina:
$280,600
According to our research of North Carolina and other state lists, there were 8 registered sex offenders living in 28134 zip code as of May 05, 2024. The ratio of all residents to sex offenders in zip code 28134 is 1,326 to 1. The ratio of registered sex offenders to all residents in this zip code is much lower than the state average.
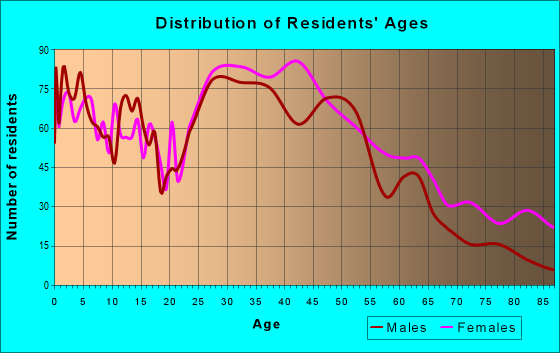
Median resident age:
This zip code:
37.2 years
North Carolina median age:
39.2 years
Average household size:
This zip code:
2.5 people
North Carolina:
2.4 people
Averages for the 2020 tax year for zip code 28134, filed in 2021:
Average Adjusted Gross Income (AGI) in 2020: $66,967 (Individual Income Tax Returns)
Here:
$66,967
State:
$70,020
Salary/wage: $63,560 (reported on 83.0% of returns)
Here:
$63,560
State:
$58,387
(% of AGI for various income ranges: 1169.0% for AGIs below $25k, 3857.5% for AGIs $25k-50k, 7213.8% for AGIs $50k-75k, 11021.5% for AGIs $75k-100k, 21266.3% for AGIs $100k-200k, 72650.0% for AGIs over 200k)
Taxable interest for individuals: $720 (reported on 23.0% of returns)
This zip code:
$720
North Carolina:
$1,479
(% of AGI for various income ranges: 14.9% for AGIs below $25k, 14.1% for AGIs $25k-50k, 14.3% for AGIs $50k-75k, 40.0% for AGIs $75k-100k, 40.9% for AGIs $100k-200k, 221.1% for AGIs over 200k)
Ordinary dividends: $2,636 (reported on 17.1% of returns)
Here:
$2,636
State:
$7,888
(% of AGI for various income ranges: 16.2% for AGIs below $25k, 27.9% for AGIs $25k-50k, 59.0% for AGIs $50k-75k, 92.6% for AGIs $75k-100k, 149.1% for AGIs $100k-200k, 811.1% for AGIs over 200k)
Net capital gain/loss in AGI: +$8,809 (reported on 15.4% of returns)
Here:
+$8,809
State:
+$23,652
(% of AGI for various income ranges: 11.3% for AGIs below $25k, 25.3% for AGIs $25k-50k, 28.8% for AGIs $50k-75k, 81.3% for AGIs $75k-100k, 420.6% for AGIs $100k-200k, 5903.3% for AGIs over 200k)
Profit/loss from business: +$11,390 (reported on 22.0% of returns)
Here:
+$11,390
State:
+$11,710
(% of AGI for various income ranges: 228.1% for AGIs below $25k, 287.3% for AGIs $25k-50k, 294.1% for AGIs $50k-75k, 564.1% for AGIs $75k-100k, 430.2% for AGIs $100k-200k, 3131.1% for AGIs over 200k)
Taxable individual retirement arrangement distribution: $16,933 (reported on 6.8% of returns)
28134:
$16,933
North Carolina:
$20,247
(% of AGI for various income ranges: 47.4% for AGIs below $25k, 85.0% for AGIs $25k-50k, 142.2% for AGIs $50k-75k, 235.1% for AGIs $75k-100k, 434.1% for AGIs $100k-200k, 1565.6% for AGIs over 200k)
Total itemized deductions: $26,342 (reported on 10.5% of returns)
Here:
$26,342
State:
$34,549
(% of AGI for various income ranges: 37.2% for AGIs below $25k, 109.1% for AGIs $25k-50k, 330.4% for AGIs $50k-75k, 751.8% for AGIs $75k-100k, 1204.3% for AGIs $100k-200k, 4348.9% for AGIs over 200k)
Charity contributions: $8,334 (reported on 8.4% of returns)
Here:
$8,334
State:
$13,360
(% of AGI for various income ranges: 26.4% for AGIs $25k-50k, 64.3% for AGIs $50k-75k, 105.9% for AGIs $75k-100k, 331.1% for AGIs $100k-200k, 1637.8% for AGIs over 200k)
Taxes paid: $7,338 (reported on 10.5% of returns)
28134:
$7,338
State:
$7,586
(% of AGI for various income ranges: 6.0% for AGIs below $25k, 22.7% for AGIs $25k-50k, 84.1% for AGIs $50k-75k, 190.0% for AGIs $75k-100k, 395.0% for AGIs $100k-200k, 1163.3% for AGIs over 200k)
Earned income credit: $2,250 (reported on 15.8% of returns)
Here:
$2,250
State:
$2,337
(% of AGI for various income ranges: 99.4% for AGIs below $25k, 75.0% for AGIs $25k-50k)
Percentage of individuals using paid preparers for their 2020 taxes: 92.1%
Here:
92%
State:
93%
(% for various income ranges: 88.4% for AGIs below $25k, 92.1% for AGIs $25k-50k, 93.8% for AGIs $50k-75k, 95.0% for AGIs $75k-100k, 93.8% for AGIs $100k-200k, 100.0% for AGIs over 200k)
Averages for the 2012 tax year for zip code 28134, filed in 2013:
Average Adjusted Gross Income (AGI) in 2012: $47,998 (Individual Income Tax Returns)
Here:
$47,998
State:
$54,937
Salary/wage: $46,493 (reported on 85.4% of returns)
Here:
$46,493
State:
$46,336
(% of AGI for various income ranges: 74.4% for AGIs below $25k, 85.7% for AGIs $25k-50k, 81.2% for AGIs $50k-75k, 83.6% for AGIs $75k-100k, 85.3% for AGIs $100k-200k, 79.4% for AGIs over 200k)
Taxable interest for individuals: $794 (reported on 26.9% of returns)
This zip code:
$794
North Carolina:
$1,298
(% of AGI for various income ranges: 0.6% for AGIs below $25k, 0.4% for AGIs $25k-50k, 0.5% for AGIs $50k-75k, 0.3% for AGIs $75k-100k, 0.6% for AGIs $100k-200k, 0.3% for AGIs over 200k)
Ordinary dividends: $2,559 (reported on 16.2% of returns)
Here:
$2,559
State:
$6,213
(% of AGI for various income ranges: 1.1% for AGIs below $25k, 0.9% for AGIs $25k-50k, 0.8% for AGIs $50k-75k, 0.5% for AGIs $75k-100k, 1.1% for AGIs $100k-200k, 0.5% for AGIs over 200k)
Net capital gain/loss in AGI: +$1,300 (reported on 11.9% of returns)
Here:
+$1,300
State:
+$12,740
(% of AGI for various income ranges: 0.1% for AGIs $25k-50k, 0.2% for AGIs $50k-75k, 0.2% for AGIs $75k-100k, 0.6% for AGIs $100k-200k, 1.0% for AGIs over 200k)
Profit/loss from business: +$7,112 (reported on 15.8% of returns)
Here:
+$7,112
State:
+$10,311
(% of AGI for various income ranges: 9.8% for AGIs below $25k, 1.7% for AGIs $25k-50k, 2.3% for AGIs $50k-75k, 1.2% for AGIs $75k-100k, 1.5% for AGIs $100k-200k)
Taxable individual retirement arrangement distribution: $12,427 (reported on 8.3% of returns)
28134:
$12,427
North Carolina:
$15,575
(% of AGI for various income ranges: 2.9% for AGIs below $25k, 1.5% for AGIs $25k-50k, 2.2% for AGIs $50k-75k, 3.0% for AGIs $75k-100k, 2.5% for AGIs $100k-200k)
Total itemized deductions: $18,999 (23% of AGI, reported on 37.4% of returns)
Here:
$18,999
State:
$23,438
Here:
23.1% of AGI
State:
21.5% of AGI
(% of AGI for various income ranges: 10.1% for AGIs below $25k, 12.1% for AGIs $25k-50k, 15.5% for AGIs $50k-75k, 17.6% for AGIs $75k-100k, 16.9% for AGIs $100k-200k, 13.6% for AGIs over 200k)
Charity contributions: $3,119 (reported on 32.2% of returns)
Here:
$3,119
State:
$4,687
(% of AGI for various income ranges: 0.9% for AGIs below $25k, 1.4% for AGIs $25k-50k, 2.0% for AGIs $50k-75k, 2.3% for AGIs $75k-100k, 2.9% for AGIs $100k-200k, 2.3% for AGIs over 200k)
Taxes paid: $6,784 (reported on 37.2% of returns)
28134:
$6,784
State:
$8,823
(% of AGI for various income ranges: 1.8% for AGIs below $25k, 3.2% for AGIs $25k-50k, 5.0% for AGIs $50k-75k, 6.4% for AGIs $75k-100k, 7.0% for AGIs $100k-200k, 7.2% for AGIs over 200k)
Earned income credit: $2,293 (reported on 18.4% of returns)
Here:
$2,293
State:
$2,376
(% of AGI for various income ranges: 6.4% for AGIs below $25k, 1.1% for AGIs $25k-50k)
Percentage of individuals using paid preparers for their 2012 taxes: 51.0%
Here:
51%
State:
53%
(% for various income ranges: 52.1% for AGIs below $25k, 49.3% for AGIs $25k-50k, 50.0% for AGIs $50k-75k, 46.7% for AGIs $75k-100k, 54.0% for AGIs $100k-200k, 71.4% for AGIs over 200k)
Averages for the 2004 tax year for zip code 28134, filed in 2005:
Average Adjusted Gross Income (AGI) in 2004: $39,690 (Individual Income Tax Returns)
Here:
$39,690
State:
$45,376
Salary/wage: $38,835 (reported on 88.0% of returns)
Here:
$38,835
State:
$39,442
(% of AGI for various income ranges: 111.4% for AGIs below $10k, 81.0% for AGIs $10k-25k, 88.5% for AGIs $25k-50k, 85.8% for AGIs $50k-75k, 90.4% for AGIs $75k-100k, 80.7% for AGIs over 100k)
Taxable interest for individuals: $1,047 (reported on 34.1% of returns)
This zip code:
$1,047
North Carolina:
$1,515
(% of AGI for various income ranges: 4.3% for AGIs below $10k, 1.7% for AGIs $10k-25k, 0.8% for AGIs $25k-50k, 0.6% for AGIs $50k-75k, 0.7% for AGIs $75k-100k, 0.8% for AGIs over 100k)
Taxable dividends: $2,280 (reported on 18.8% of returns)
Here:
$2,280
State:
$4,016
(% of AGI for various income ranges: 3.2% for AGIs below $10k, 1.2% for AGIs $10k-25k, 0.8% for AGIs $25k-50k, 0.8% for AGIs $50k-75k, 0.6% for AGIs $75k-100k, 2.0% for AGIs over 100k)
Net capital gain/loss: +$2,715 (reported on 15.1% of returns)
Here:
+$2,715
State:
+$11,152
(% of AGI for various income ranges: -1.5% for AGIs below $10k, 0.1% for AGIs $10k-25k, -0.0% for AGIs $25k-50k, 0.4% for AGIs $50k-75k, 0.2% for AGIs $75k-100k, 4.4% for AGIs over 100k)
Profit/loss from business: +$4,928 (reported on 13.9% of returns)
Here:
+$4,928
State:
+$9,490
(% of AGI for various income ranges: 4.8% for AGIs below $10k, 4.5% for AGIs $10k-25k, 2.3% for AGIs $25k-50k, 2.2% for AGIs $50k-75k, 0.1% for AGIs $75k-100k, 0.1% for AGIs over 100k)
IRA payment deduction: $2,397 (reported on 2.1% of returns)
28134:
$2,397
North Carolina:
$2,967
(% of AGI for various income ranges: 0.1% for AGIs $10k-25k, 0.2% for AGIs $25k-50k, 0.2% for AGIs $50k-75k, 0.2% for AGIs $75k-100k)
Total itemized deductions: $16,506 (27% of AGI, reported on 43.8% of returns)
Here:
$16,506
State:
$19,464
Here:
26.5% of AGI
State:
22.7% of AGI
(% of AGI for various income ranges: 20.2% for AGIs below $10k, 13.7% for AGIs $10k-25k, 17.6% for AGIs $25k-50k, 20.7% for AGIs $50k-75k, 19.6% for AGIs $75k-100k, 17.4% for AGIs over 100k)
Charity contributions deductions: $2,519 (4% of AGI, reported on 39.2% of returns)
Here:
$2,519
State:
$4,035
Here:
4.0% of AGI
State:
4.5% of AGI
(% of AGI for various income ranges: 1.4% for AGIs below $10k, 1.7% for AGIs $10k-25k, 2.5% for AGIs $25k-50k, 2.6% for AGIs $50k-75k, 2.5% for AGIs $75k-100k, 2.8% for AGIs over 100k)
Total tax: $4,798 (reported on 73.9% of returns)
28134:
$4,798
State:
$7,257
(% of AGI for various income ranges: 3.3% for AGIs below $10k, 3.7% for AGIs $10k-25k, 6.6% for AGIs $25k-50k, 8.7% for AGIs $50k-75k, 9.9% for AGIs $75k-100k, 14.5% for AGIs over 100k)
Earned income credit: $1,811 (reported on 17.2% of returns)
Here:
$1,811
State:
$1,851
Percentage of individuals using paid preparers for their 2004 taxes: 57.1%
Here:
57%
State:
62%
(% for various income ranges: 50.6% for AGIs below $10k, 63.0% for AGIs $10k-25k, 58.3% for AGIs $25k-50k, 53.5% for AGIs $50k-75k, 57.1% for AGIs $75k-100k, 52.7% for AGIs over 100k)
Household received Food Stamps/SNAP in the past 12 months: 637 Household did not receive Food Stamps/SNAP in the past 12 months: 4,496
Women who had a birth in the past 12 months: 296 (239 now married, 60 unmarried) Women who did not have a birth in the past 12 months: 3,113 (1,008 now married, 2,097 unmarried)
Housing units in zip code 28134 with a mortgage: 2,692 (175 second mortgage, 177 both second mortgage and home equity loan) Houses without a mortgage: 8
Median monthly owner costs for units with a mortgage: $1,469 Median monthly owner costs for units without a mortgage: $510
Residents with income below the poverty level in 2022:
This zip code:
15.7%
Whole state:
12.8%
Residents with income below 50% of the poverty level in 2022:
This zip code:
5.5%
Whole state:
6.8%
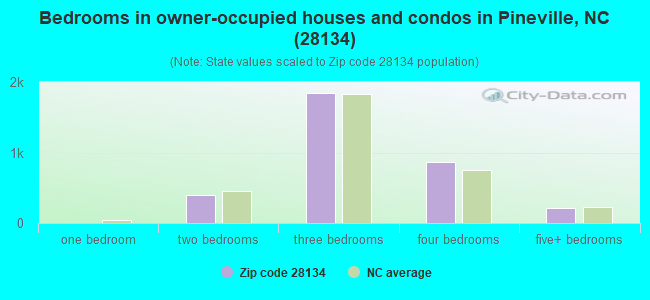
Median number of rooms in houses and condos:
Here:
6.4
State:
6.4
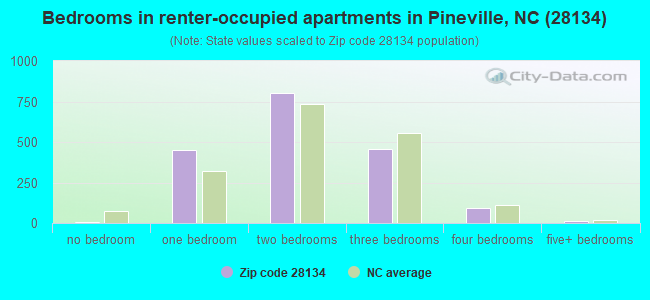
Median number of rooms in apartments:
Here:
4.3
State:
4.4
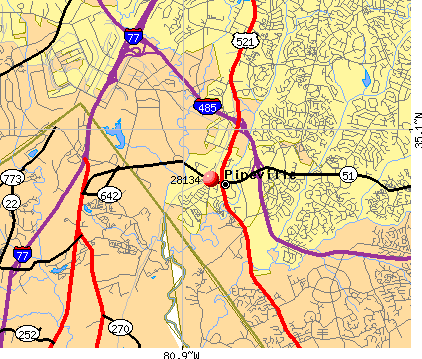
Notable locations in this zip code not listed on our city pages
Churches in zip code 28134 include: Harrison Church (A), Temple Church (B), China Grove Church (C), Saint Johns Church (D), Silvermount Church (E). Display/hide their locations on the map
In group quarters: 91 (-1 institutionalized population)
Size of family households: 1,427 2-persons, 995 3-persons, 404 4-persons, 199 5-persons, 311 6-persons, 46 7-or-more-persons
Size of nonfamily households: 1,565 1-person, 201 2-persons
1,204 married couples with children.
1,004 single-parent households (156 men, 848 women).
73.1% of residents of 28134 zip code speak English at home.
19.2% of residents speak Spanish at home (56% very well, 26% well, 8% not well, 9% not at all).
4.2% of residents speak other Indo-European language at home (54% very well, 18% well, 6% not well, 21% not at all).
3.4% of residents speak Asian or Pacific Island language at home (70% very well, 21% well, 8% not well).
0.7% of residents speak other language at home (88% very well, 12% well).
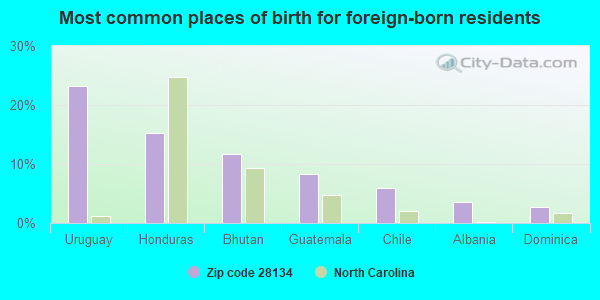
Foreign born population: 2,653 (20.4%) (39.6% of them are naturalized citizens)
This zip code:
20.4%
Whole state:
8.6%
23%Uruguay
15%Honduras
12%Bhutan
8%Guatemala
6%Chile
4%Albania
3%Dominica
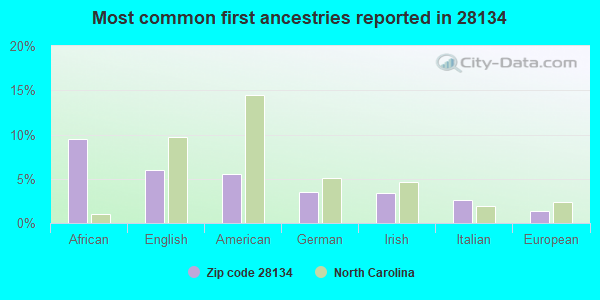
9%African
6%English
6%American
4%German
3%Irish
3%Italian
1%European
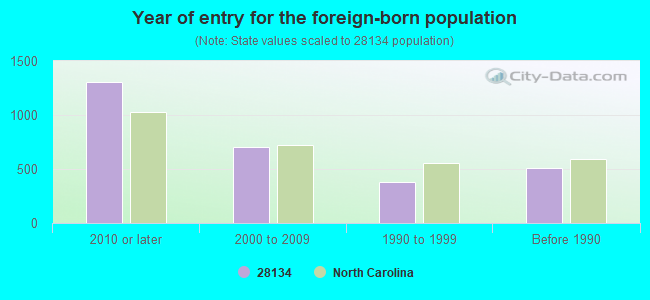
Year of entry for the foreign-born population
1,3052010 or later
7012000 to 2009
3781990 to 1999
511Before 1990
Major facilities with environmental interests located in this zip code:
AQUASOL CORPORATION FORMERLY TILLET CHE (316 COLLEGE STREET in PINEVILLE, NC)
AIR MINOR (AIRS/AFS) STATE MASTER (North Carolina facility info) - UNDERGROUND STORAGE TANK PROGRAM, -115DA4YG0092BD64FBEQ8CU119, WASTEWATER FACILITY STATE MASTER (North Carolina facility info) - -115DA4YG00M29W84AX3Y81N87K, WASTEWATER FACILITY CRITERIA AND HAZARDOUS AIR POLLUTANT INVENTORY (Inventory of air pollution sources) National Pollutant Discharge Elimination System NON-MAJOR (Tracking pollutant discharge elimination systems) - permit Conditionally Exempt Small Quantity Generators, less than 100 kg/month of hazardous waste (Resource Conservation and Recovery Act (tracking hazardous waste)) - notification TRI REPORTER (Tracking of toxic chemicals releasing facilities) Business SIC classification: WET CORN MILLING; SURFACE ACTIVE AGENTS, FINISHING AGENTS, SULFONATED OILS, AND ASSISTANTS; CHEMICALS AND CHEMICAL PREPARATIONS; NONCLASSIFIABLE ESTABLISHMENTS Organizations: TILLETT CHEMICAL CO INC (CONTACT/OWNER)
Alternative names: AQUASOL CORP., TILLETT CHEMICAL CO INC
ALPHAGARY CORPORATION (9635 INDUSTRIAL DR. in PINEVILLE, NC)
AIR SYNTHETIC MINOR (AIRS/AFS) STATE MASTER (North Carolina facility info) - -115DA4YG00M29W84AX3YG1P7FV, WASTEWATER FACILITY COMPLIANCE ACTIVITY (Tracking inspections of insecticide, fungicide, and rodenticide, and toxic substances) CRITERIA AND HAZARDOUS AIR POLLUTANT INVENTORY (Inventory of air pollution sources) National Pollutant Discharge Elimination System NON-MAJOR (Tracking pollutant discharge elimination systems) - permit Small Quantity Generators, between 100 kg and 1000 kg of hazardous waste/month (Resource Conservation and Recovery Act (tracking hazardous waste)) - notification TRI REPORTER (Tracking of toxic chemicals releasing facilities) Business SIC classification: CUSTOM COMPOUNDING OF PURCHASED PLASTICS RESINS Business NAICS classification: CUSTOM COMPOUNDING OF PURCHASED RESINS. Alternative names: ALPHA GARY CORPORATION, ALPHA GARY CORP-MECKLENBURG, ALPHAGARY CORP PINEVILLE PLT
CAROLINA POOL MANAGEMENT, INC. (587 NORTH POLK STREET in PINEVILLE, NC)
(Integrated Compliance Information System) - ICIS-04-2005-3002, FORMAL ENFORCEMENT ACTION
BELK PRINTING, INC. (11240 RIVER'S EDGE ROAD in PINEVILLE, NC)
AIR MINOR (AIRS/AFS) CRITERIA AND HAZARDOUS AIR POLLUTANT INVENTORY (Inventory of air pollution sources) Small Quantity Generators, between 100 kg and 1000 kg of hazardous waste/month (Resource Conservation and Recovery Act (tracking hazardous waste)) - notification Business SIC classification: COMMERCIAL PRINTING Organizations: RALPH W BELK SR. (CONTACT/OWNER)
BUENSOD PANELS & WASHERS (10402 RODNEY STREET in PINEVILLE, NC)
(Resource Conservation and Recovery Act (tracking hazardous waste)) Organizations: JAMES ALEXANDER (CONTACT/OWNER)
AFAC INC (11325 NATIONS FORD RD in PINEVILLE, NC)
(Resource Conservation and Recovery Act (tracking hazardous waste))
ASPHALT ASSOCIATES OF CHARLOTTE (11636 DOWNS RD in PINEVILLE, NC)
(Resource Conservation and Recovery Act (tracking hazardous waste)) Organizations: ASPHALT ASSOCIATES, INC. (CONTACT/OWNER)
B J GAS (11715 CAROLINA PLACE PKWY in PINEVILLE, NC)
(Resource Conservation and Recovery Act (tracking hazardous waste)) Organizations: BJ`S WHOLESALE CLUB INC (CONTACT/OWNER)
B-KLEEN (308 N POLK ST in PINEVILLE, NC)
(Resource Conservation and Recovery Act (tracking hazardous waste)) Organizations: HOWARD ESTEP (CONTACT/OWNER)
B-KLEEN SYSTEMS (8500-M PINEVILLE MATTHEWS HWY in PINEVILLE, NC)
(Resource Conservation and Recovery Act (tracking hazardous waste)) Organizations: HOWARD ESTEP (CONTACT/OWNER)
CATOE`S EXXON SERVICE (100 S POLK ST in PINEVILLE, NC)
(Resource Conservation and Recovery Act (tracking hazardous waste)) Organizations: J MICHAEL CATOE (CONTACT/OWNER)
Alternative names: CATOE'S EXXON SERVICE
DIESEL POWER INJECTION (313 N POLK ST in PINEVILLE, NC)
(Resource Conservation and Recovery Act (tracking hazardous waste)) Organizations: INDUSTRIAL ENG & EQUIP/DBA DIESEL POWER (CONTACT/OWNER)
AKZO NOBLE CHEMICAL (BAYTRADING) (10000-B INDUSTRIAL DR in PINEVILLE, NC)
(Resource Conservation and Recovery Act (tracking hazardous waste))
Housing units lacking complete plumbing facilities: 0.1% Housing units lacking complete kitchen facilities: 2.0%
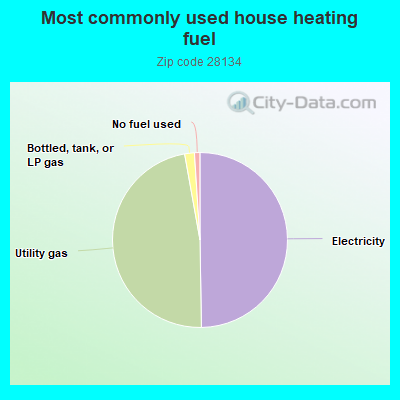
49.6%Electricity
47.3%Utility gas
1.8%Bottled, tank, or LP gas
1.0%No fuel used
Population in 1990: 4,457. Population change in the 1990s: +3,044 (+68.3%).
Place of birth for U.S.-born residents:
This state: 4,016
Northeast: 1,903
Midwest: 1,396
South: 2,598
West: 442
35% of the 28134 zip code residents lived in the same house 5 years ago. Out of people who lived in different houses, 42% lived in this county. Out of people who lived in different counties, 50% lived in North Carolina.
81% of the 28134 zip code residents lived in the same house 1 year ago. Out of people who lived in different houses, 56% moved from this county. Out of people who lived in different houses, 11% moved from different county within same state. Out of people who lived in different houses, 24% moved from different state. Out of people who lived in different houses, 1% moved from abroad.
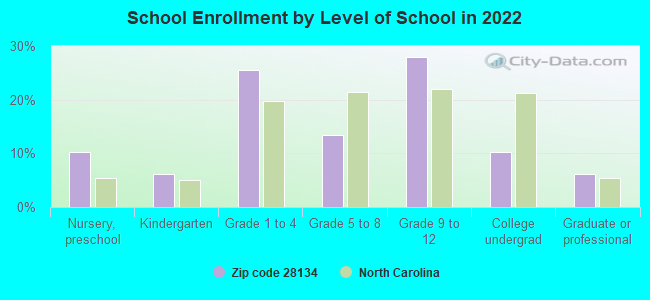
Private vs. public school enrollment:
Students in private schools in grades 1 to 8 (elementary and middle school): 23
Here:
2.4%
North Carolina:
13.8%
Students in private schools in grades 9 to 12 (high school):
Here:
0.0%
North Carolina:
11.9%
Students in private undergraduate colleges: 9
Here:
3.6%
North Carolina:
19.3%
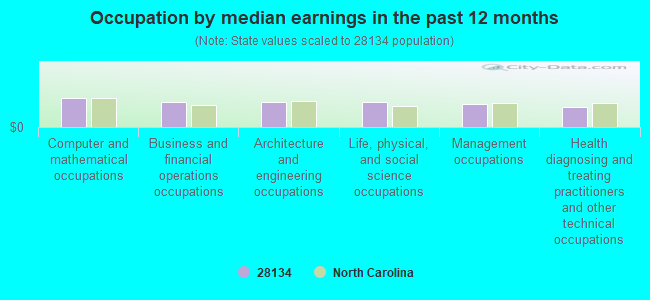
Occupation by median earnings in the past 12 months ($)
101,297Computer and mathematical occupations
85,745Business and financial operations occupations
85,278Architecture and engineering occupations
85,246Life, physical, and social science occupations
78,634Management occupations
69,870Health diagnosing and treating practitioners and other technical occupations
Companies with federal contracts located in this zip code (PINEVILLE, NC):
NOVA DIGITAL SYSTEMS, INC (600 TOWNE CENTRE BOULEVARD; small business) : $2,232,922 in 27 contractsfrom 2001 to 2005
Contracts for Other Architect and Engineering Services, Aerial Photographic Services, Other Photographic, Mapping, Printing, and Publication Services, Photogrammetry Services by National Oceanic and Atmospheric Administration/Under Secretary for Oceans and Atmosphere, U.S. Army Corps of Engineers - civil program financing only, Army, Natural Resources Conservation Service, and others Signed by year:2000: $0; 2001: $913,700; 2002: $188,783; 2003: $475,328; 2004: $26,336; 2005: $628,775; 2006: $0.
Biggest contracts:
$368,964 with National Oceanic and Atmospheric Administration/Under Secretary for Oceans and Atmosphere for Other Architect and Engineering Services. Signed on 2003-09-15. Completion date: 2004-09-15.
$361,247 with U.S. Army Corps of Engineers - civil program financing only for Aerial Photographic Services. Taking place in SC. Signed on 2001-02-04. Completion date: 2001-09-30.
$302,315 with U.S. Army Corps of Engineers - civil program financing only for Other Photographic, Mapping, Printing, and Publication Services. Signed on 2001-07-24. Completion date: 2001-12-31.
$282,212 with National Oceanic and Atmospheric Administration/Under Secretary for Oceans and Atmosphere for Other Architect and Engineering Services. Signed on 2005-05-16. Completion date: 2007-05-31.
SOUTHERN COASTAL MARKETING SER (10201 RODNEY BLVD; small business) : $757,005 in 10 contractsfrom 2000 to 2006
Contracts for Sound Recording and Reproducing Equipment, Other ADP and Telecommunications Services (includes data storage on tapes, compact disks, etc.), Antennas, Waveguides, and Related Equipment, Miscellaneous Communication Equipment, and moreby Department of Defense, Office of Policy, Management and Budget/Chief Financial Officer, Air Force, American Forces Information Service, and others Signed by year:2000: $705,965; 2001: $0; 2002: $0; 2003: $0; 2004: $14,683; 2005: $11,996; 2006: $24,361.
Biggest contracts:
$705,965 with Department of Defense for Sound Recording and Reproducing Equipment. Signed on 2000-03-13. Completion date: 2000-07-10.
$36,101 with Office of Policy, Management and Budget/Chief Financial Officer for Other ADP and Telecommunications Services (includes data storage on tapes, compact disks, etc.). Signed on 2003-09-15. Completion date: 2003-11-15.
$20,980 with Air Force for Sound Recording and Reproducing Equipment. Signed on 2006-03-15. Completion date: 2006-04-14.
$14,683 with American Forces Information Service for Antennas, Waveguides, and Related Equipment. Signed on 2004-12-16. Completion date: 2005-02-14.
NEXCOMMUNICATIONS (601 N POLK ST; small business) : $559,315 in 2 contractsin 2005
$366,889 with Navy for Navigational Instruments. Signed on 2005-07-28. Completion date: 2005-10-30.
$192,426, same as above.Signed on 2005-09-27. Completion date: 2005-10-30.
INDUSTRIAL PIPING INC (800 CULP RD; small business) : $72,384 in 2 contractsin 2003
$76,875 with Air Force for Construction of Structures and Facilities -- Other Non-Building Facilities. Signed on 2003-04-15. Completion date: 2003-06-14.
-$4,491, same as above.Signed on 2003-08-27. Completion date: 2003-08-25.
TERRAINE, INC (600 TOWN CENTRE BLVD STE 1; small business) : $17,227 in 2 contractsin 2004
$15,427 with Navy for Oil Spill Response including Cleanup, Removal, Disposal and Operational Support. Taking place in SC. Signed on 2004-03-08. Completion date: 2005-04-30.
$1,800, same as above.Signed on 2004-04-29. Completion date: 2005-04-30.
ADVANCED IMAGING SYSTEMS (10617 SOUTHERN LOOP BLVD; small business) : $12,272 in 2 contractsin 2004
$12,909 with Army for Photographic Equipment and Accessories. Signed on 2004-06-28. Completion date: 2004-07-14.
-$637, same as above.Signed on 2004-11-15. Completion date: 2004-07-14.
SOUTHEAST VALVE, INC (12201 NATIONS FORD ROAD; small business) : $8,546 in 3 contractsin 2005
$3,964 with Navy for Maintenance, Repair and Rebuilding of Equipment -- Miscellaneous. Signed on 2005-05-23. Completion date: 2005-08-11.
$3,840, same as above.Signed on 2005-10-17. Completion date: 2005-11-21.
$742, same as above.Signed on 2005-06-30. Completion date: 2005-08-11.
SUCCESSORIES OF CAROLINA INC (11025 CAROLINA PLACE PKWY; small business)
$2,720 with Army for Miscellaneous Printed Matter. Signed on 2005-09-28. Completion date: 2005-09-30.
CAROLINA CONTROLS CO (12243 NATIONS FORD ROAD; small business)
$288 with Navy for Pressure, Temperature, and Humidity Measuring and Controlling Instruments. Signed on 2005-04-20. Completion date: 2005-05-18.
Top industries in this zip code by the number of employees in 2005:
2005 - 2018 National Fire Incident Reporting System (NFIRS) incidents
According to the data from the years 2005 - 2018 the average number of fire incidents per year is 54. The highest number of reported fire incidents - 86 took place in 2007, and the least - 17 in 2010. The data has a declining trend.
When looking into fire subcategories, the most reports belonged to: Structure Fires (37.1%), and Outside Fires (35.0%).
Fire incident types reported to NFIRS in Zip Code 28134
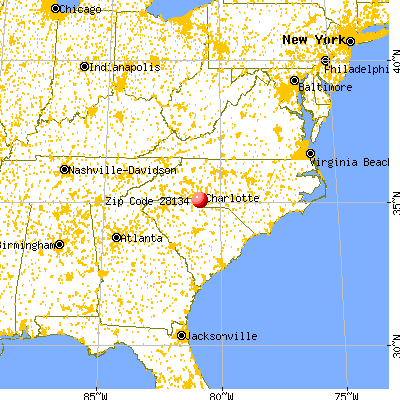


 Nearest zip codes: 28210, 28273, 28226, 28277, 29715, 28217.
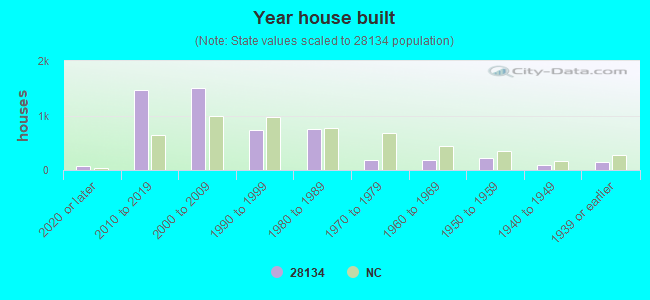


 According to the data from the years 2005 - 2018 the average number of fire incidents per year is 54. The highest number of reported fire incidents - 86 took place in 2007, and the least - 17 in 2010. The data has a declining trend.
 When looking into fire subcategories, the most reports belonged to: Structure Fires (37.1%), and Outside Fires (35.0%).