Estimated zip code population in 2022: 72,599 Zip code population in 2010: 59,664 Zip code population in 2000: 33,905
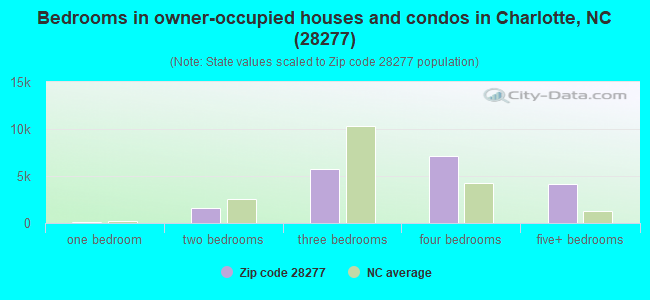
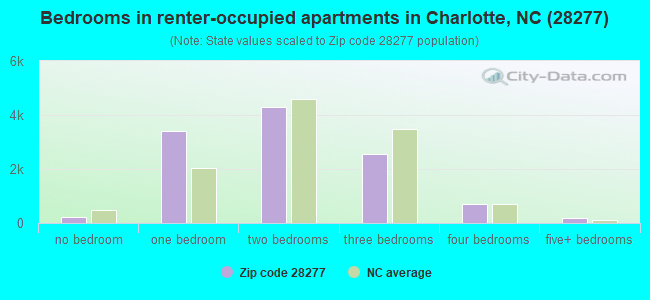
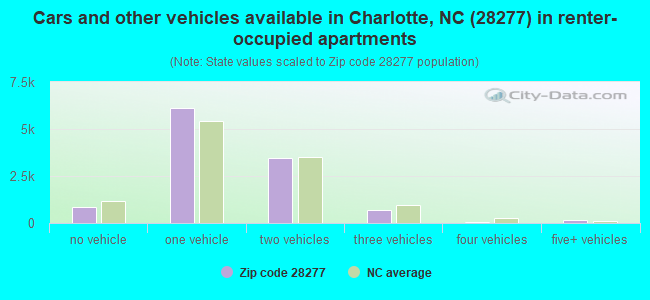
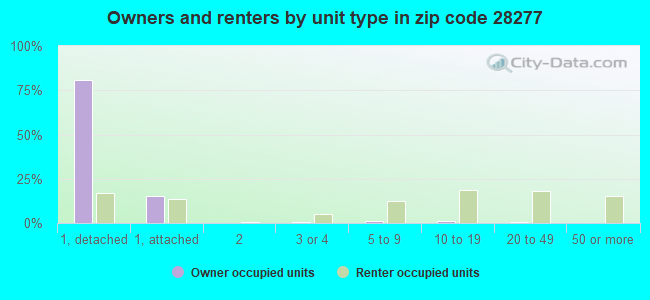
Houses and condos: 30,797 Renter-occupied apartments: 11,383
% of renters here:
38%
State:
33%
March 2022 cost of living index in zip code 28277: 94.7 (less than average, U.S. average is 100)
Land area: 23.4 sq. mi. Water area: 0.3 sq. mi.
Population density: 3,103 people per square mile
(average).
OSM Map
General Map
Google Map
MSN Map
OSM Map
General Map
Google Map
MSN Map
OSM Map
General Map
Google Map
MSN Map
OSM Map
General Map
Google Map
MSN Map
Please wait while loading the map...
Real estate property taxes paid for housing units in 2022:
This zip code:
0.7% ($4,086)
North Carolina:
0.6% ($1,769)
Median real estate property taxes paid for housing units with mortgages in 2022: $4,187 (0.7%) Median real estate property taxes paid for housing units with no mortgage in 2022: $3,865 (0.7%)
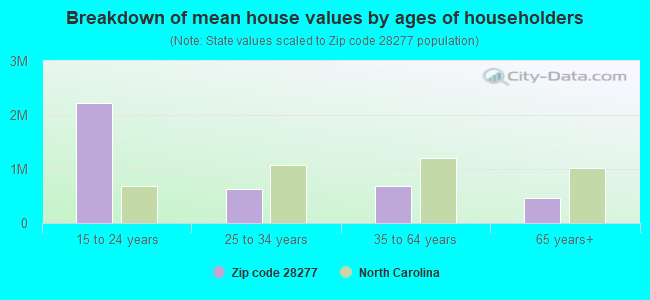
Estimated median house/condo value in 2022: $550,091
28277:
$550,091
North Carolina:
$280,600
According to our research of North Carolina and other state lists, there were 14 registered sex offenders living in 28277 zip code as of April 27, 2024. The ratio of all residents to sex offenders in zip code 28277 is 4,904 to 1. The ratio of registered sex offenders to all residents in this zip code is much lower than the state average.
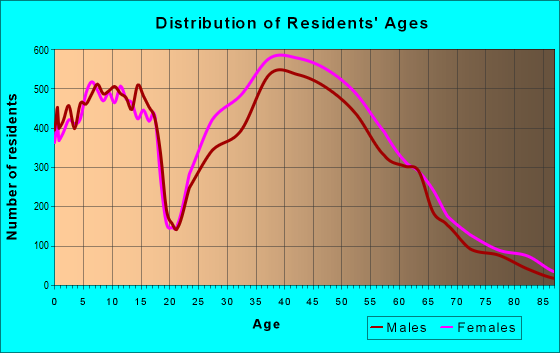
Median resident age:
This zip code:
40.4 years
North Carolina median age:
39.2 years
Average household size:
This zip code:
2.4 people
North Carolina:
2.4 people
Averages for the 2020 tax year for zip code 28277, filed in 2021:
Average Adjusted Gross Income (AGI) in 2020: $132,488 (Individual Income Tax Returns)
Here:
$132,488
State:
$70,020
Salary/wage: $115,628 (reported on 83.4% of returns)
Here:
$115,628
State:
$58,387
(% of AGI for various income ranges: 1132.5% for AGIs below $25k, 3728.6% for AGIs $25k-50k, 6977.4% for AGIs $50k-75k, 10571.8% for AGIs $75k-100k, 20116.7% for AGIs $100k-200k, 95972.8% for AGIs over 200k)
Taxable interest for individuals: $2,146 (reported on 39.7% of returns)
This zip code:
$2,146
North Carolina:
$1,479
(% of AGI for various income ranges: 25.8% for AGIs below $25k, 36.3% for AGIs $25k-50k, 48.5% for AGIs $50k-75k, 69.4% for AGIs $75k-100k, 128.1% for AGIs $100k-200k, 957.9% for AGIs over 200k)
Ordinary dividends: $8,996 (reported on 36.4% of returns)
Here:
$8,996
State:
$7,888
(% of AGI for various income ranges: 53.9% for AGIs below $25k, 97.5% for AGIs $25k-50k, 166.5% for AGIs $50k-75k, 241.5% for AGIs $75k-100k, 443.7% for AGIs $100k-200k, 4060.6% for AGIs over 200k)
Net capital gain/loss in AGI: +$28,854 (reported on 34.2% of returns)
Here:
+$28,854
State:
+$23,652
(% of AGI for various income ranges: 40.8% for AGIs below $25k, 71.4% for AGIs $25k-50k, 168.4% for AGIs $50k-75k, 245.0% for AGIs $75k-100k, 674.1% for AGIs $100k-200k, 15509.7% for AGIs over 200k)
Profit/loss from business: +$16,928 (reported on 19.3% of returns)
Here:
+$16,928
State:
+$11,710
(% of AGI for various income ranges: 166.4% for AGIs below $25k, 324.3% for AGIs $25k-50k, 321.4% for AGIs $50k-75k, 249.1% for AGIs $75k-100k, 529.5% for AGIs $100k-200k, 2839.1% for AGIs over 200k)
Taxable individual retirement arrangement distribution: $27,480 (reported on 10.1% of returns)
28277:
$27,480
North Carolina:
$20,247
(% of AGI for various income ranges: 62.3% for AGIs below $25k, 167.7% for AGIs $25k-50k, 327.6% for AGIs $50k-75k, 447.0% for AGIs $75k-100k, 772.9% for AGIs $100k-200k, 1756.6% for AGIs over 200k)
Self-employed (Keogh) retirement plans: $32,848 (reported on 1.3% of returns)
28277:
$32,848
North Carolina:
$26,749
(% of AGI for various income ranges: 5.7% for AGIs $25k-50k, 12.4% for AGIs $50k-75k, 34.0% for AGIs $100k-200k, 637.2% for AGIs over 200k)
Total itemized deductions: $36,227 (reported on 17.8% of returns)
Here:
$36,227
State:
$34,549
(% of AGI for various income ranges: 95.6% for AGIs below $25k, 218.5% for AGIs $25k-50k, 434.8% for AGIs $50k-75k, 708.2% for AGIs $75k-100k, 1255.1% for AGIs $100k-200k, 6656.2% for AGIs over 200k)
Charity contributions: $13,109 (reported on 15.5% of returns)
Here:
$13,109
State:
$13,360
(% of AGI for various income ranges: 6.2% for AGIs below $25k, 26.2% for AGIs $25k-50k, 74.7% for AGIs $50k-75k, 105.7% for AGIs $75k-100k, 259.4% for AGIs $100k-200k, 2795.8% for AGIs over 200k)
Taxes paid: $8,740 (reported on 17.6% of returns)
28277:
$8,740
State:
$7,586
(% of AGI for various income ranges: 14.1% for AGIs below $25k, 41.0% for AGIs $25k-50k, 104.0% for AGIs $50k-75k, 189.6% for AGIs $75k-100k, 387.2% for AGIs $100k-200k, 1425.2% for AGIs over 200k)
Earned income credit: $2,041 (reported on 7.6% of returns)
Here:
$2,041
State:
$2,337
(% of AGI for various income ranges: 64.0% for AGIs below $25k, 51.9% for AGIs $25k-50k, 0.6% for AGIs $50k-75k)
Percentage of individuals using paid preparers for their 2020 taxes: 93.1%
Here:
93%
State:
93%
(% for various income ranges: 90.8% for AGIs below $25k, 92.9% for AGIs $25k-50k, 93.4% for AGIs $50k-75k, 93.2% for AGIs $75k-100k, 93.9% for AGIs $100k-200k, 95.2% for AGIs over 200k)
Averages for the 2012 tax year for zip code 28277, filed in 2013:
Average Adjusted Gross Income (AGI) in 2012: $114,522 (Individual Income Tax Returns)
Here:
$114,522
State:
$54,937
Salary/wage: $101,333 (reported on 87.0% of returns)
Here:
$101,333
State:
$46,336
(% of AGI for various income ranges: 74.8% for AGIs below $25k, 80.5% for AGIs $25k-50k, 78.2% for AGIs $50k-75k, 81.2% for AGIs $75k-100k, 84.2% for AGIs $100k-200k, 71.9% for AGIs over 200k)
Taxable interest for individuals: $1,552 (reported on 45.5% of returns)
This zip code:
$1,552
North Carolina:
$1,298
(% of AGI for various income ranges: 1.6% for AGIs below $25k, 0.7% for AGIs $25k-50k, 0.6% for AGIs $50k-75k, 0.4% for AGIs $75k-100k, 0.4% for AGIs $100k-200k, 0.7% for AGIs over 200k)
Ordinary dividends: $6,455 (reported on 35.0% of returns)
Here:
$6,455
State:
$6,213
(% of AGI for various income ranges: 3.5% for AGIs below $25k, 1.8% for AGIs $25k-50k, 1.5% for AGIs $50k-75k, 1.2% for AGIs $75k-100k, 1.4% for AGIs $100k-200k, 2.4% for AGIs over 200k)
Net capital gain/loss in AGI: +$15,685 (reported on 30.5% of returns)
Here:
+$15,685
State:
+$12,740
(% of AGI for various income ranges: 0.3% for AGIs below $25k, 0.5% for AGIs $50k-75k, 0.5% for AGIs $75k-100k, 1.0% for AGIs $100k-200k, 7.7% for AGIs over 200k)
Profit/loss from business: +$16,317 (reported on 17.9% of returns)
Here:
+$16,317
State:
+$10,311
(% of AGI for various income ranges: 8.5% for AGIs below $25k, 3.9% for AGIs $25k-50k, 3.1% for AGIs $50k-75k, 2.9% for AGIs $75k-100k, 2.4% for AGIs $100k-200k, 2.1% for AGIs over 200k)
Taxable individual retirement arrangement distribution: $21,768 (reported on 11.4% of returns)
28277:
$21,768
North Carolina:
$15,575
(% of AGI for various income ranges: 4.4% for AGIs below $25k, 2.9% for AGIs $25k-50k, 3.4% for AGIs $50k-75k, 3.2% for AGIs $75k-100k, 2.5% for AGIs $100k-200k, 1.4% for AGIs over 200k)
Self-employment retirement plans: $24,492 (reported on 1.3% of returns)
28277:
$24,492
North Carolina:
$21,078
(% of AGI for various income ranges: 0.1% for AGIs $25k-50k, 0.1% for AGIs $75k-100k, 0.1% for AGIs $100k-200k, 0.4% for AGIs over 200k)
Total itemized deductions: $31,445 (18% of AGI, reported on 58.3% of returns)
Here:
$31,445
State:
$23,438
Here:
18.3% of AGI
State:
21.5% of AGI
(% of AGI for various income ranges: 20.4% for AGIs below $25k, 15.9% for AGIs $25k-50k, 19.0% for AGIs $50k-75k, 18.6% for AGIs $75k-100k, 17.9% for AGIs $100k-200k, 13.9% for AGIs over 200k)
Charity contributions: $4,927 (reported on 51.7% of returns)
Here:
$4,927
State:
$4,687
(% of AGI for various income ranges: 1.6% for AGIs below $25k, 1.8% for AGIs $25k-50k, 2.3% for AGIs $50k-75k, 2.1% for AGIs $75k-100k, 2.2% for AGIs $100k-200k, 2.3% for AGIs over 200k)
Taxes paid: $14,991 (reported on 58.2% of returns)
28277:
$14,991
State:
$8,823
(% of AGI for various income ranges: 4.5% for AGIs below $25k, 4.4% for AGIs $25k-50k, 6.1% for AGIs $50k-75k, 7.1% for AGIs $75k-100k, 8.3% for AGIs $100k-200k, 8.1% for AGIs over 200k)
Earned income credit: $1,986 (reported on 7.3% of returns)
Here:
$1,986
State:
$2,376
(% of AGI for various income ranges: 4.0% for AGIs below $25k, 0.7% for AGIs $25k-50k)
Percentage of individuals using paid preparers for their 2012 taxes: 51.5%
Here:
52%
State:
53%
(% for various income ranges: 45.7% for AGIs below $25k, 47.8% for AGIs $25k-50k, 50.6% for AGIs $50k-75k, 51.2% for AGIs $75k-100k, 53.0% for AGIs $100k-200k, 67.4% for AGIs over 200k)
Averages for the 2004 tax year for zip code 28277, filed in 2005:
Average Adjusted Gross Income (AGI) in 2004: $94,296 (Individual Income Tax Returns)
Here:
$94,296
State:
$45,376
Salary/wage: $87,286 (reported on 87.6% of returns)
Here:
$87,286
State:
$39,442
(% of AGI for various income ranges: 78.4% for AGIs $10k-25k, 83.3% for AGIs $25k-50k, 83.1% for AGIs $50k-75k, 85.2% for AGIs $75k-100k, 78.3% for AGIs over 100k)
Taxable interest for individuals: $2,047 (reported on 55.6% of returns)
This zip code:
$2,047
North Carolina:
$1,515
(% of AGI for various income ranges: 2.5% for AGIs $10k-25k, 1.2% for AGIs $25k-50k, 1.2% for AGIs $50k-75k, 0.9% for AGIs $75k-100k, 1.1% for AGIs over 100k)
Taxable dividends: $3,845 (reported on 41.5% of returns)
Here:
$3,845
State:
$4,016
(% of AGI for various income ranges: 2.7% for AGIs $10k-25k, 1.4% for AGIs $25k-50k, 1.4% for AGIs $50k-75k, 1.2% for AGIs $75k-100k, 1.7% for AGIs over 100k)
Net capital gain/loss: +$10,768 (reported on 36.0% of returns)
Here:
+$10,768
State:
+$11,152
(% of AGI for various income ranges: 1.1% for AGIs $10k-25k, 0.6% for AGIs $25k-50k, 0.4% for AGIs $50k-75k, 0.8% for AGIs $75k-100k, 5.3% for AGIs over 100k)
Profit/loss from business: +$14,075 (reported on 17.1% of returns)
Here:
+$14,075
State:
+$9,490
(% of AGI for various income ranges: 6.8% for AGIs $10k-25k, 3.5% for AGIs $25k-50k, 2.8% for AGIs $50k-75k, 2.6% for AGIs $75k-100k, 2.2% for AGIs over 100k)
IRA payment deduction: $3,214 (reported on 3.3% of returns)
28277:
$3,214
North Carolina:
$2,967
(% of AGI for various income ranges: 0.3% for AGIs $10k-25k, 0.2% for AGIs $25k-50k, 0.2% for AGIs $50k-75k, 0.2% for AGIs $75k-100k, 0.1% for AGIs over 100k)
Self-employed pension: $17,738 (reported on 1.7% of returns)
Here:
$17,738
North Carolina:
$14,754
(% of AGI for various income ranges: 0.1% for AGIs $10k-25k, 0.1% for AGIs $25k-50k, 0.1% for AGIs $50k-75k, 0.2% for AGIs $75k-100k, 0.4% for AGIs over 100k)
Total itemized deductions: $28,084 (21% of AGI, reported on 63.5% of returns)
Here:
$28,084
State:
$19,464
Here:
20.5% of AGI
State:
22.7% of AGI
(% of AGI for various income ranges: 22.0% for AGIs $10k-25k, 24.4% for AGIs $25k-50k, 22.7% for AGIs $50k-75k, 22.2% for AGIs $75k-100k, 16.9% for AGIs over 100k)
Charity contributions deductions: $4,393 (3% of AGI, reported on 58.4% of returns)
Here:
$4,393
State:
$4,035
Here:
3.1% of AGI
State:
4.5% of AGI
(% of AGI for various income ranges: 2.2% for AGIs $10k-25k, 2.4% for AGIs $25k-50k, 2.7% for AGIs $50k-75k, 2.7% for AGIs $75k-100k, 2.7% for AGIs over 100k)
Total tax: $18,708 (reported on 85.0% of returns)
28277:
$18,708
State:
$7,257
(% of AGI for various income ranges: 5.0% for AGIs $10k-25k, 7.9% for AGIs $25k-50k, 9.4% for AGIs $50k-75k, 10.3% for AGIs $75k-100k, 19.9% for AGIs over 100k)
Earned income credit: $1,422 (reported on 4.5% of returns)
Here:
$1,422
State:
$1,851
Percentage of individuals using paid preparers for their 2004 taxes: 54.1%
Here:
54%
State:
62%
(% for various income ranges: 48.8% for AGIs below $10k, 53.7% for AGIs $10k-25k, 51.3% for AGIs $25k-50k, 53.4% for AGIs $50k-75k, 51.9% for AGIs $75k-100k, 60.1% for AGIs over 100k)
Likely homosexual households (counted as self-reported same-sex unmarried-partner households)
Lesbian couples: 0.0% of all households
Gay men: 0.1% of all households
Household received Food Stamps/SNAP in the past 12 months: 415 Household did not receive Food Stamps/SNAP in the past 12 months: 28,965
Women who had a birth in the past 12 months: 702 (722 now married, 0 unmarried) Women who did not have a birth in the past 12 months: 17,113 (9,207 now married, 7,943 unmarried)
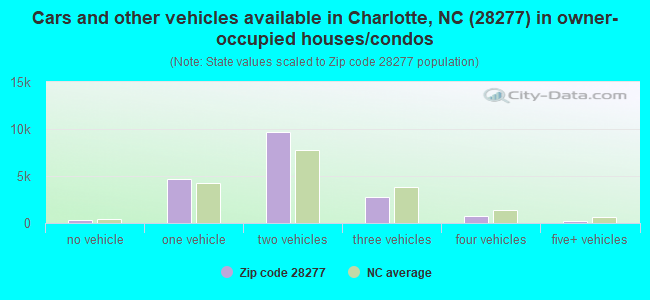
Housing units in zip code 28277 with a mortgage: 13,803 (1,575 second mortgage, 13 home equity loan, 1,585 both second mortgage and home equity loan) Houses without a mortgage: 490
Median monthly owner costs for units with a mortgage: $2,176 Median monthly owner costs for units without a mortgage: $678
Residents with income below the poverty level in 2022:
This zip code:
4.1%
Whole state:
12.8%
Residents with income below 50% of the poverty level in 2022:
This zip code:
1.4%
Whole state:
6.8%
Median number of rooms in houses and condos:
Here:
7.9
State:
6.4
Median number of rooms in apartments:
Here:
4.1
State:
4.4
Notable locations in this zip code not listed on our city pages
Notable locations in zip code 28277: Providence West (A), Charlotte Fire Department Station 32 (B), Public Library of Charlotte and Mecklenburg County - South County Regional Branch (C). Display/hide their locations on the map
13,844 married couples with children.
3,477 single-parent households (973 men, 2,504 women).
75.7% of residents of 28277 zip code speak English at home.
5.7% of residents speak Spanish at home (69% very well, 20% well, 9% not well, 2% not at all).
8.2% of residents speak other Indo-European language at home (79% very well, 13% well, 6% not well, 2% not at all).
9.6% of residents speak Asian or Pacific Island language at home (73% very well, 16% well, 8% not well, 3% not at all).
1.7% of residents speak other language at home (83% very well, 1% well, 2% not well, 14% not at all).
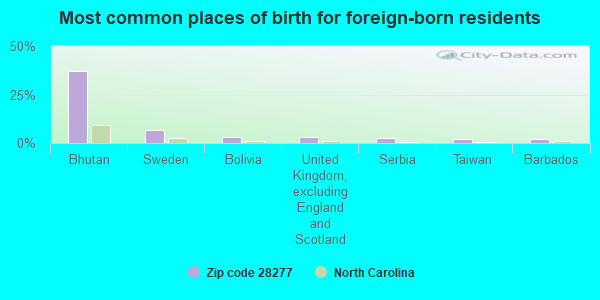
Foreign born population: 16,042 (22.1%) (45.5% of them are naturalized citizens)
Facilities with environmental interests located in this zip code:
BOBER INDUSTRIES (2906 GREENSIDE COURT in CHARLOTTE, NC)
COMPLIANCE ACTIVITY (Tracking inspections of insecticide, fungicide, and rodenticide, and toxic substances)
Housing units lacking complete plumbing facilities: 0.1% Housing units lacking complete kitchen facilities: 0.5%
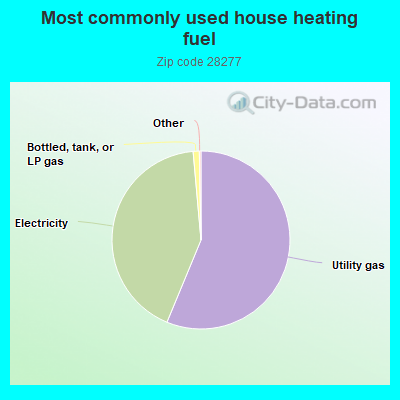
56.2%Utility gas
42.3%Electricity
1.1%Bottled, tank, or LP gas
Population in 1990: 6,737. Population change in the 1990s: +27,168 (+403.3%).
Place of birth for U.S.-born residents:
This state: 18,201
Northeast: 13,286
Midwest: 8,237
South: 13,484
West: 2,957
35% of the 28277 zip code residents lived in the same house 5 years ago. Out of people who lived in different houses, 38% lived in this county. Out of people who lived in different counties, 50% lived in North Carolina.
84% of the 28277 zip code residents lived in the same house 1 year ago. Out of people who lived in different houses, 43% moved from this county. Out of people who lived in different houses, 12% moved from different county within same state. Out of people who lived in different houses, 39% moved from different state. Out of people who lived in different houses, 4% moved from abroad.
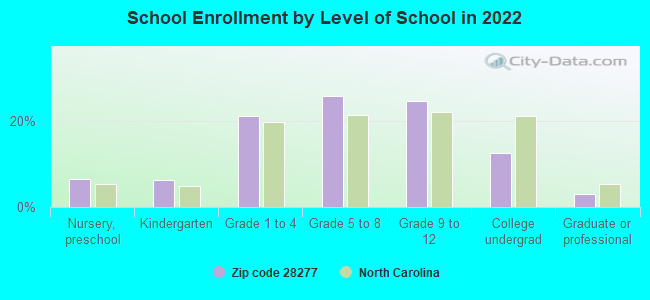
Private vs. public school enrollment:
Students in private schools in grades 1 to 8 (elementary and middle school): 1,089
Here:
13.4%
North Carolina:
13.8%
Students in private schools in grades 9 to 12 (high school): 675
Here:
15.8%
North Carolina:
11.9%
Students in private undergraduate colleges: 331
Here:
15.2%
North Carolina:
19.3%
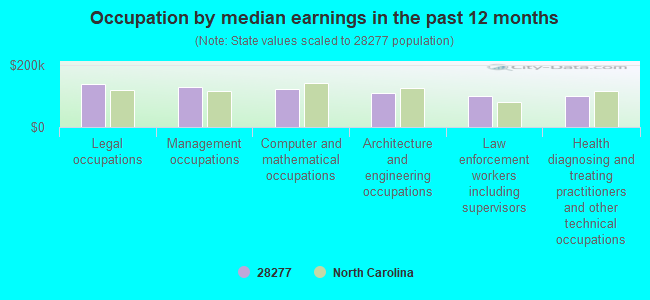
Occupation by median earnings in the past 12 months ($)
140,588Legal occupations
130,817Management occupations
121,977Computer and mathematical occupations
108,692Architecture and engineering occupations
101,582Law enforcement workers including supervisors
100,893Health diagnosing and treating practitioners and other technical occupations
Companies with federal contracts located in this zip code (CHARLOTTE, NC):
AFTA STAFFING LLC (10612 PROVIDENCE RD STE D; small business) : $608,930 in 7 contractsfrom 2001 to 2005
Contracts for Other Administrative Support Services, Transcription Services, Nursing Home Care Contracts, Other Professional Services by Department of Veterans Affairs, Air Force Signed by year:2000: $0; 2001: $185,000; 2002: $50,000; 2003: $352,141; 2004: $166,667; 2005: -$144,878; 2006: $0.
Biggest contracts:
$303,166 with Department of Veterans Affairs for Other Administrative Support Services. Taking place in DC. Signed on 2003-08-15. Completion date: 2003-09-15.
$166,667 with Air Force for Transcription Services. Taking place in CA. Signed on 2004-10-01. Completion date: 2005-09-30.
$141,000 with Department of Veterans Affairs for Nursing Home Care Contracts. Signed on 2001-03-15. Completion date: 2002-03-15.
$50,000 with Department of Veterans Affairs for Other Administrative Support Services. Taking place in DC. Signed on 2002-09-15. Completion date: 2004-09-15.
SPX CORPORATION (13515 BALLANTYNE CORP PL) : $417,110 in 10 contractsfrom 2000 to 2005
Contracts for Fire Control Systems, Complete, Gas Generating and Dispensing Systems, Fixed or Mobile, Other ADP and Telecommunications Services (includes data storage on tapes, compact disks, etc.), Fire Control Maintenance and Repair Shop Specialized Equipment, and moreby Office of Assistant Secretary for Health except national centers (disused code), United States Mint, Agricultural Research Service, Army, and others Signed by year:2000: $286,000; 2001: $0; 2002: -$39,000; 2003: $131,610; 2004: $7,840; 2005: $30,660; 2006: $0.
Biggest contracts:
$206,000 with Office of Assistant Secretary for Health except national centers (disused code) for Fire Control Systems, Complete. Taking place in MD. Signed on 2000-09-15. Completion date: 2001-09-15.
$125,000 with United States Mint for Gas Generating and Dispensing Systems, Fixed or Mobile. Signed on 2003-08-15. Completion date: 2003-12-15.
$80,000 with Office of Assistant Secretary for Health except national centers (disused code) for Other ADP and Telecommunications Services (includes data storage on tapes, compact disks, etc.). Taking place in MD. Signed on 2000-04-15. Completion date: 2000-05-15.
$24,075 with Office of Assistant Secretary for Health except national centers (disused code) for Fire Control Maintenance and Repair Shop Specialized Equipment. Taking place in MD. Signed on 2005-10-11. Completion date: 2006-09-30.
AUTOMATION COMPONENTS & SYSTEM (8206 PROVIDENCE RD; small business) : $206,045 in 4 contractsfrom 2003 to 2004
$58,383 with Defense Logistics Agency for Miscellaneous Electric Power and Distribution Equipment. Signed on 2004-05-14. Completion date: 2004-07-13.
$58,383, same as above.Signed on 2004-05-14. Completion date: 2004-07-13.
$44,910, same as above.Signed on 2004-02-05. Completion date: 2004-04-05.
$44,369 with Department of Veterans Affairs for Miscellaneous Electric Power and Distribution Equipment. Signed on 2003-04-15. Completion date: 2003-05-15.
ENERCHECK SYSTEMS INC (6926 SETON HOUSE LN; small business)
$34,196 with Navy for Other Architect and Engineering Services. Signed on 2000-09-21. Completion date: 2000-12-21.
COATS AMERICAN INC (3430 TORINGDON WAY # 301) : $21,207 in 5 contractsfrom 2004 to 2005
Contracts for Yarn and Thread by Army, Defense Logistics Agency Signed by year:2000: $0; 2001: $0; 2002: $0; 2003: $0; 2004: $15,336; 2005: $5,871; 2006: $0.
Biggest contracts:
$10,347 with Army for Yarn and Thread. Signed on 2004-11-01. Completion date: 2004-12-15.
$5,046 with Defense Logistics Agency for Yarn and Thread. Signed on 2005-06-16. Completion date: 2005-08-13.
$4,989 with Army for Yarn and Thread. Signed on 2004-11-01. Completion date: 2004-12-15.
$712, same as above.Signed on 2005-05-20. Completion date: 2004-12-15.
TRINITY ALARM COMPANY INC (11227 SNAPFINGER DR; small business)
$4,493 with Army for Electrical Hardware and Supplies. Signed on 2004-09-29. Completion date: 2004-10-15.
MCAFEE PUBLISHING INC (15300 MCCOMB MANOR CT; small business)
$3,250 with Navy for Military Personnel Recruitment. Signed on 2004-11-09. Completion date: 2005-09-30.
Top industries in this zip code by the number of employees in 2005:
2005 - 2018 National Fire Incident Reporting System (NFIRS) incidents
According to the data from the years 2005 - 2018 the average number of fires per year is 71. The highest number of reported fires - 107 took place in 2007, and the least - 34 in 2009. The data has a decreasing trend.
When looking into fire subcategories, the most incidents belonged to: Outside Fires (48.4%), and Structure Fires (29.1%).
Fire incident types reported to NFIRS in Zip Code 28277


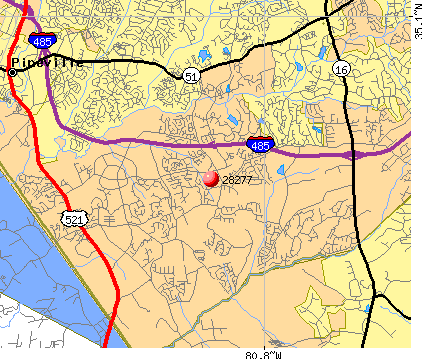 Nearest zip codes: 28226, 28270, 28134, 28210, 29707, 28211.
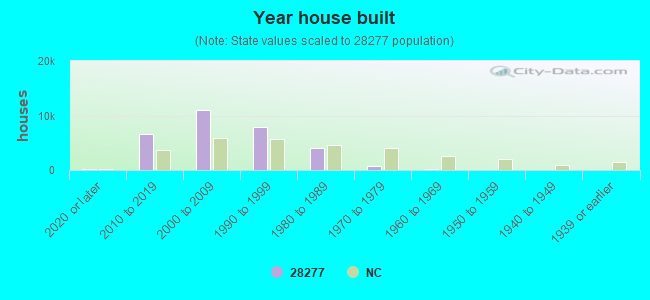


 According to the data from the years 2005 - 2018 the average number of fires per year is 71. The highest number of reported fires - 107 took place in 2007, and the least - 34 in 2009. The data has a decreasing trend.
 When looking into fire subcategories, the most incidents belonged to: Outside Fires (48.4%), and Structure Fires (29.1%).