Estimated zip code population in 2022: 32,750 Zip code population in 2010: 28,523 Zip code population in 2000: 27,757
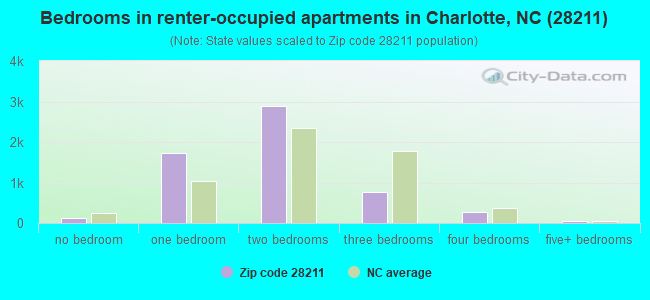
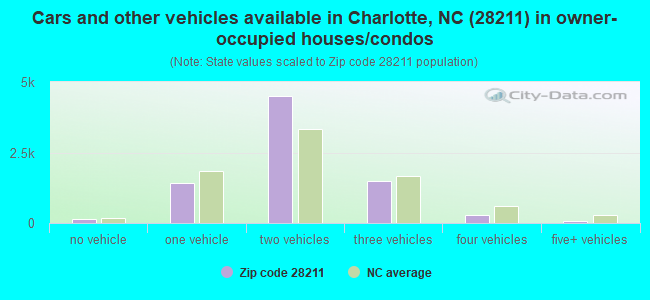
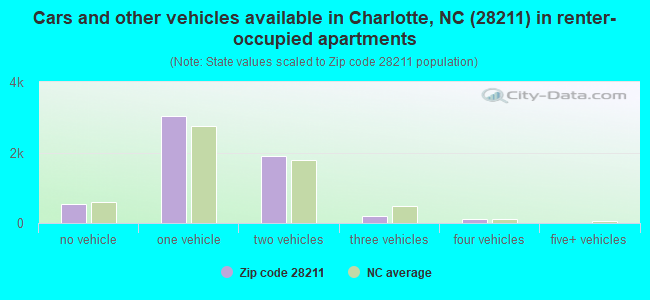
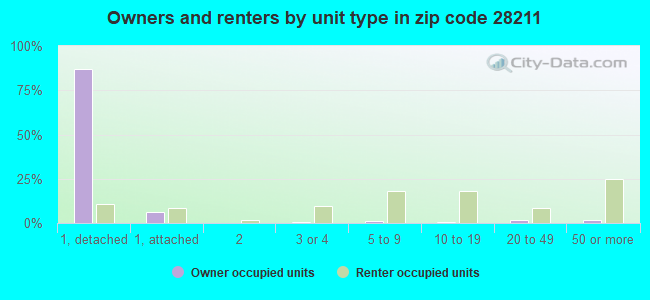
Houses and condos: 15,470 Renter-occupied apartments: 5,801
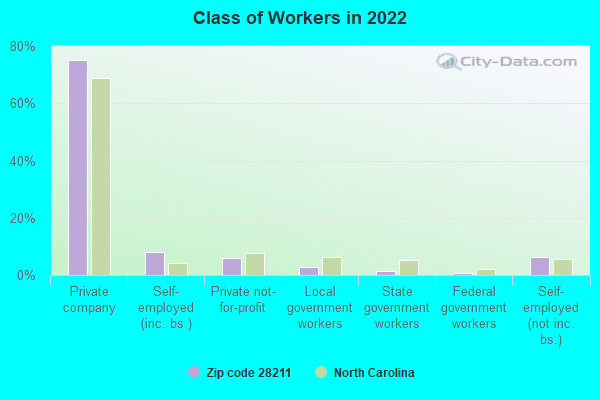
% of renters here:
42%
State:
33%
March 2022 cost of living index in zip code 28211: 95.9 (near average, U.S. average is 100)
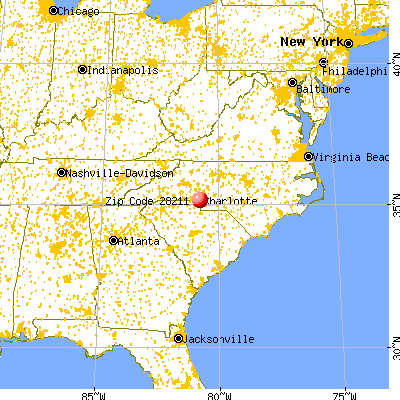
Land area: 10.8 sq. mi. Water area: 0.0 sq. mi.
Population density: 3,039 people per square mile
(average).
OSM Map
General Map
Google Map
MSN Map
OSM Map
General Map
Google Map
MSN Map
OSM Map
General Map
Google Map
MSN Map
OSM Map
General Map
Google Map
MSN Map
Please wait while loading the map...
Real estate property taxes paid for housing units in 2022:
This zip code:
0.6% ($4,912)
North Carolina:
0.6% ($1,769)
Median real estate property taxes paid for housing units with mortgages in 2022: $4,858 (0.6%) Median real estate property taxes paid for housing units with no mortgage in 2022: $4,987 (0.7%)
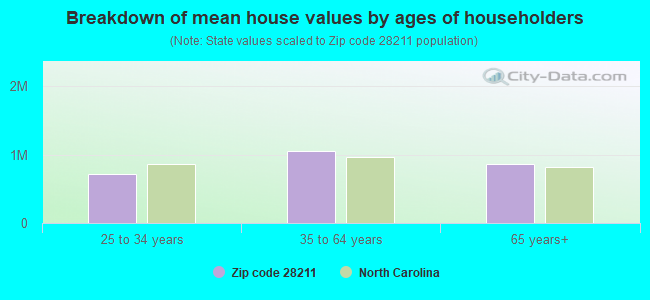
Estimated median house/condo value in 2022: $778,608
28211:
$778,608
North Carolina:
$280,600
According to our research of North Carolina and other state lists, there were 20 registered sex offenders living in 28211 zip code as of April 26, 2024. The ratio of all residents to sex offenders in zip code 28211 is 1,528 to 1. The ratio of registered sex offenders to all residents in this zip code is much lower than the state average.
Median resident age:
This zip code:
38.2 years
North Carolina median age:
39.2 years
Average household size:
This zip code:
2.4 people
North Carolina:
2.4 people
Averages for the 2020 tax year for zip code 28211, filed in 2021:
Average Adjusted Gross Income (AGI) in 2020: $256,841 (Individual Income Tax Returns)
Here:
$256,841
State:
$70,020
Salary/wage: $177,462 (reported on 79.9% of returns)
Here:
$177,462
State:
$58,387
(% of AGI for various income ranges: 1179.8% for AGIs below $25k, 3899.9% for AGIs $25k-50k, 6932.9% for AGIs $50k-75k, 10442.3% for AGIs $75k-100k, 20391.9% for AGIs $100k-200k, 166530.0% for AGIs over 200k)
Taxable interest for individuals: $5,811 (reported on 46.7% of returns)
This zip code:
$5,811
North Carolina:
$1,479
(% of AGI for various income ranges: 23.9% for AGIs below $25k, 30.7% for AGIs $25k-50k, 68.6% for AGIs $50k-75k, 158.2% for AGIs $75k-100k, 304.1% for AGIs $100k-200k, 3454.7% for AGIs over 200k)
Ordinary dividends: $29,503 (reported on 46.6% of returns)
Here:
$29,503
State:
$7,888
(% of AGI for various income ranges: 94.5% for AGIs below $25k, 157.8% for AGIs $25k-50k, 362.5% for AGIs $50k-75k, 712.4% for AGIs $75k-100k, 1321.0% for AGIs $100k-200k, 17878.3% for AGIs over 200k)
Net capital gain/loss in AGI: +$104,426 (reported on 43.2% of returns)
Here:
+$104,426
State:
+$23,652
(% of AGI for various income ranges: 58.3% for AGIs below $25k, 158.7% for AGIs $25k-50k, 188.5% for AGIs $50k-75k, 499.4% for AGIs $75k-100k, 1409.7% for AGIs $100k-200k, 65567.8% for AGIs over 200k)
Profit/loss from business: +$29,989 (reported on 20.2% of returns)
Here:
+$29,989
State:
+$11,710
(% of AGI for various income ranges: 178.2% for AGIs below $25k, 231.6% for AGIs $25k-50k, 437.7% for AGIs $50k-75k, 635.3% for AGIs $75k-100k, 1097.1% for AGIs $100k-200k, 6152.7% for AGIs over 200k)
Taxable individual retirement arrangement distribution: $32,039 (reported on 11.5% of returns)
28211:
$32,039
North Carolina:
$20,247
(% of AGI for various income ranges: 75.9% for AGIs below $25k, 183.1% for AGIs $25k-50k, 346.8% for AGIs $50k-75k, 522.6% for AGIs $75k-100k, 1132.9% for AGIs $100k-200k, 2998.8% for AGIs over 200k)
Self-employed (Keogh) retirement plans: $37,774 (reported on 3.2% of returns)
28211:
$37,774
North Carolina:
$26,749
(% of AGI for various income ranges: 26.3% for AGIs $50k-75k, 90.8% for AGIs $100k-200k, 1672.9% for AGIs over 200k)
Total itemized deductions: $61,960 (reported on 27.5% of returns)
Here:
$61,960
State:
$34,549
(% of AGI for various income ranges: 166.6% for AGIs below $25k, 213.9% for AGIs $25k-50k, 517.8% for AGIs $50k-75k, 1157.6% for AGIs $75k-100k, 2049.1% for AGIs $100k-200k, 21281.3% for AGIs over 200k)
Charity contributions: $36,592 (reported on 24.9% of returns)
Here:
$36,592
State:
$13,360
(% of AGI for various income ranges: 6.9% for AGIs below $25k, 24.5% for AGIs $25k-50k, 86.6% for AGIs $50k-75k, 212.4% for AGIs $75k-100k, 452.7% for AGIs $100k-200k, 12943.8% for AGIs over 200k)
Taxes paid: $9,168 (reported on 27.5% of returns)
28211:
$9,168
State:
$7,586
(% of AGI for various income ranges: 20.8% for AGIs below $25k, 42.8% for AGIs $25k-50k, 117.9% for AGIs $50k-75k, 293.2% for AGIs $75k-100k, 586.6% for AGIs $100k-200k, 2672.9% for AGIs over 200k)
Earned income credit: $2,202 (reported on 9.0% of returns)
Here:
$2,202
State:
$2,337
(% of AGI for various income ranges: 95.3% for AGIs below $25k, 50.1% for AGIs $25k-50k)
Percentage of individuals using paid preparers for their 2020 taxes: 93.1%
Here:
93%
State:
93%
(% for various income ranges: 90.7% for AGIs below $25k, 93.1% for AGIs $25k-50k, 93.5% for AGIs $50k-75k, 91.7% for AGIs $75k-100k, 93.1% for AGIs $100k-200k, 95.7% for AGIs over 200k)
Averages for the 2012 tax year for zip code 28211, filed in 2013:
Average Adjusted Gross Income (AGI) in 2012: $167,703 (Individual Income Tax Returns)
Here:
$167,703
State:
$54,937
Salary/wage: $117,442 (reported on 80.5% of returns)
Here:
$117,442
State:
$46,336
(% of AGI for various income ranges: 70.3% for AGIs below $25k, 79.1% for AGIs $25k-50k, 72.3% for AGIs $50k-75k, 68.2% for AGIs $75k-100k, 71.2% for AGIs $100k-200k, 50.4% for AGIs over 200k)
Taxable interest for individuals: $5,415 (reported on 48.3% of returns)
This zip code:
$5,415
North Carolina:
$1,298
(% of AGI for various income ranges: 1.6% for AGIs below $25k, 0.7% for AGIs $25k-50k, 0.9% for AGIs $50k-75k, 1.2% for AGIs $75k-100k, 1.0% for AGIs $100k-200k, 1.8% for AGIs over 200k)
Ordinary dividends: $17,299 (reported on 43.3% of returns)
Here:
$17,299
State:
$6,213
(% of AGI for various income ranges: 5.5% for AGIs below $25k, 2.4% for AGIs $25k-50k, 3.5% for AGIs $50k-75k, 4.3% for AGIs $75k-100k, 4.3% for AGIs $100k-200k, 4.6% for AGIs over 200k)
Net capital gain/loss in AGI: +$65,965 (reported on 38.1% of returns)
Here:
+$65,965
State:
+$12,740
(% of AGI for various income ranges: 0.5% for AGIs below $25k, 0.9% for AGIs $25k-50k, 1.0% for AGIs $50k-75k, 1.3% for AGIs $75k-100k, 2.8% for AGIs $100k-200k, 20.0% for AGIs over 200k)
Profit/loss from business: +$24,104 (reported on 18.9% of returns)
Here:
+$24,104
State:
+$10,311
(% of AGI for various income ranges: 10.0% for AGIs below $25k, 4.1% for AGIs $25k-50k, 3.5% for AGIs $50k-75k, 3.4% for AGIs $75k-100k, 4.0% for AGIs $100k-200k, 2.1% for AGIs over 200k)
Taxable individual retirement arrangement distribution: $30,466 (reported on 14.2% of returns)
28211:
$30,466
North Carolina:
$15,575
(% of AGI for various income ranges: 4.4% for AGIs below $25k, 3.0% for AGIs $25k-50k, 4.9% for AGIs $50k-75k, 5.3% for AGIs $75k-100k, 4.9% for AGIs $100k-200k, 1.8% for AGIs over 200k)
Self-employment retirement plans: $32,818 (reported on 2.7% of returns)
28211:
$32,818
North Carolina:
$21,078
(% of AGI for various income ranges: 0.4% for AGIs $50k-75k, 0.2% for AGIs $100k-200k, 0.7% for AGIs over 200k)
Total itemized deductions: $51,467 (17% of AGI, reported on 51.9% of returns)
Here:
$51,467
State:
$23,438
Here:
17.4% of AGI
State:
21.5% of AGI
(% of AGI for various income ranges: 17.4% for AGIs below $25k, 13.8% for AGIs $25k-50k, 17.2% for AGIs $50k-75k, 19.1% for AGIs $75k-100k, 19.8% for AGIs $100k-200k, 15.0% for AGIs over 200k)
Charity contributions: $12,707 (reported on 46.9% of returns)
Here:
$12,707
State:
$4,687
(% of AGI for various income ranges: 1.4% for AGIs below $25k, 1.6% for AGIs $25k-50k, 2.5% for AGIs $50k-75k, 2.9% for AGIs $75k-100k, 3.1% for AGIs $100k-200k, 3.9% for AGIs over 200k)
Taxes paid: $24,790 (reported on 51.4% of returns)
28211:
$24,790
State:
$8,823
(% of AGI for various income ranges: 4.0% for AGIs below $25k, 3.9% for AGIs $25k-50k, 5.7% for AGIs $50k-75k, 7.3% for AGIs $75k-100k, 8.8% for AGIs $100k-200k, 7.8% for AGIs over 200k)
Earned income credit: $2,306 (reported on 11.3% of returns)
Here:
$2,306
State:
$2,376
(% of AGI for various income ranges: 6.2% for AGIs below $25k, 0.6% for AGIs $25k-50k)
Percentage of individuals using paid preparers for their 2012 taxes: 57.4%
Here:
57%
State:
53%
(% for various income ranges: 53.8% for AGIs below $25k, 46.7% for AGIs $25k-50k, 53.5% for AGIs $50k-75k, 56.2% for AGIs $75k-100k, 59.5% for AGIs $100k-200k, 77.1% for AGIs over 200k)
Averages for the 2004 tax year for zip code 28211, filed in 2005:
Average Adjusted Gross Income (AGI) in 2004: $119,108 (Individual Income Tax Returns)
Here:
$119,108
State:
$45,376
Salary/wage: $92,601 (reported on 78.2% of returns)
Here:
$92,601
State:
$39,442
(% of AGI for various income ranges: 146.1% for AGIs below $10k, 73.9% for AGIs $10k-25k, 76.6% for AGIs $25k-50k, 69.7% for AGIs $50k-75k, 68.7% for AGIs $75k-100k, 57.7% for AGIs over 100k)
Taxable interest for individuals: $4,395 (reported on 57.1% of returns)
This zip code:
$4,395
North Carolina:
$1,515
(% of AGI for various income ranges: 15.3% for AGIs below $10k, 3.3% for AGIs $10k-25k, 1.7% for AGIs $25k-50k, 2.3% for AGIs $50k-75k, 2.0% for AGIs $75k-100k, 2.0% for AGIs over 100k)
Taxable dividends: $13,194 (reported on 50.3% of returns)
Here:
$13,194
State:
$4,016
(% of AGI for various income ranges: 25.0% for AGIs below $10k, 5.2% for AGIs $10k-25k, 3.6% for AGIs $25k-50k, 4.9% for AGIs $50k-75k, 4.3% for AGIs $75k-100k, 5.8% for AGIs over 100k)
Net capital gain/loss: +$31,855 (reported on 42.6% of returns)
Here:
+$31,855
State:
+$11,152
(% of AGI for various income ranges: -4.7% for AGIs below $10k, 1.3% for AGIs $10k-25k, 1.5% for AGIs $25k-50k, 1.7% for AGIs $50k-75k, 2.2% for AGIs $75k-100k, 13.9% for AGIs over 100k)
Profit/loss from business: +$25,925 (reported on 16.1% of returns)
Here:
+$25,925
State:
+$9,490
(% of AGI for various income ranges: 10.6% for AGIs below $10k, 4.1% for AGIs $10k-25k, 3.8% for AGIs $25k-50k, 4.1% for AGIs $50k-75k, 5.2% for AGIs $75k-100k, 3.3% for AGIs over 100k)
IRA payment deduction: $3,183 (reported on 2.9% of returns)
28211:
$3,183
North Carolina:
$2,967
(% of AGI for various income ranges: 0.3% for AGIs $10k-25k, 0.3% for AGIs $25k-50k, 0.2% for AGIs $50k-75k, 0.2% for AGIs $75k-100k, 0.0% for AGIs over 100k)
Self-employed pension: $22,658 (reported on 3.2% of returns)
Here:
$22,658
North Carolina:
$14,754
(% of AGI for various income ranges: 0.7% for AGIs below $10k, 0.1% for AGIs $25k-50k, 0.2% for AGIs $50k-75k, 0.3% for AGIs $75k-100k, 0.7% for AGIs over 100k)
Total itemized deductions: $37,858 (18% of AGI, reported on 52.6% of returns)
Here:
$37,858
State:
$19,464
Here:
18.4% of AGI
State:
22.7% of AGI
(% of AGI for various income ranges: 42.4% for AGIs below $10k, 16.9% for AGIs $10k-25k, 16.6% for AGIs $25k-50k, 20.8% for AGIs $50k-75k, 22.1% for AGIs $75k-100k, 15.9% for AGIs over 100k)
Charity contributions deductions: $9,080 (4% of AGI, reported on 49.0% of returns)
Here:
$9,080
State:
$4,035
Here:
4.2% of AGI
State:
4.5% of AGI
(% of AGI for various income ranges: 2.9% for AGIs below $10k, 1.9% for AGIs $10k-25k, 2.6% for AGIs $25k-50k, 3.3% for AGIs $50k-75k, 3.7% for AGIs $75k-100k, 3.9% for AGIs over 100k)
Total tax: $28,892 (reported on 79.5% of returns)
28211:
$28,892
State:
$7,257
(% of AGI for various income ranges: 6.4% for AGIs below $10k, 4.2% for AGIs $10k-25k, 7.9% for AGIs $25k-50k, 10.2% for AGIs $50k-75k, 11.0% for AGIs $75k-100k, 21.9% for AGIs over 100k)
Earned income credit: $1,763 (reported on 9.5% of returns)
Here:
$1,763
State:
$1,851
Percentage of individuals using paid preparers for their 2004 taxes: 60.9%
Here:
61%
State:
62%
(% for various income ranges: 59.7% for AGIs below $10k, 61.1% for AGIs $10k-25k, 54.1% for AGIs $25k-50k, 57.5% for AGIs $50k-75k, 58.5% for AGIs $75k-100k, 69.2% for AGIs over 100k)
Likely homosexual households (counted as self-reported same-sex unmarried-partner households)
Lesbian couples: 0.2% of all households
Gay men: 0.1% of all households
Household received Food Stamps/SNAP in the past 12 months: 967 Household did not receive Food Stamps/SNAP in the past 12 months: 12,694
Women who had a birth in the past 12 months: 489 (405 now married, 89 unmarried) Women who did not have a birth in the past 12 months: 7,940 (3,857 now married, 4,091 unmarried)
Housing units in zip code 28211 with a mortgage: 5,582 (758 second mortgage, 7 home equity loan, 751 both second mortgage and home equity loan) Houses without a mortgage: 212
Median monthly owner costs for units with a mortgage: $2,693 Median monthly owner costs for units without a mortgage: $829
Residents with income below the poverty level in 2022:
This zip code:
8.4%
Whole state:
12.8%
Residents with income below 50% of the poverty level in 2022:
This zip code:
3.3%
Whole state:
6.8%
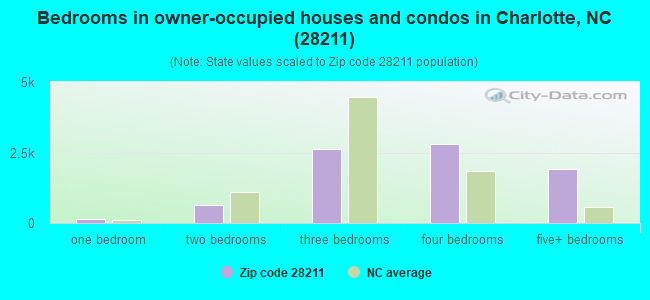
Median number of rooms in houses and condos:
Here:
8.0
State:
6.4
Median number of rooms in apartments:
Here:
4.0
State:
4.4
Notable locations in this zip code not listed on our city pages
Notable locations in zip code 28211: Sharon (A), Alexander Childrens Center (B), Charlotte Fire Department Station 14 (C), Public Library of Charlotte and Mecklenburg County - Morrison Regional Branch (D). Display/hide their locations on the map
Shopping Centers: Providence Village Shopping Center (1), Foxcroft East Shopping Center (2), Cotswold Shopping Center (3). Display/hide their locations on the map
Tourist attraction (not listed on the city page) : Broach Sports Tours & Travel (Tours & Charters; 4425 Randolph Road).
6,022 married couples with children.
1,992 single-parent households (420 men, 1,572 women).
88.4% of residents of 28211 zip code speak English at home.
3.1% of residents speak Spanish at home (78% very well, 8% well, 12% not well, 3% not at all).
6.3% of residents speak other Indo-European language at home (64% very well, 19% well, 16% not well).
1.3% of residents speak Asian or Pacific Island language at home (79% very well, 12% well, 9% not well).
1.0% of residents speak other language at home (82% very well, 18% well).
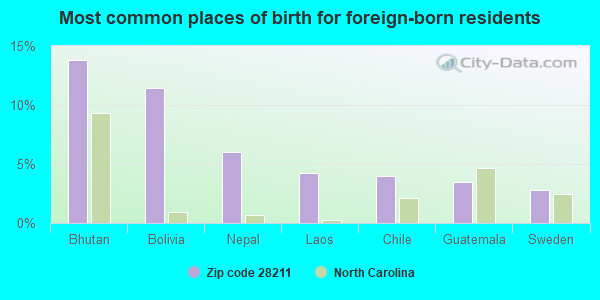
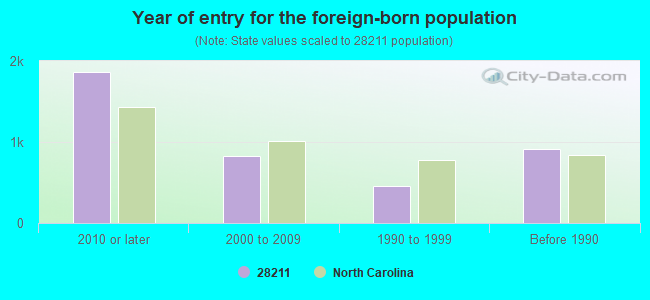
Foreign born population: 3,476 (10.6%) (49.5% of them are naturalized citizens)
Facilities with environmental interests located in this zip code:
ALEXANDER GRAHAM MIDDLE SCHOOL (1800 RUNNYMEDE LN in CHARLOTTE, NC)
(Geographic Names Information System) (National Center for Education Statistics) - STATE ID-399 Organizations: CHARLOTTE-MECKLENBURG SCHOOLS (SCHOOL DISTRICT)
CHARLOTTE MECKLENBURG SCHOOLS TRANS DEPT (3901 CRAIG AVE in CHARLOTTE, NC)
CRITERIA AND HAZARDOUS AIR POLLUTANT INVENTORY (Inventory of air pollution sources) Conditionally Exempt Small Quantity Generators, less than 100 kg/month of hazardous waste (Resource Conservation and Recovery Act (tracking hazardous waste)) - notification Business SIC classification: GASOLINE SERVICE STATIONS Organizations: CHARLOTTE MECKLENBURG BD. OF ED (CONTACT/OWNER)
Alternative names: CHARLOTTE-MECKLENBURG SCHOOL FACILITIES
CIRCLE K #5109 (4474 RANDOLPH ROAD in CHARLOTTE, NC)
AIR MINOR (AIRS/AFS) Business SIC classification: GASOLINE SERVICE STATIONS Alternative names: BP OIL COmpany
ACTION MARKETING INC (951 WENDOVER RD in CHARLOTTE, NC)
Conditionally Exempt Small Quantity Generators, less than 100 kg/month of hazardous waste (Resource Conservation and Recovery Act (tracking hazardous waste)) - notification Organizations: HAZELTINE, MICHAEL (CONTACT/OWNER)
Housing units lacking complete plumbing facilities: 0.6% Housing units lacking complete kitchen facilities: 0.9%
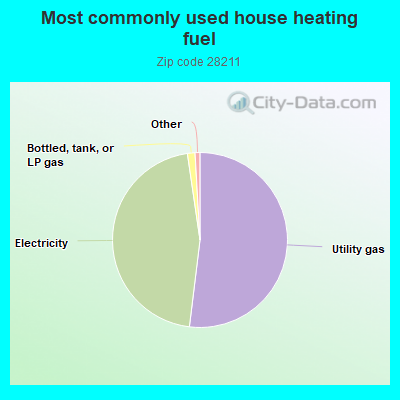
52.0%Utility gas
45.8%Electricity
1.4%Bottled, tank, or LP gas
Population in 1990: 25,478. Population change in the 1990s: +2,279 (+8.9%).
Place of birth for U.S.-born residents:
This state: 14,568
Northeast: 3,946
Midwest: 2,674
South: 6,741
West: 1,004
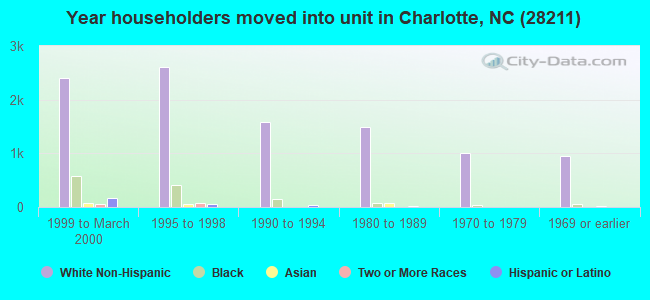
52% of the 28211 zip code residents lived in the same house 5 years ago. Out of people who lived in different houses, 48% lived in this county. Out of people who lived in different counties, 50% lived in North Carolina.
85% of the 28211 zip code residents lived in the same house 1 year ago. Out of people who lived in different houses, 48% moved from this county. Out of people who lived in different houses, 11% moved from different county within same state. Out of people who lived in different houses, 36% moved from different state. Out of people who lived in different houses, 1% moved from abroad.
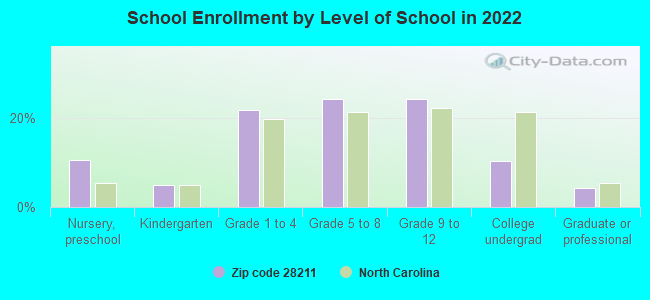
Private vs. public school enrollment:
Students in private schools in grades 1 to 8 (elementary and middle school): 1,445
Here:
39.4%
North Carolina:
13.8%
Students in private schools in grades 9 to 12 (high school): 866
Here:
44.6%
North Carolina:
11.9%
Students in private undergraduate colleges: 194
Here:
24.3%
North Carolina:
19.3%
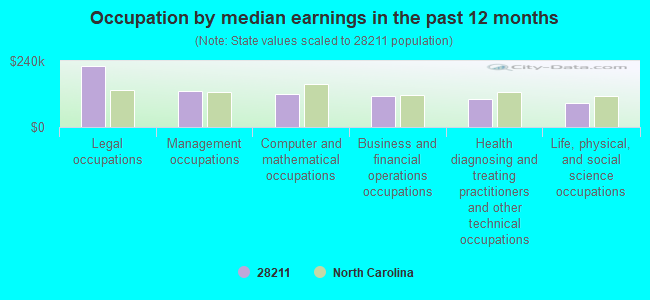
Occupation by median earnings in the past 12 months ($)
221,456Legal occupations
131,221Management occupations
120,901Computer and mathematical occupations
112,819Business and financial operations occupations
103,359Health diagnosing and treating practitioners and other technical occupations
85,593Life, physical, and social science occupations
Companies with federal contracts located in this zip code (CHARLOTTE, NC):
HORIZON LINES, LLC (2101 REXFORD ROAD,SUITE 35) : $34,220,998 in 45 contractsfrom 2001 to 2006
Contracts for Vessel Freight, by Army, Bureau of Prisoners/Federal Prison System Signed by year:2000: $0; 2001: $3,651,900; 2002: $8,501,000; 2003: $2,094,847; 2004: $15,379,280; 2005: $4,591,571; 2006: $2,400.
Biggest contracts:
$4,600,000 with Army for Vessel Freight. Signed on 2002-08-01. Completion date: 2003-07-31.
$4,000,000, same as above.Signed on 2003-07-15. Completion date: 2006-08-01.
$4,000,000, same as above.Signed on 2004-06-15. Completion date: 2005-07-31.
$3,333,333, same as above.Signed on 2004-10-01. Completion date: 2005-07-29.
COCA-COLA BOTTLING CO CNSLD (4115 COCA-COLA PLAZA) : $8,613,279 in 84 contractsfrom 1999 to 2006
Contracts for Food Items For Resale, , Beverages, Nonalcoholic, Dairy Foods and Eggs, and moreby Department of Defense, Defense Commissary Agency, Forest Service, Defense Logistics Agency, and others Signed by year:2000: $1,303,010; 2001: $764,932; 2002: $2,028,733; 2003: $384,022; 2004: $915,164; 2005: $2,740,274; 2006: $2,816.
Biggest contracts:
$758,440 with Department of Defense for Food Items For Resale. Signed on 2002-01-02. Completion date: 2002-07-31.
$620,615 with Defense Commissary Agency for Food Items For Resale. Signed on 2005-04-01. Completion date: 2005-08-31.
$547,077 with Department of Defense for Food Items For Resale. Signed on 2002-10-01. Completion date: 2003-05-31.
$455,222 with Defense Commissary Agency for Food Items For Resale. Signed on 2004-10-01. Completion date: 2005-02-28.
HONEYWELL INTERNATIONAL INC (501 SOUTH SHARON AMITY ROA; small business) : $4,636,529 in 24 contractsfrom 1999 to 2006
Contracts for Maintenance, Repair and Rebuilding of Equipment -- Alarm, Signal, and Security Detection Systems, Phonographs, Radio and Television Sets: Home Type, Fire Control Transmitting and Receiving Equipment, except Airborne, Maintenance, Repair and Rebuilding of Equipment -- Fire Control Equipment, and moreby Army, U.S. Special Operations Command Signed by year:2000: $432,510; 2001: $542,335; 2002: $802,289; 2003: $960,647; 2004: $1,262,287; 2005: $271,980; 2006: $103,000.
Biggest contracts:
$1,172,577 with Army for Maintenance, Repair and Rebuilding of Equipment -- Alarm, Signal, and Security Detection Systems. Signed on 2004-12-23. Completion date: 2002-09-30.
$960,647, same as above.Signed on 2003-11-12. Completion date: 2002-09-30.
$687,719, same as above.Signed on 2002-12-16. Completion date: 2002-09-30.
$542,335, same as above.Signed on 2001-09-28. Completion date: 2002-09-30.
EASTON, EDWARD (2332 SEDLEY RD; small business) : $1,763,269 in 5 contractsfrom 2002 to 2005
Contracts for Radiology Services by Navy Signed by year:2000: $0; 2001: $0; 2002: $567,910; 2003: $399,980; 2004: $398,453; 2005: $396,926; 2006: $0.
Biggest contracts:
$399,980 with Navy for Radiology Services. Signed on 2003-10-01. Completion date: 2002-09-30.
$398,453, same as above.Signed on 2004-10-26. Completion date: 2005-09-30.
$398,453, same as above.Signed on 2002-10-01. Completion date: 2002-09-30.
$396,926, same as above.Signed on 2005-10-19. Completion date: 2005-09-30.
PAUL (2853 WHEELOCK ROAD; small business)
$108,478 with Departmental Offices for Personal Services Contracts. Taking place in DC. Signed on 2004-01-28. Completion date: 2005-01-27.
PROVIDENCE HOLDINGS, LLC (2035 MEADOWOOD LANE; small business)
$100,000 with Air Force for Defense Aircraft -- Management and Support (R&D). Taking place in OH. Signed on 2001-12-14. Completion date: 2002-06-21.
NORCOR TECHNOLOGIES CORP (338 S SHARON AMITY RD; small business)
$23,112 with Army for ADP Input/Output and Storage Devices. Signed on 2005-08-27. Completion date: 2005-09-09.
U S SHIP MANAGEMENT, INC (4525 SHARON ROAD #400; small business) : $1,000 in 2 contractsin 2002
$1,000 with Army for Vessel Freight. Signed on 2002-11-22. Completion date: 2003-11-30.
$0, same as above.Signed on 2002-11-22. Completion date: 2003-11-30.
Top industries in this zip code by the number of employees in 2005:
Health Care and Social Assistance: Offices of Physicians (except Mental Health Specialists) (100-249: 1, 50-99: 3, 20-49: 5, 10-19: 10, 5-9: 9, 1-4: 14)
Administrative and Support and Waste Management and Remediation Services: Temporary Help Services (100-249: 2, 50-99: 3, 20-49: 1, 5-9: 1, 1-4: 4)
Health Care and Social Assistance: Offices of Dentists (20-49: 4, 10-19: 6, 5-9: 24, 1-4: 18)
People in group quarters in 2010:
287 people in nursing facilities/skilled-nursing facilities
35 people in residential treatment centers for juveniles (non-correctional)
18 people in group homes intended for adults
10 people in emergency and transitional shelters (with sleeping facilities) for people experiencing homelessness
People in group quarters in 2000:
424 people in nursing homes
31 people in mental (psychiatric) hospitals or wards
13 people in residential treatment centers for emotionally disturbed children
6 people in homes for the mentally ill
5 people in halfway houses
5 people in homes for the mentally retarded
Fatal accident statistics in 2014:
Fatal accident count: 3
Vehicles involved in fatal accidents: 8
Fatal accidents caused by drunken drivers: 0
Fatalities: 3
Persons involved in fatal accidents: 10
Pedestrians involved in fatal accidents: 0
Fatal accident statistics in 2013:
Fatal accident count: 3
Vehicles involved in fatal accidents: 5
Fatal accidents caused by drunken drivers: 0
Fatalities: 3
Persons involved in fatal accidents: 5
Pedestrians involved in fatal accidents: 0
Home Mortgage Disclosure Act Aggregated Statistics For Year 2009 (Based on 7 full and 8 partial tracts)
A) FHA, FSA/RHS & VA Home Purchase Loans
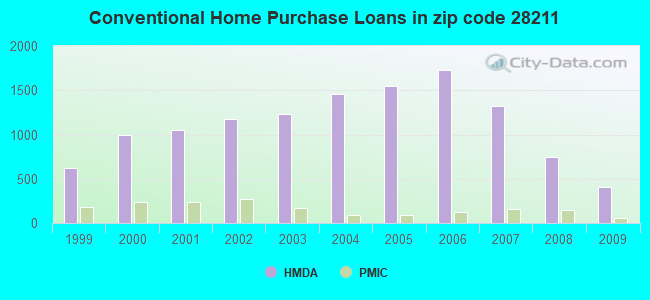
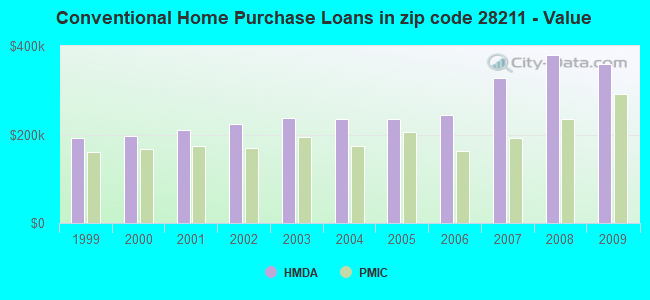
B) Conventional Home Purchase Loans
C) Refinancings
D) Home Improvement Loans
E) Loans on Dwellings For 5+ Families
F) Non-occupant Loans on < 5 Family Dwellings (A B C & D)
Number
Average Value
Number
Average Value
Number
Average Value
Number
Average Value
Number
Average Value
Number
Average Value
LOANS ORIGINATED
99
$211,075
410
$358,483
2,283
$302,273
45
$192,734
2
$11,901,600
78
$200,662
APPLICATIONS APPROVED, NOT ACCEPTED
2
$88,810
34
$374,656
140
$353,925
12
$75,817
0
$0
6
$373,693
APPLICATIONS DENIED
19
$171,271
66
$335,440
479
$314,049
26
$96,968
1
$373,680
40
$182,301
APPLICATIONS WITHDRAWN
13
$142,420
54
$356,529
271
$309,143
6
$177,687
1
$8,076,660
17
$198,218
FILES CLOSED FOR INCOMPLETENESS
2
$98,255
11
$231,800
77
$343,534
8
$259,975
0
$0
3
$153,393
Aggregated Statistics For Year 2008 (Based on 7 full and 8 partial tracts)
A) FHA, FSA/RHS & VA Home Purchase Loans
B) Conventional Home Purchase Loans
C) Refinancings
D) Home Improvement Loans
E) Loans on Dwellings For 5+ Families
F) Non-occupant Loans on < 5 Family Dwellings (A B C & D)
Number
Average Value
Number
Average Value
Number
Average Value
Number
Average Value
Number
Average Value
Number
Average Value
LOANS ORIGINATED
68
$195,777
751
$380,240
1,069
$312,077
100
$174,130
5
$3,932,472
148
$239,014
APPLICATIONS APPROVED, NOT ACCEPTED
5
$135,912
67
$396,953
135
$275,185
18
$88,267
0
$0
18
$183,824
APPLICATIONS DENIED
16
$149,769
115
$331,646
289
$342,987
46
$136,799
1
$128,000
54
$190,347
APPLICATIONS WITHDRAWN
11
$150,621
125
$381,537
153
$267,373
14
$169,094
0
$0
44
$192,639
FILES CLOSED FOR INCOMPLETENESS
0
$0
20
$711,367
38
$304,905
3
$96,137
0
$0
4
$305,762
Aggregated Statistics For Year 2007 (Based on 7 full and 8 partial tracts)
A) FHA, FSA/RHS & VA Home Purchase Loans
B) Conventional Home Purchase Loans
C) Refinancings
D) Home Improvement Loans
E) Loans on Dwellings For 5+ Families
F) Non-occupant Loans on < 5 Family Dwellings (A B C & D)
Number
Average Value
Number
Average Value
Number
Average Value
Number
Average Value
Number
Average Value
Number
Average Value
LOANS ORIGINATED
13
$174,041
1,319
$328,646
1,000
$286,742
127
$140,083
19
$2,544,527
274
$186,961
APPLICATIONS APPROVED, NOT ACCEPTED
0
$0
162
$234,869
180
$246,486
29
$96,312
0
$0
32
$234,742
APPLICATIONS DENIED
5
$156,114
167
$297,717
317
$252,682
55
$94,380
4
$251,108
76
$184,604
APPLICATIONS WITHDRAWN
12
$135,422
174
$259,653
190
$258,063
10
$186,438
3
$634,633
46
$279,570
FILES CLOSED FOR INCOMPLETENESS
0
$0
26
$309,709
51
$369,752
8
$75,621
0
$0
10
$99,692
Aggregated Statistics For Year 2006 (Based on 7 full and 8 partial tracts)
A) FHA, FSA/RHS & VA Home Purchase Loans
B) Conventional Home Purchase Loans
C) Refinancings
D) Home Improvement Loans
F) Non-occupant Loans on < 5 Family Dwellings (A B C & D)
G) Loans On Manufactured Home Dwelling (A B C & D)
Number
Average Value
Number
Average Value
Number
Average Value
Number
Average Value
Number
Average Value
Number
Average Value
LOANS ORIGINATED
12
$146,672
1,724
$243,510
819
$272,887
91
$163,131
320
$184,048
0
$0
APPLICATIONS APPROVED, NOT ACCEPTED
2
$159,860
182
$213,136
144
$204,701
17
$286,526
32
$147,229
0
$0
APPLICATIONS DENIED
5
$158,854
185
$181,096
286
$237,984
55
$146,323
71
$188,693
2
$42,710
APPLICATIONS WITHDRAWN
3
$166,570
147
$224,300
170
$257,579
10
$39,677
20
$183,690
0
$0
FILES CLOSED FOR INCOMPLETENESS
0
$0
19
$149,052
65
$272,609
2
$144,665
7
$110,660
0
$0
Aggregated Statistics For Year 2005 (Based on 7 full and 8 partial tracts)
A) FHA, FSA/RHS & VA Home Purchase Loans
B) Conventional Home Purchase Loans
C) Refinancings
D) Home Improvement Loans
E) Loans on Dwellings For 5+ Families
F) Non-occupant Loans on < 5 Family Dwellings (A B C & D)
G) Loans On Manufactured Home Dwelling (A B C & D)
Number
Average Value
Number
Average Value
Number
Average Value
Number
Average Value
Number
Average Value
Number
Average Value
Number
Average Value
LOANS ORIGINATED
21
$130,848
1,546
$234,934
1,133
$255,586
100
$205,840
4
$595,715
205
$154,246
2
$15,870
APPLICATIONS APPROVED, NOT ACCEPTED
0
$0
118
$227,798
145
$184,120
13
$91,433
0
$0
20
$155,557
2
$41,445
APPLICATIONS DENIED
0
$0
123
$238,926
369
$229,127
61
$95,373
0
$0
46
$151,997
3
$46,743
APPLICATIONS WITHDRAWN
4
$145,902
138
$211,859
185
$260,602
24
$160,052
0
$0
34
$91,556
2
$222,540
FILES CLOSED FOR INCOMPLETENESS
0
$0
30
$266,226
99
$245,677
6
$45,385
0
$0
2
$278,095
0
$0
Aggregated Statistics For Year 2004 (Based on 7 full and 8 partial tracts)
A) FHA, FSA/RHS & VA Home Purchase Loans
B) Conventional Home Purchase Loans
C) Refinancings
D) Home Improvement Loans
E) Loans on Dwellings For 5+ Families
F) Non-occupant Loans on < 5 Family Dwellings (A B C & D)
G) Loans On Manufactured Home Dwelling (A B C & D)
Number
Average Value
Number
Average Value
Number
Average Value
Number
Average Value
Number
Average Value
Number
Average Value
Number
Average Value
LOANS ORIGINATED
31
$171,361
1,452
$235,043
1,309
$244,806
75
$141,527
3
$7,372,600
207
$141,232
0
$0
APPLICATIONS APPROVED, NOT ACCEPTED
1
$115,280
112
$193,291
126
$186,300
7
$174,060
1
$149,470
17
$96,256
4
$28,618
APPLICATIONS DENIED
13
$56,463
130
$195,226
352
$194,831
42
$97,441
1
$373,680
42
$104,632
5
$32,632
APPLICATIONS WITHDRAWN
4
$119,722
96
$245,088
209
$232,450
7
$107,031
0
$0
29
$139,749
0
$0
FILES CLOSED FOR INCOMPLETENESS
0
$0
24
$215,259
72
$207,359
3
$61,313
0
$0
9
$98,877
0
$0
Aggregated Statistics For Year 2003 (Based on 7 full and 8 partial tracts)
A) FHA, FSA/RHS & VA Home Purchase Loans
B) Conventional Home Purchase Loans
C) Refinancings
D) Home Improvement Loans
F) Non-occupant Loans on < 5 Family Dwellings (A B C & D)
Number
Average Value
Number
Average Value
Number
Average Value
Number
Average Value
Number
Average Value
LOANS ORIGINATED
36
$122,252
1,228
$236,613
3,777
$228,363
43
$77,334
214
$145,233
APPLICATIONS APPROVED, NOT ACCEPTED
2
$152,735
91
$255,050
278
$211,200
10
$26,221
32
$119,168
APPLICATIONS DENIED
2
$238,030
106
$152,011
445
$197,862
33
$29,081
43
$120,592
APPLICATIONS WITHDRAWN
5
$144,878
135
$216,071
276
$200,818
0
$0
41
$130,396
FILES CLOSED FOR INCOMPLETENESS
2
$143,810
46
$214,729
52
$202,253
0
$0
6
$145,092
Aggregated Statistics For Year 2002 (Based on 7 full and 8 partial tracts)
A) FHA, FSA/RHS & VA Home Purchase Loans
B) Conventional Home Purchase Loans
C) Refinancings
D) Home Improvement Loans
E) Loans on Dwellings For 5+ Families
F) Non-occupant Loans on < 5 Family Dwellings (A B C & D)
Number
Average Value
Number
Average Value
Number
Average Value
Number
Average Value
Number
Average Value
Number
Average Value
LOANS ORIGINATED
38
$124,581
1,180
$223,016
2,596
$234,371
34
$91,001
2
$14,498,850
193
$126,828
APPLICATIONS APPROVED, NOT ACCEPTED
0
$0
92
$191,216
234
$206,657
17
$61,809
0
$0
26
$98,095
APPLICATIONS DENIED
2
$132,095
87
$213,020
298
$201,259
58
$37,904
0
$0
42
$189,508
APPLICATIONS WITHDRAWN
12
$134,601
99
$266,551
204
$202,551
15
$46,081
0
$0
16
$125,017
FILES CLOSED FOR INCOMPLETENESS
3
$111,293
34
$273,138
65
$163,565
0
$0
0
$0
14
$71,763
Aggregated Statistics For Year 2001 (Based on 7 full and 8 partial tracts)
A) FHA, FSA/RHS & VA Home Purchase Loans
B) Conventional Home Purchase Loans
C) Refinancings
D) Home Improvement Loans
E) Loans on Dwellings For 5+ Families
F) Non-occupant Loans on < 5 Family Dwellings (A B C & D)
Number
Average Value
Number
Average Value
Number
Average Value
Number
Average Value
Number
Average Value
Number
Average Value
LOANS ORIGINATED
60
$104,936
1,050
$209,270
1,754
$239,738
98
$52,472
1
$228,880
110
$131,422
APPLICATIONS APPROVED, NOT ACCEPTED
3
$133,417
98
$201,123
145
$211,840
16
$26,584
0
$0
21
$103,918
APPLICATIONS DENIED
11
$90,109
115
$143,590
214
$195,079
40
$40,243
0
$0
16
$116,639
APPLICATIONS WITHDRAWN
5
$112,190
80
$227,400
158
$194,949
10
$34,506
0
$0
10
$182,886
FILES CLOSED FOR INCOMPLETENESS
2
$98,190
28
$207,632
39
$242,180
1
$28,460
0
$0
7
$107,163
Aggregated Statistics For Year 2000 (Based on 7 full and 8 partial tracts)
A) FHA, FSA/RHS & VA Home Purchase Loans
B) Conventional Home Purchase Loans
C) Refinancings
D) Home Improvement Loans
E) Loans on Dwellings For 5+ Families
F) Non-occupant Loans on < 5 Family Dwellings (A B C & D)
Number
Average Value
Number
Average Value
Number
Average Value
Number
Average Value
Number
Average Value
Number
Average Value
LOANS ORIGINATED
45
$123,288
998
$196,500
459
$193,227
84
$40,542
3
$2,269,840
98
$115,543
APPLICATIONS APPROVED, NOT ACCEPTED
16
$84,480
81
$163,881
82
$194,006
44
$74,391
0
$0
10
$207,519
APPLICATIONS DENIED
6
$91,813
148
$103,939
144
$170,962
50
$44,114
1
$142,930
20
$115,491
APPLICATIONS WITHDRAWN
6
$111,217
93
$226,073
101
$178,809
19
$110,133
0
$0
8
$91,621
FILES CLOSED FOR INCOMPLETENESS
0
$0
22
$430,571
29
$221,976
0
$0
0
$0
0
$0
Aggregated Statistics For Year 1999 (Based on 4 full and 4 partial tracts)
A) FHA, FSA/RHS & VA Home Purchase Loans
B) Conventional Home Purchase Loans
C) Refinancings
D) Home Improvement Loans
E) Loans on Dwellings For 5+ Families
F) Non-occupant Loans on < 5 Family Dwellings (A B C & D)
2005 - 2018 National Fire Incident Reporting System (NFIRS) incidents
Based on the data from the years 2005 - 2018 the average number of fire incidents per year is 51. The highest number of fires - 70 took place in 2006, and the least - 31 in 2009. The data has a declining trend.
When looking into fire subcategories, the most incidents belonged to: Outside Fires (43.6%), and Structure Fires (36.7%).
Fire incident types reported to NFIRS in Zip Code 28211


 Nearest zip codes: 28207, 28205, 28204, 28212, 28209, 28270.


 Based on the data from the years 2005 - 2018 the average number of fire incidents per year is 51. The highest number of fires - 70 took place in 2006, and the least - 31 in 2009. The data has a declining trend.
 When looking into fire subcategories, the most incidents belonged to: Outside Fires (43.6%), and Structure Fires (36.7%).