Estimated zip code population in 2022: 24,237 Zip code population in 2010: 20,317 Zip code population in 2000: 19,759
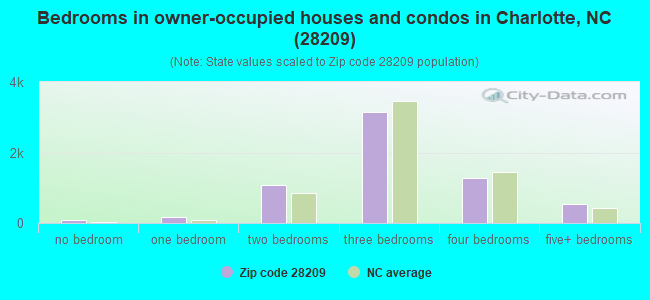
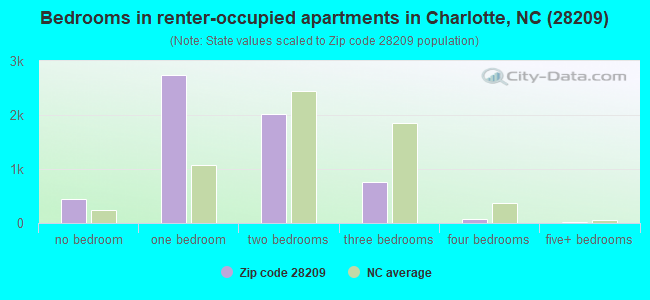
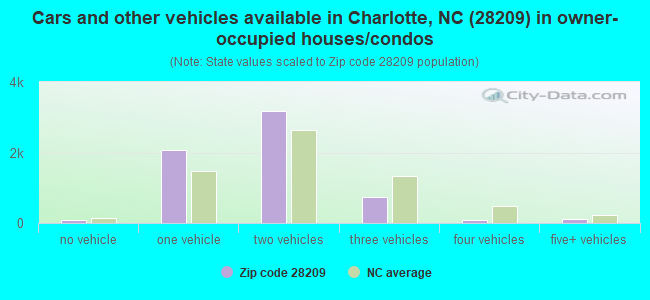
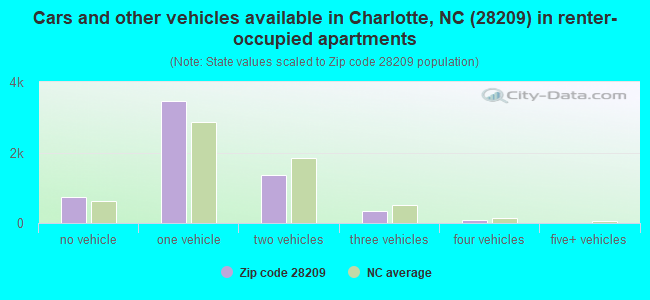
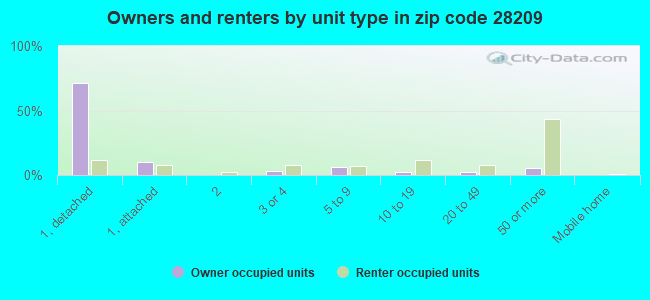
Houses and condos: 13,362 Renter-occupied apartments: 6,025
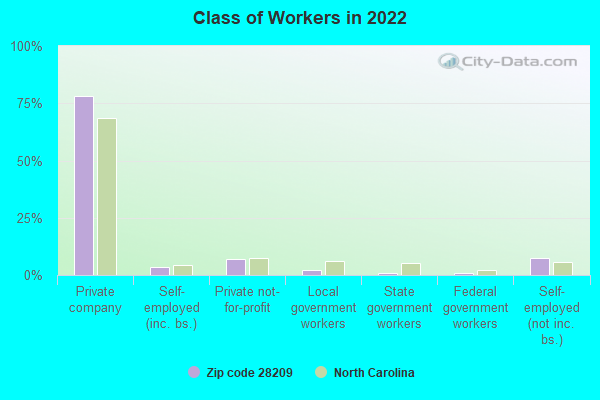
% of renters here:
49%
State:
33%
March 2022 cost of living index in zip code 28209: 95.9 (near average, U.S. average is 100)
Land area: 5.5 sq. mi. Water area: 0.0 sq. mi.
Population density: 4,420 people per square mile
(average).
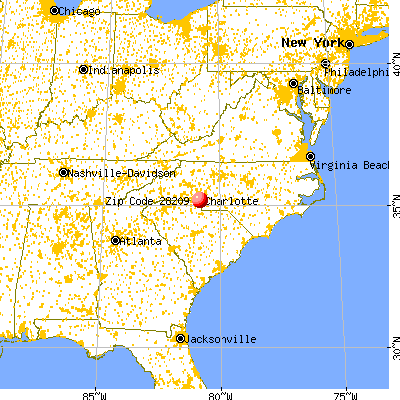
OSM Map
General Map
Google Map
MSN Map
OSM Map
General Map
Google Map
MSN Map
OSM Map
General Map
Google Map
MSN Map
OSM Map
General Map
Google Map
MSN Map
Please wait while loading the map...
Real estate property taxes paid for housing units in 2022:
This zip code:
0.6% ($3,951)
North Carolina:
0.6% ($1,769)
Median real estate property taxes paid for housing units with mortgages in 2022: $3,995 (0.6%) Median real estate property taxes paid for housing units with no mortgage in 2022: $3,829 (0.7%)
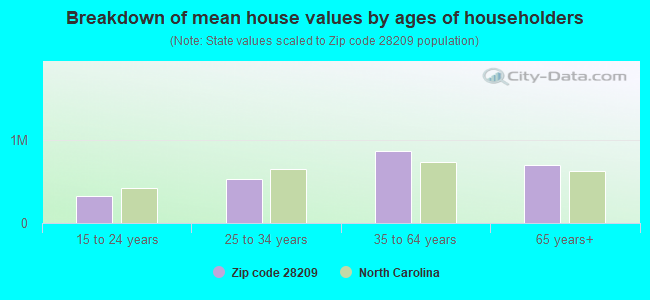
Estimated median house/condo value in 2022: $635,859
28209:
$635,859
North Carolina:
$280,600
According to our research of North Carolina and other state lists, there were 6 registered sex offenders living in 28209 zip code as of April 27, 2024. The ratio of all residents to sex offenders in zip code 28209 is 3,693 to 1. The ratio of registered sex offenders to all residents in this zip code is much lower than the state average.
Median resident age:
This zip code:
33.8 years
North Carolina median age:
39.2 years
Average household size:
This zip code:
1.9 people
North Carolina:
2.4 people
Averages for the 2020 tax year for zip code 28209, filed in 2021:
Average Adjusted Gross Income (AGI) in 2020: $137,188 (Individual Income Tax Returns)
Here:
$137,188
State:
$70,020
Salary/wage: $109,311 (reported on 87.1% of returns)
Here:
$109,311
State:
$58,387
(% of AGI for various income ranges: 1251.4% for AGIs below $25k, 4189.9% for AGIs $25k-50k, 7369.4% for AGIs $50k-75k, 10840.0% for AGIs $75k-100k, 20274.3% for AGIs $100k-200k, 109166.2% for AGIs over 200k)
Taxable interest for individuals: $2,482 (reported on 37.8% of returns)
This zip code:
$2,482
North Carolina:
$1,479
(% of AGI for various income ranges: 12.8% for AGIs below $25k, 16.3% for AGIs $25k-50k, 33.6% for AGIs $50k-75k, 47.8% for AGIs $75k-100k, 117.9% for AGIs $100k-200k, 1503.2% for AGIs over 200k)
Ordinary dividends: $9,592 (reported on 38.4% of returns)
Here:
$9,592
State:
$7,888
(% of AGI for various income ranges: 72.7% for AGIs below $25k, 63.9% for AGIs $25k-50k, 121.9% for AGIs $50k-75k, 231.9% for AGIs $75k-100k, 627.0% for AGIs $100k-200k, 5469.2% for AGIs over 200k)
Net capital gain/loss in AGI: +$46,739 (reported on 34.4% of returns)
Here:
+$46,739
State:
+$23,652
(% of AGI for various income ranges: 48.5% for AGIs below $25k, 74.6% for AGIs $25k-50k, 116.1% for AGIs $50k-75k, 246.4% for AGIs $75k-100k, 752.8% for AGIs $100k-200k, 31413.5% for AGIs over 200k)
Profit/loss from business: +$21,203 (reported on 17.1% of returns)
Here:
+$21,203
State:
+$11,710
(% of AGI for various income ranges: 157.5% for AGIs below $25k, 202.9% for AGIs $25k-50k, 215.1% for AGIs $50k-75k, 311.1% for AGIs $75k-100k, 810.7% for AGIs $100k-200k, 3952.2% for AGIs over 200k)
Taxable individual retirement arrangement distribution: $21,700 (reported on 7.4% of returns)
28209:
$21,700
North Carolina:
$20,247
(% of AGI for various income ranges: 68.2% for AGIs below $25k, 96.2% for AGIs $25k-50k, 125.8% for AGIs $50k-75k, 231.9% for AGIs $75k-100k, 494.5% for AGIs $100k-200k, 1249.2% for AGIs over 200k)
Self-employed (Keogh) retirement plans: $29,738 (reported on 1.8% of returns)
28209:
$29,738
North Carolina:
$26,749
(% of AGI for various income ranges: 13.9% for AGIs $25k-50k, 66.4% for AGIs $100k-200k, 961.1% for AGIs over 200k)
Total itemized deductions: $33,941 (reported on 20.6% of returns)
Here:
$33,941
State:
$34,549
(% of AGI for various income ranges: 74.2% for AGIs below $25k, 128.4% for AGIs $25k-50k, 263.4% for AGIs $50k-75k, 686.4% for AGIs $75k-100k, 1578.3% for AGIs $100k-200k, 9410.6% for AGIs over 200k)
Charity contributions: $10,220 (reported on 17.6% of returns)
Here:
$10,220
State:
$13,360
(% of AGI for various income ranges: 6.1% for AGIs below $25k, 20.6% for AGIs $25k-50k, 38.2% for AGIs $50k-75k, 96.1% for AGIs $75k-100k, 266.4% for AGIs $100k-200k, 2959.7% for AGIs over 200k)
Taxes paid: $8,974 (reported on 20.5% of returns)
28209:
$8,974
State:
$7,586
(% of AGI for various income ranges: 15.4% for AGIs below $25k, 28.8% for AGIs $25k-50k, 75.6% for AGIs $50k-75k, 210.7% for AGIs $75k-100k, 562.4% for AGIs $100k-200k, 2152.1% for AGIs over 200k)
Earned income credit: $1,722 (reported on 6.9% of returns)
Here:
$1,722
State:
$2,337
(% of AGI for various income ranges: 65.2% for AGIs below $25k, 19.8% for AGIs $25k-50k)
Percentage of individuals using paid preparers for their 2020 taxes: 93.7%
Here:
94%
State:
93%
(% for various income ranges: 90.3% for AGIs below $25k, 93.6% for AGIs $25k-50k, 94.9% for AGIs $50k-75k, 94.0% for AGIs $75k-100k, 94.4% for AGIs $100k-200k, 95.8% for AGIs over 200k)
Averages for the 2012 tax year for zip code 28209, filed in 2013:
Average Adjusted Gross Income (AGI) in 2012: $84,735 (Individual Income Tax Returns)
Here:
$84,735
State:
$54,937
Salary/wage: $73,847 (reported on 86.0% of returns)
Here:
$73,847
State:
$46,336
(% of AGI for various income ranges: 75.4% for AGIs below $25k, 87.1% for AGIs $25k-50k, 81.6% for AGIs $50k-75k, 78.7% for AGIs $75k-100k, 80.9% for AGIs $100k-200k, 67.0% for AGIs over 200k)
Taxable interest for individuals: $1,553 (reported on 38.7% of returns)
This zip code:
$1,553
North Carolina:
$1,298
(% of AGI for various income ranges: 1.0% for AGIs below $25k, 0.5% for AGIs $25k-50k, 0.6% for AGIs $50k-75k, 0.6% for AGIs $75k-100k, 0.6% for AGIs $100k-200k, 0.8% for AGIs over 200k)
Ordinary dividends: $6,400 (reported on 32.2% of returns)
Here:
$6,400
State:
$6,213
(% of AGI for various income ranges: 3.0% for AGIs below $25k, 1.5% for AGIs $25k-50k, 2.0% for AGIs $50k-75k, 2.3% for AGIs $75k-100k, 2.3% for AGIs $100k-200k, 2.8% for AGIs over 200k)
Net capital gain/loss in AGI: +$16,857 (reported on 25.4% of returns)
Here:
+$16,857
State:
+$12,740
(% of AGI for various income ranges: 0.4% for AGIs $25k-50k, 0.9% for AGIs $50k-75k, 1.2% for AGIs $75k-100k, 1.6% for AGIs $100k-200k, 9.9% for AGIs over 200k)
Profit/loss from business: +$17,280 (reported on 16.7% of returns)
Here:
+$17,280
State:
+$10,311
(% of AGI for various income ranges: 9.8% for AGIs below $25k, 2.8% for AGIs $25k-50k, 3.1% for AGIs $50k-75k, 3.7% for AGIs $75k-100k, 3.9% for AGIs $100k-200k, 2.6% for AGIs over 200k)
Taxable individual retirement arrangement distribution: $17,150 (reported on 9.4% of returns)
28209:
$17,150
North Carolina:
$15,575
(% of AGI for various income ranges: 3.6% for AGIs below $25k, 1.7% for AGIs $25k-50k, 2.2% for AGIs $50k-75k, 2.8% for AGIs $75k-100k, 2.7% for AGIs $100k-200k, 1.2% for AGIs over 200k)
Self-employment retirement plans: $21,317 (reported on 1.6% of returns)
28209:
$21,317
North Carolina:
$21,078
(% of AGI for various income ranges: 0.3% for AGIs $50k-75k, 0.3% for AGIs $100k-200k, 0.7% for AGIs over 200k)
Total itemized deductions: $28,775 (18% of AGI, reported on 42.8% of returns)
Here:
$28,775
State:
$23,438
Here:
18.4% of AGI
State:
21.5% of AGI
(% of AGI for various income ranges: 12.1% for AGIs below $25k, 9.6% for AGIs $25k-50k, 14.7% for AGIs $50k-75k, 16.6% for AGIs $75k-100k, 17.5% for AGIs $100k-200k, 14.3% for AGIs over 200k)
Charity contributions: $4,293 (reported on 37.3% of returns)
Here:
$4,293
State:
$4,687
(% of AGI for various income ranges: 1.0% for AGIs below $25k, 1.1% for AGIs $25k-50k, 1.8% for AGIs $50k-75k, 1.9% for AGIs $75k-100k, 1.9% for AGIs $100k-200k, 2.2% for AGIs over 200k)
Taxes paid: $13,960 (reported on 42.8% of returns)
28209:
$13,960
State:
$8,823
(% of AGI for various income ranges: 3.0% for AGIs below $25k, 2.9% for AGIs $25k-50k, 5.2% for AGIs $50k-75k, 6.9% for AGIs $75k-100k, 8.4% for AGIs $100k-200k, 8.3% for AGIs over 200k)
Earned income credit: $1,903 (reported on 10.9% of returns)
Here:
$1,903
State:
$2,376
(% of AGI for various income ranges: 4.2% for AGIs below $25k, 0.4% for AGIs $25k-50k)
Percentage of individuals using paid preparers for their 2012 taxes: 50.9%
Here:
51%
State:
53%
(% for various income ranges: 52.1% for AGIs below $25k, 44.3% for AGIs $25k-50k, 46.2% for AGIs $50k-75k, 50.6% for AGIs $75k-100k, 54.3% for AGIs $100k-200k, 70.7% for AGIs over 200k)
Averages for the 2004 tax year for zip code 28209, filed in 2005:
Average Adjusted Gross Income (AGI) in 2004: $63,145 (Individual Income Tax Returns)
Here:
$63,145
State:
$45,376
Salary/wage: $57,236 (reported on 83.7% of returns)
Here:
$57,236
State:
$39,442
(% of AGI for various income ranges: 109.5% for AGIs below $10k, 78.2% for AGIs $10k-25k, 85.5% for AGIs $25k-50k, 80.8% for AGIs $50k-75k, 82.8% for AGIs $75k-100k, 69.9% for AGIs over 100k)
Taxable interest for individuals: $2,219 (reported on 46.1% of returns)
This zip code:
$2,219
North Carolina:
$1,515
(% of AGI for various income ranges: 8.4% for AGIs below $10k, 2.0% for AGIs $10k-25k, 1.3% for AGIs $25k-50k, 1.3% for AGIs $50k-75k, 1.0% for AGIs $75k-100k, 1.8% for AGIs over 100k)
Taxable dividends: $5,020 (reported on 36.0% of returns)
Here:
$5,020
State:
$4,016
(% of AGI for various income ranges: 11.2% for AGIs below $10k, 2.7% for AGIs $10k-25k, 1.8% for AGIs $25k-50k, 2.0% for AGIs $50k-75k, 2.5% for AGIs $75k-100k, 3.3% for AGIs over 100k)
Net capital gain/loss: +$11,167 (reported on 29.2% of returns)
Here:
+$11,167
State:
+$11,152
(% of AGI for various income ranges: -2.4% for AGIs below $10k, 0.3% for AGIs $10k-25k, 0.6% for AGIs $25k-50k, 1.5% for AGIs $50k-75k, 1.5% for AGIs $75k-100k, 8.7% for AGIs over 100k)
Profit/loss from business: +$15,525 (reported on 15.1% of returns)
Here:
+$15,525
State:
+$9,490
(% of AGI for various income ranges: 14.1% for AGIs below $10k, 5.4% for AGIs $10k-25k, 3.0% for AGIs $25k-50k, 4.1% for AGIs $50k-75k, 3.4% for AGIs $75k-100k, 3.6% for AGIs over 100k)
IRA payment deduction: $2,883 (reported on 2.8% of returns)
28209:
$2,883
North Carolina:
$2,967
(% of AGI for various income ranges: 0.5% for AGIs below $10k, 0.3% for AGIs $10k-25k, 0.3% for AGIs $25k-50k, 0.2% for AGIs $50k-75k, 0.2% for AGIs $75k-100k, 0.0% for AGIs over 100k)
Self-employed pension: $14,104 (reported on 1.7% of returns)
Here:
$14,104
North Carolina:
$14,754
(% of AGI for various income ranges: 0.1% for AGIs $25k-50k, 0.3% for AGIs $50k-75k, 0.3% for AGIs $75k-100k, 0.6% for AGIs over 100k)
Total itemized deductions: $22,052 (20% of AGI, reported on 46.0% of returns)
Here:
$22,052
State:
$19,464
Here:
20.2% of AGI
State:
22.7% of AGI
(% of AGI for various income ranges: 26.9% for AGIs below $10k, 13.2% for AGIs $10k-25k, 13.9% for AGIs $25k-50k, 19.1% for AGIs $50k-75k, 20.8% for AGIs $75k-100k, 15.3% for AGIs over 100k)
Charity contributions deductions: $3,720 (3% of AGI, reported on 41.5% of returns)
Here:
$3,720
State:
$4,035
Here:
3.2% of AGI
State:
4.5% of AGI
(% of AGI for various income ranges: 2.0% for AGIs below $10k, 1.6% for AGIs $10k-25k, 1.8% for AGIs $25k-50k, 2.4% for AGIs $50k-75k, 2.6% for AGIs $75k-100k, 2.7% for AGIs over 100k)
Total tax: $12,221 (reported on 80.9% of returns)
28209:
$12,221
State:
$7,257
(% of AGI for various income ranges: 4.3% for AGIs below $10k, 4.5% for AGIs $10k-25k, 8.6% for AGIs $25k-50k, 11.5% for AGIs $50k-75k, 12.5% for AGIs $75k-100k, 20.7% for AGIs over 100k)
Earned income credit: $1,573 (reported on 10.7% of returns)
Here:
$1,573
State:
$1,851
Percentage of individuals using paid preparers for their 2004 taxes: 56.0%
Here:
56%
State:
62%
(% for various income ranges: 54.8% for AGIs below $10k, 60.4% for AGIs $10k-25k, 50.3% for AGIs $25k-50k, 54.6% for AGIs $50k-75k, 53.4% for AGIs $75k-100k, 64.1% for AGIs over 100k)
Likely homosexual households (counted as self-reported same-sex unmarried-partner households)
Lesbian couples: 0.5% of all households
Gay men: 0.7% of all households
Household received Food Stamps/SNAP in the past 12 months: 685 Household did not receive Food Stamps/SNAP in the past 12 months: 11,563
Women who had a birth in the past 12 months: 380 (349 now married, 38 unmarried) Women who did not have a birth in the past 12 months: 6,876 (2,448 now married, 4,417 unmarried)
Housing units in zip code 28209 with a mortgage: 4,873 (644 second mortgage, 7 home equity loan, 629 both second mortgage and home equity loan) Houses without a mortgage: 34
Median monthly owner costs for units with a mortgage: $2,072 Median monthly owner costs for units without a mortgage: $712
Residents with income below the poverty level in 2022:
This zip code:
8.8%
Whole state:
12.8%
Residents with income below 50% of the poverty level in 2022:
This zip code:
5.4%
Whole state:
6.8%
Median number of rooms in houses and condos:
Here:
6.5
State:
6.4
Median number of rooms in apartments:
Here:
3.3
State:
4.4
Notable locations in this zip code not listed on our city pages
Notable locations in zip code 28209: Myers Park Country Club (A), Park Square (B), Charlotte Fire Department Station 12 (C), Public Library of Charlotte and Mecklenburg County - Scaleybark Branch (D). Display/hide their locations on the map
In group quarters: 248 (-1 institutionalized population)
Size of family households: 2,429 2-persons, 959 3-persons, 1,083 4-persons, 399 5-persons, 45 6-persons, 20 7-or-more-persons
Size of nonfamily households: 5,685 1-person, 1,445 2-persons, 241 3-persons
3,111 married couples with children.
1,320 single-parent households (324 men, 996 women).
88.5% of residents of 28209 zip code speak English at home.
5.7% of residents speak Spanish at home (53% very well, 11% well, 15% not well, 22% not at all).
3.3% of residents speak other Indo-European language at home (74% very well, 17% well, 10% not well).
2.0% of residents speak Asian or Pacific Island language at home (59% very well, 18% well, 23% not well).
0.1% of residents speak other language at home (65% very well, 35% well).
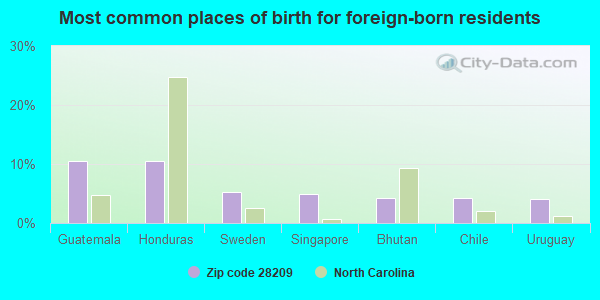
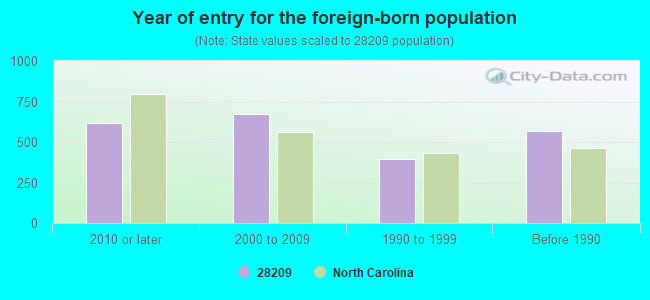
Foreign born population: 2,035 (8.4%) (51.2% of them are naturalized citizens)
Facilities with environmental interests located in this zip code:
COACHMAN CLEANERS. INCORPORATED (4001 PARKS ROAD in CHARLOTTE, NC)
STATE MASTER (North Carolina facility info) - UNDERGROUND STORAGE TANK PROGRAM Small Quantity Generators, between 100 kg and 1000 kg of hazardous waste/month (Resource Conservation and Recovery Act (tracking hazardous waste)) - notification Business SIC classification: NONCLASSIFIABLE ESTABLISHMENTS Organizations: FRANK GEDDINGS (CONTACT/OWNER)
CHARLOTTE IMPORT CARS (4438 SOUTH BLVD in CHARLOTTE, NC)
(Resource Conservation and Recovery Act (tracking hazardous waste)) Organizations: COLLINS, WILLIAM (CONTACT/OWNER)
, WILLIAM, COLLINS (CONTACT/OWNER)
A CLEANER WORLD NO 115 (420 WOODLAWN RD in CHARLOTTE, NC)
(Resource Conservation and Recovery Act (tracking hazardous waste)) Organizations: ROGER D SELLERS (CONTACT/OWNER)
BRIDGE TERMINAL TRANSPORT INC (6000 CARNEGIE BOULEVARD in CHARLOTTE, NC)
TRANSPORTER (Resource Conservation and Recovery Act (tracking hazardous waste)) Alternative names: HOECHST CELANESE
DOBBS AUTO & TRUCK (HWY 74 RTE 4 BOX 224 in LUMBERTON, NC)
Conditionally Exempt Small Quantity Generators, less than 100 kg/month of hazardous waste (Resource Conservation and Recovery Act (tracking hazardous waste)) - notification Organizations: DOBBS AUTO & TRUCK PARTS (CONTACT/OWNER)
B & K ACQUISITION COMPANY, INC. (1601 EAST FOURTH STREET in CHARLOTTE, NC)
COMPLIANCE ACTIVITY (Tracking inspections of insecticide, fungicide, and rodenticide, and toxic substances)
Housing units lacking complete plumbing facilities: 0.5% Housing units lacking complete kitchen facilities: 1.7%
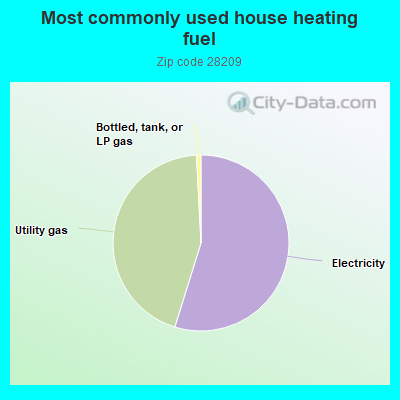
54.7%Electricity
44.3%Utility gas
0.8%Bottled, tank, or LP gas
Population in 1990: 18,190. Population change in the 1990s: +1,569 (+8.6%).
Place of birth for U.S.-born residents:
This state: 10,020
Northeast: 3,378
Midwest: 2,281
South: 5,376
West: 1,037
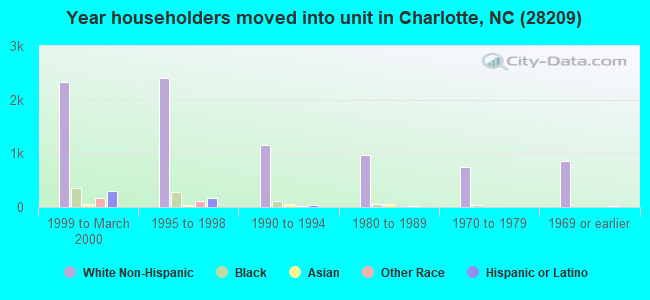
49% of the 28209 zip code residents lived in the same house 5 years ago. Out of people who lived in different houses, 54% lived in this county. Out of people who lived in different counties, 50% lived in North Carolina.
82% of the 28209 zip code residents lived in the same house 1 year ago. Out of people who lived in different houses, 54% moved from this county. Out of people who lived in different houses, 9% moved from different county within same state. Out of people who lived in different houses, 28% moved from different state. Out of people who lived in different houses, 2% moved from abroad.
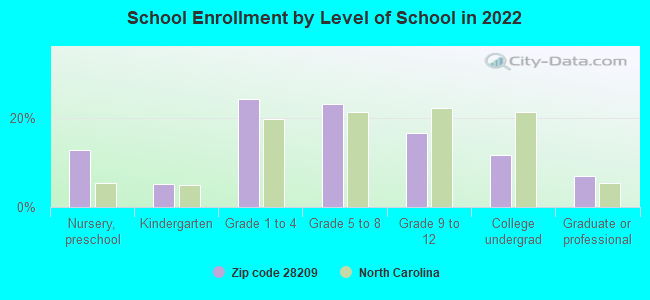
Private vs. public school enrollment:
Students in private schools in grades 1 to 8 (elementary and middle school): 452
Here:
22.9%
North Carolina:
13.8%
Students in private schools in grades 9 to 12 (high school): 250
Here:
35.8%
North Carolina:
11.9%
Students in private undergraduate colleges: 260
Here:
54.8%
North Carolina:
19.3%
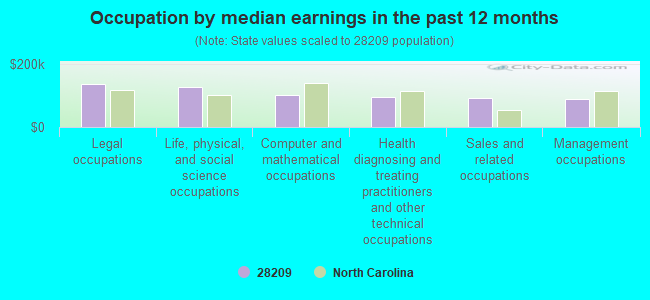
Occupation by median earnings in the past 12 months ($)
135,433Legal occupations
127,532Life, physical, and social science occupations
100,193Computer and mathematical occupations
95,063Health diagnosing and treating practitioners and other technical occupations
92,776Sales and related occupations
88,246Management occupations
Companies with federal contracts located in this zip code (CHARLOTTE, NC):
MAERSK SEALAND (; small business) : $1,202,714 in 10 contractsfrom 2002 to 2004
Contracts for Vessel Freight by U.S. Agency for International Development, Agency for International Development (disused code: now 7200) Signed by year:2000: $0; 2001: $0; 2002: $572,714; 2003: $0; 2004: $630,000; 2005: $0; 2006: $0.
Biggest contracts:
$630,000 with U.S. Agency for International Development for Vessel Freight. Taking place in DC. Signed on 2004-09-15. Completion date: 2005-01-15.
$345,000 with Agency for International Development (disused code: now 7200) for Vessel Freight. Taking place in DC. Signed on 2002-05-15. Completion date: 2002-07-15.
$166,000, same as above.Signed on 2002-03-15. Completion date: 2002-05-15.
$53,000, same as above.Signed on 2002-06-15. Completion date: 2002-09-15.
AT&T WIRELESS (5925 CARNEGIE BLVD) : $357,170 in 5 contractsfrom 2001 to 2002
Contracts for Telephone and/or Communications Services (includes Telegraph, Telex, and Cablevision Services) by Army Signed by year:2000: $0; 2001: $297,440; 2002: $59,730; 2003: $0; 2004: $0; 2005: $0; 2006: $0.
Biggest contracts:
$260,000 with Army for Telephone and/or Communications Services (includes Telegraph, Telex, and Cablevision Services). Taking place in TX. Signed on 2001-06-15. Completion date: 2001-10-20.
$70,000, same as above.Signed on 2002-05-03. Completion date: 2001-06-20.
$37,440, same as above.Signed on 2001-09-06. Completion date: 2001-10-20.
$0, same as above.Signed on 2002-05-07. Completion date: 2001-06-20.
PATTONS INC (3201 SOUTH BLVD; small business) : $159,818 in 11 contractsfrom 2002 to 2006
Contracts for Maintenance, Repair or Alteration of Real Property -- Other Industrial Buildings, Gas Generating and Dispensing Systems, Fixed or Mobile, Compressors and Vacuum Pumps, Miscellaneous Special Industry Machinery, and moreby Navy, Air Force, Army, National Oceanic and Atmospheric Administration/Under Secretary for Oceans and Atmosphere, and others Signed by year:2000: $0; 2001: $0; 2002: $8,322; 2003: $3,784; 2004: $0; 2005: $133,949; 2006: $13,763.
Biggest contracts:
$119,304 with Navy for Maintenance, Repair or Alteration of Real Property -- Other Industrial Buildings. Signed on 2005-07-28. Completion date: 2005-09-30.
$11,800 with Air Force for Gas Generating and Dispensing Systems, Fixed or Mobile. Taking place in SC. Signed on 2005-07-26. Completion date: 2005-08-04.
$6,180 with Army for Compressors and Vacuum Pumps. Signed on 2006-03-21. Completion date: 2006-03-29.
$5,000 with Army for Miscellaneous Special Industry Machinery. Taking place in SC. Signed on 2002-08-20. Completion date: 2002-08-30.
EAP OF THE CAROLINAS, INC (5200 PARK RD; small business) : $114,000 in 2 contractsfrom 2004 to 2005
$57,000 with Navy for Other Social Services. Signed on 2005-05-20. Completion date: 2005-06-12.
$57,000 with Navy for Other Professional Services. Signed on 2004-06-09. Completion date: 2005-06-12.
UNIVERSAL MARITIME SERVICE COR (6000 CARNAGIE BLVD)
$107,678 with Army for Stevedoring. Taking place in VA. Signed on 2003-02-04. Completion date: 2003-09-30.
ALBANY INSTRUMENTS INCORPORATE (1500 PRINCETON AVENUE; small business)
$99,682 with Air Force for Other Defense -- Operational Systems Development (R&D). Signed on 2001-04-13. Completion date: 2002-01-02.
GLENAYRE ELECTRONICS, INC. (5935 CARNEGIE BLVD.) : $91,418 in 2 contractsin 2000
$59,000 with Navy for Miscellaneous Electrical and Electronic Components. Taking place in MD. Signed on 2000-09-08. Completion date: 2000-10-20.
$32,418, same as above.Signed on 2000-04-19. Completion date: 2000-06-16.
HYATT INTERNATIONAL CORPORATIO (5501 CARNEGIE BLVD) : $28,234 in 3 contractsin 2005
$19,506 with Drug Enforcement Administration for Lodging - Hotel/Motel. Signed on 2005-01-31. Completion date: 2005-03-05.
$4,500 with Army for Lodging - Hotel/Motel. Signed on 2005-11-02. Completion date: 2005-11-04.
$4,228 with Drug Enforcement Administration for Lodging - Hotel/Motel. Signed on 2005-04-05. Completion date: 2005-04-05.
EVIDEX INC (1204 PRINCETON AVE; small business) : $20,300 in 3 contractsfrom 2004 to 2006
$11,400 with Army for Other Professional Services. Taking place in AL. Signed on 2004-09-12. Completion date: 2004-09-29.
$11,400 with U.S. Army Corps of Engineers - civil program financing only for Other Professional Services. Taking place in AL. Signed on 2004-09-12. Completion date: 2004-09-29.
-$2,500 with Army for Other Professional Services. Taking place in AL. Signed on 2006-04-26. Completion date: 2004-09-29.
SECURITY INFORMATION GROUP INC (5200 PARK RD STE 122; small business)
$5,235 with Army for Maintenance, Repair or Alteration of Real Property -- Other Administrative Facilities and Service Buildings. Signed on 2003-09-27. Completion date: 2004-01-24.
Top industries in this zip code by the number of employees in 2005:
2005 - 2018 National Fire Incident Reporting System (NFIRS) incidents
Based on the data from the years 2005 - 2018 the average number of fire incidents per year is 34. The highest number of fires - 56 took place in 2008, and the least - 21 in 2016. The data has a declining trend.
When looking into fire subcategories, the most incidents belonged to: Outside Fires (46.1%), and Structure Fires (33.6%).
Fire incident types reported to NFIRS in Zip Code 28209


 Nearest zip codes: 28203, 28207, 28204, 28282, 28244, 28210.


 Based on the data from the years 2005 - 2018 the average number of fire incidents per year is 34. The highest number of fires - 56 took place in 2008, and the least - 21 in 2016. The data has a declining trend.
 When looking into fire subcategories, the most incidents belonged to: Outside Fires (46.1%), and Structure Fires (33.6%).