Estimated zip code population in 2022: 54,589 Zip code population in 2010: 47,208 Zip code population in 2000: 29,763
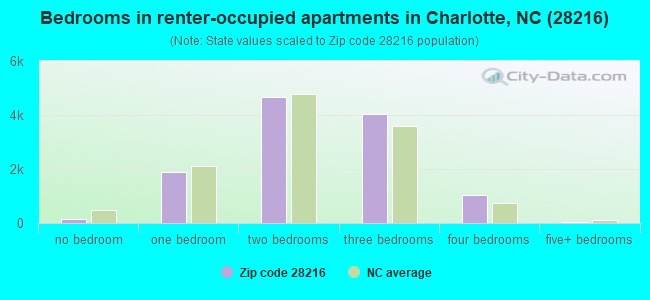
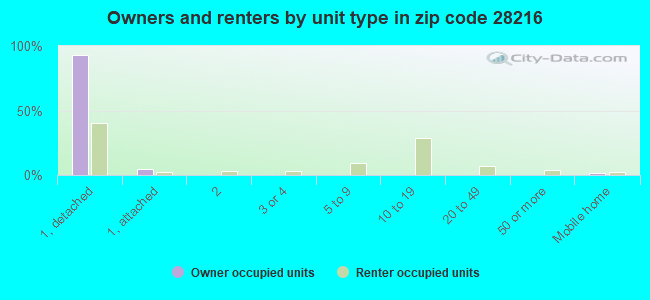
Houses and condos: 25,654 Renter-occupied apartments: 11,820
% of renters here:
49%
State:
33%
March 2022 cost of living index in zip code 28216: 93.2 (less than average, U.S. average is 100)
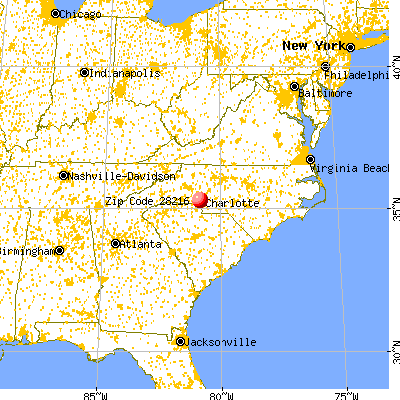
Land area: 29.9 sq. mi. Water area: 0.6 sq. mi.
Population density: 1,826 people per square mile
(low).
OSM Map
General Map
Google Map
MSN Map
OSM Map
General Map
Google Map
MSN Map
OSM Map
General Map
Google Map
MSN Map
OSM Map
General Map
Google Map
MSN Map
Please wait while loading the map...
Real estate property taxes paid for housing units in 2022:
This zip code:
0.7% ($1,820)
North Carolina:
0.6% ($1,769)
Median real estate property taxes paid for housing units with mortgages in 2022: $1,908 (0.7%) Median real estate property taxes paid for housing units with no mortgage in 2022: $1,538 (0.7%)
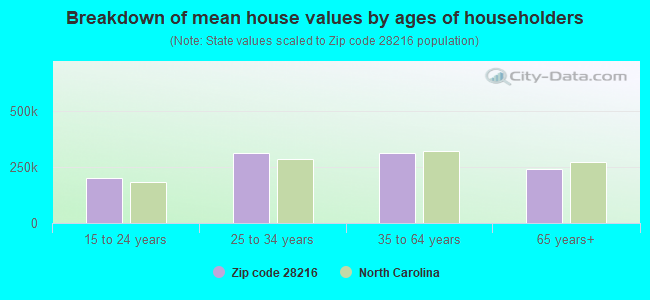
Estimated median house/condo value in 2022: $263,518
28216:
$263,518
North Carolina:
$280,600
According to our research of North Carolina and other state lists, there were 113 registered sex offenders living in 28216 zip code as of April 27, 2024. The ratio of all residents to sex offenders in zip code 28216 is 457 to 1. The ratio of registered sex offenders to all residents in this zip code is near the state average.
Median resident age:
This zip code:
35.9 years
North Carolina median age:
39.2 years
Average household size:
This zip code:
2.2 people
North Carolina:
2.4 people
Averages for the 2020 tax year for zip code 28216, filed in 2021:
Average Adjusted Gross Income (AGI) in 2020: $47,709 (Individual Income Tax Returns)
Here:
$47,709
State:
$70,020
Salary/wage: $44,326 (reported on 87.3% of returns)
Here:
$44,326
State:
$58,387
(% of AGI for various income ranges: 1225.6% for AGIs below $25k, 4150.8% for AGIs $25k-50k, 7921.3% for AGIs $50k-75k, 11273.6% for AGIs $75k-100k, 20206.1% for AGIs $100k-200k, 93382.9% for AGIs over 200k)
Taxable interest for individuals: $868 (reported on 13.3% of returns)
This zip code:
$868
North Carolina:
$1,479
(% of AGI for various income ranges: 2.3% for AGIs below $25k, 4.6% for AGIs $25k-50k, 12.9% for AGIs $50k-75k, 19.5% for AGIs $75k-100k, 59.8% for AGIs $100k-200k, 1095.7% for AGIs over 200k)
Ordinary dividends: $3,339 (reported on 8.5% of returns)
Here:
$3,339
State:
$7,888
(% of AGI for various income ranges: 3.8% for AGIs below $25k, 10.9% for AGIs $25k-50k, 19.4% for AGIs $50k-75k, 54.4% for AGIs $75k-100k, 180.3% for AGIs $100k-200k, 2742.9% for AGIs over 200k)
Net capital gain/loss in AGI: +$15,777 (reported on 7.5% of returns)
Here:
+$15,777
State:
+$23,652
(% of AGI for various income ranges: 1.7% for AGIs below $25k, 7.8% for AGIs $25k-50k, 27.9% for AGIs $50k-75k, 100.9% for AGIs $75k-100k, 454.0% for AGIs $100k-200k, 18903.6% for AGIs over 200k)
Profit/loss from business: +$5,046 (reported on 21.2% of returns)
Here:
+$5,046
State:
+$11,710
(% of AGI for various income ranges: 139.4% for AGIs below $25k, 91.1% for AGIs $25k-50k, 167.3% for AGIs $50k-75k, 271.5% for AGIs $75k-100k, 328.1% for AGIs $100k-200k, 577.9% for AGIs over 200k)
Taxable individual retirement arrangement distribution: $15,561 (reported on 3.7% of returns)
28216:
$15,561
North Carolina:
$20,247
(% of AGI for various income ranges: 19.2% for AGIs below $25k, 36.6% for AGIs $25k-50k, 87.7% for AGIs $50k-75k, 173.8% for AGIs $75k-100k, 455.1% for AGIs $100k-200k, 1876.4% for AGIs over 200k)
Self-employed (Keogh) retirement plans: $23,967 (reported on 0.1% of returns)
28216:
$23,967
North Carolina:
$26,749
(% of AGI for various income ranges: 64.8% for AGIs $100k-200k)
Total itemized deductions: $25,714 (reported on 7.3% of returns)
Here:
$25,714
State:
$34,549
(% of AGI for various income ranges: 24.9% for AGIs below $25k, 114.6% for AGIs $25k-50k, 387.1% for AGIs $50k-75k, 677.1% for AGIs $75k-100k, 1312.4% for AGIs $100k-200k, 7168.6% for AGIs over 200k)
Charity contributions: $9,120 (reported on 6.2% of returns)
Here:
$9,120
State:
$13,360
(% of AGI for various income ranges: 4.2% for AGIs below $25k, 28.4% for AGIs $25k-50k, 106.3% for AGIs $50k-75k, 184.9% for AGIs $75k-100k, 409.5% for AGIs $100k-200k, 2906.4% for AGIs over 200k)
Taxes paid: $6,205 (reported on 7.3% of returns)
28216:
$6,205
State:
$7,586
(% of AGI for various income ranges: 3.0% for AGIs below $25k, 19.2% for AGIs $25k-50k, 88.5% for AGIs $50k-75k, 176.3% for AGIs $75k-100k, 387.8% for AGIs $100k-200k, 1755.0% for AGIs over 200k)
Earned income credit: $2,467 (reported on 25.8% of returns)
Here:
$2,467
State:
$2,337
(% of AGI for various income ranges: 144.5% for AGIs below $25k, 84.8% for AGIs $25k-50k, 1.2% for AGIs $50k-75k)
Percentage of individuals using paid preparers for their 2020 taxes: 92.1%
Here:
92%
State:
93%
(% for various income ranges: 92.3% for AGIs below $25k, 92.0% for AGIs $25k-50k, 91.8% for AGIs $50k-75k, 92.7% for AGIs $75k-100k, 91.7% for AGIs $100k-200k, 93.9% for AGIs over 200k)
Averages for the 2012 tax year for zip code 28216, filed in 2013:
Average Adjusted Gross Income (AGI) in 2012: $40,940 (Individual Income Tax Returns)
Here:
$40,940
State:
$54,937
Salary/wage: $38,200 (reported on 87.8% of returns)
Here:
$38,200
State:
$46,336
(% of AGI for various income ranges: 78.2% for AGIs below $25k, 88.0% for AGIs $25k-50k, 84.0% for AGIs $50k-75k, 82.1% for AGIs $75k-100k, 83.7% for AGIs $100k-200k, 66.7% for AGIs over 200k)
Taxable interest for individuals: $662 (reported on 17.3% of returns)
This zip code:
$662
North Carolina:
$1,298
(% of AGI for various income ranges: 0.3% for AGIs below $25k, 0.2% for AGIs $25k-50k, 0.2% for AGIs $50k-75k, 0.3% for AGIs $75k-100k, 0.3% for AGIs $100k-200k, 0.5% for AGIs over 200k)
Ordinary dividends: $2,402 (reported on 9.4% of returns)
Here:
$2,402
State:
$6,213
(% of AGI for various income ranges: 0.4% for AGIs below $25k, 0.3% for AGIs $25k-50k, 0.3% for AGIs $50k-75k, 0.5% for AGIs $75k-100k, 0.6% for AGIs $100k-200k, 1.6% for AGIs over 200k)
Net capital gain/loss in AGI: +$5,102 (reported on 6.1% of returns)
Here:
+$5,102
State:
+$12,740
(% of AGI for various income ranges: 0.1% for AGIs $50k-75k, 0.3% for AGIs $75k-100k, 0.7% for AGIs $100k-200k, 5.0% for AGIs over 200k)
Profit/loss from business: +$5,675 (reported on 18.1% of returns)
Here:
+$5,675
State:
+$10,311
(% of AGI for various income ranges: 10.1% for AGIs below $25k, 1.2% for AGIs $25k-50k, 1.0% for AGIs $50k-75k, 1.0% for AGIs $75k-100k, 1.7% for AGIs $100k-200k, 0.9% for AGIs over 200k)
Taxable individual retirement arrangement distribution: $12,446 (reported on 5.2% of returns)
28216:
$12,446
North Carolina:
$15,575
(% of AGI for various income ranges: 1.2% for AGIs below $25k, 1.1% for AGIs $25k-50k, 1.8% for AGIs $50k-75k, 2.1% for AGIs $75k-100k, 2.1% for AGIs $100k-200k, 1.6% for AGIs over 200k)
Self-employment retirement plans: $16,050 (reported on 0.2% of returns)
28216:
$16,050
North Carolina:
$21,078
Total itemized deductions: $18,676 (25% of AGI, reported on 32.6% of returns)
Here:
$18,676
State:
$23,438
Here:
24.9% of AGI
State:
21.5% of AGI
(% of AGI for various income ranges: 8.1% for AGIs below $25k, 14.1% for AGIs $25k-50k, 17.8% for AGIs $50k-75k, 17.5% for AGIs $75k-100k, 17.7% for AGIs $100k-200k, 13.7% for AGIs over 200k)
Charity contributions: $3,973 (reported on 28.2% of returns)
Here:
$3,973
State:
$4,687
(% of AGI for various income ranges: 1.2% for AGIs below $25k, 2.6% for AGIs $25k-50k, 3.4% for AGIs $50k-75k, 3.4% for AGIs $75k-100k, 3.3% for AGIs $100k-200k, 2.4% for AGIs over 200k)
Taxes paid: $6,149 (reported on 32.5% of returns)
28216:
$6,149
State:
$8,823
(% of AGI for various income ranges: 1.4% for AGIs below $25k, 3.3% for AGIs $25k-50k, 5.1% for AGIs $50k-75k, 5.9% for AGIs $75k-100k, 7.4% for AGIs $100k-200k, 7.8% for AGIs over 200k)
Earned income credit: $2,627 (reported on 31.3% of returns)
Here:
$2,627
State:
$2,376
(% of AGI for various income ranges: 11.3% for AGIs below $25k, 1.4% for AGIs $25k-50k)
Percentage of individuals using paid preparers for their 2012 taxes: 53.5%
Here:
53%
State:
53%
(% for various income ranges: 54.4% for AGIs below $25k, 52.3% for AGIs $25k-50k, 52.5% for AGIs $50k-75k, 52.6% for AGIs $75k-100k, 53.2% for AGIs $100k-200k, 65.4% for AGIs over 200k)
Averages for the 2004 tax year for zip code 28216, filed in 2005:
Average Adjusted Gross Income (AGI) in 2004: $39,291 (Individual Income Tax Returns)
Here:
$39,291
State:
$45,376
Salary/wage: $37,410 (reported on 89.8% of returns)
Here:
$37,410
State:
$39,442
(% of AGI for various income ranges: 101.5% for AGIs below $10k, 84.7% for AGIs $10k-25k, 89.9% for AGIs $25k-50k, 86.5% for AGIs $50k-75k, 85.9% for AGIs $75k-100k, 79.0% for AGIs over 100k)
Taxable interest for individuals: $782 (reported on 27.2% of returns)
This zip code:
$782
North Carolina:
$1,515
(% of AGI for various income ranges: 1.4% for AGIs below $10k, 0.5% for AGIs $10k-25k, 0.4% for AGIs $25k-50k, 0.6% for AGIs $50k-75k, 0.5% for AGIs $75k-100k, 0.6% for AGIs over 100k)
Taxable dividends: $1,374 (reported on 13.9% of returns)
Here:
$1,374
State:
$4,016
(% of AGI for various income ranges: 1.1% for AGIs below $10k, 0.3% for AGIs $10k-25k, 0.2% for AGIs $25k-50k, 0.4% for AGIs $50k-75k, 0.4% for AGIs $75k-100k, 0.9% for AGIs over 100k)
Net capital gain/loss: +$6,211 (reported on 9.8% of returns)
Here:
+$6,211
State:
+$11,152
(% of AGI for various income ranges: -0.6% for AGIs below $10k, 0.0% for AGIs $10k-25k, 0.3% for AGIs $25k-50k, 0.4% for AGIs $50k-75k, 0.4% for AGIs $75k-100k, 5.3% for AGIs over 100k)
Profit/loss from business: +$4,468 (reported on 13.5% of returns)
Here:
+$4,468
State:
+$9,490
(% of AGI for various income ranges: 4.5% for AGIs below $10k, 3.3% for AGIs $10k-25k, 0.7% for AGIs $25k-50k, 0.8% for AGIs $50k-75k, 1.3% for AGIs $75k-100k, 2.1% for AGIs over 100k)
IRA payment deduction: $2,234 (reported on 1.6% of returns)
28216:
$2,234
North Carolina:
$2,967
(% of AGI for various income ranges: 0.1% for AGIs $10k-25k, 0.1% for AGIs $25k-50k, 0.1% for AGIs $50k-75k, 0.1% for AGIs $75k-100k, 0.1% for AGIs over 100k)
Self-employed pension: $7,216 (reported on 0.2% of returns)
Here:
$7,216
North Carolina:
$14,754
Total itemized deductions: $17,160 (27% of AGI, reported on 44.6% of returns)
Here:
$17,160
State:
$19,464
Here:
27.1% of AGI
State:
22.7% of AGI
(% of AGI for various income ranges: 13.6% for AGIs below $10k, 12.6% for AGIs $10k-25k, 21.4% for AGIs $25k-50k, 22.6% for AGIs $50k-75k, 22.0% for AGIs $75k-100k, 17.5% for AGIs over 100k)
Charity contributions deductions: $3,492 (5% of AGI, reported on 40.4% of returns)
Here:
$3,492
State:
$4,035
Here:
5.3% of AGI
State:
4.5% of AGI
(% of AGI for various income ranges: 1.4% for AGIs below $10k, 2.2% for AGIs $10k-25k, 4.0% for AGIs $25k-50k, 4.3% for AGIs $50k-75k, 4.4% for AGIs $75k-100k, 3.0% for AGIs over 100k)
Total tax: $5,370 (reported on 67.7% of returns)
28216:
$5,370
State:
$7,257
(% of AGI for various income ranges: 2.5% for AGIs below $10k, 3.0% for AGIs $10k-25k, 5.6% for AGIs $25k-50k, 8.2% for AGIs $50k-75k, 9.6% for AGIs $75k-100k, 17.2% for AGIs over 100k)
Earned income credit: $1,934 (reported on 26.8% of returns)
Here:
$1,934
State:
$1,851
Percentage of individuals using paid preparers for their 2004 taxes: 65.0%
Here:
65%
State:
62%
(% for various income ranges: 63.2% for AGIs below $10k, 73.2% for AGIs $10k-25k, 63.0% for AGIs $25k-50k, 60.7% for AGIs $50k-75k, 56.8% for AGIs $75k-100k, 58.5% for AGIs over 100k)
Likely homosexual households (counted as self-reported same-sex unmarried-partner households)
Lesbian couples: 0.2% of all households
Gay men: 0.2% of all households
Household received Food Stamps/SNAP in the past 12 months: 3,508 Household did not receive Food Stamps/SNAP in the past 12 months: 20,569
Women who had a birth in the past 12 months: 777 (473 now married, 299 unmarried) Women who did not have a birth in the past 12 months: 15,150 (5,790 now married, 9,344 unmarried)
Housing units in zip code 28216 with a mortgage: 8,787 (616 second mortgage, 25 home equity loan, 443 both second mortgage and home equity loan) Houses without a mortgage: 263
Median monthly owner costs for units with a mortgage: $1,264 Median monthly owner costs for units without a mortgage: $443
Residents with income below the poverty level in 2022:
This zip code:
11.3%
Whole state:
12.8%
Residents with income below 50% of the poverty level in 2022:
This zip code:
5.9%
Whole state:
6.8%
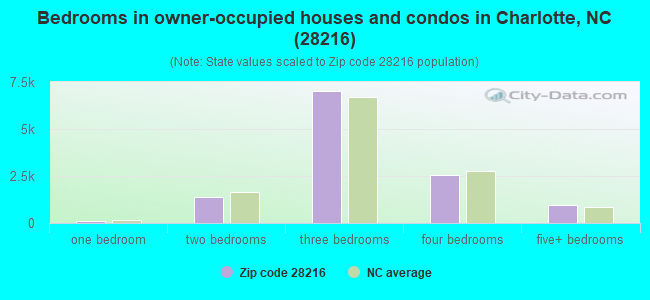
Median number of rooms in houses and condos:
Here:
6.0
State:
6.4
Median number of rooms in apartments:
Here:
4.4
State:
4.4
Notable locations in this zip code not listed on our city pages
Notable locations in zip code 28216: Sunset Hills Golf Club (A), North Park (B), Charlotte Fire Department Station 25 (C), Charlotte Fire Department Station 18 (D), Charlotte Water Works - Vest Station (E), Public Library of Charlotte and Mecklenburg County - Coulwood Branch (F), Public Library of Charlotte and Mecklenburg County - Beatties Ford Road Branch (G), Charlotte Water Works (H). Display/hide their locations on the map
Churches in zip code 28216 include: Trinity Church (A), Long Creek Church (B), Bethany Church (C), Macedonia Church (D), Williams Memorial Church (E), Wilson Church (F), Wilson Heights Church (G), New Bethlehem Church (H), New East Stonewall Church (I). Display/hide their locations on the map
Cemeteries: George Elliott Family Slave Cemetery (1), North Pinewood Cemetery (2), Oaklawn Cemetery (3), Pleasant Grove Cemetery (4). Display/hide their locations on the map
6,033 married couples with children.
4,215 single-parent households (804 men, 3,411 women).
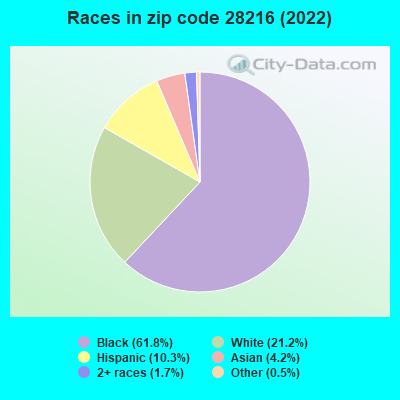
82.2% of residents of 28216 zip code speak English at home.
10.3% of residents speak Spanish at home (43% very well, 33% well, 15% not well, 9% not at all).
3.4% of residents speak other Indo-European language at home (76% very well, 17% well, 2% not well, 4% not at all).
2.6% of residents speak Asian or Pacific Island language at home (55% very well, 25% well, 16% not well, 4% not at all).
1.5% of residents speak other language at home (68% very well, 19% well, 13% not well).
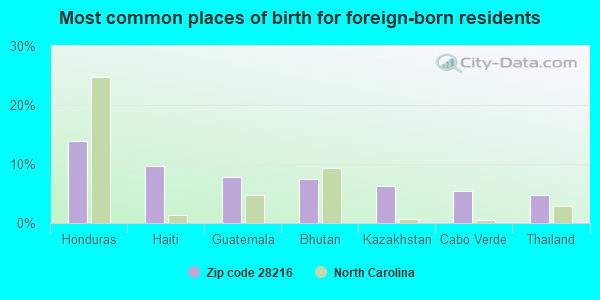
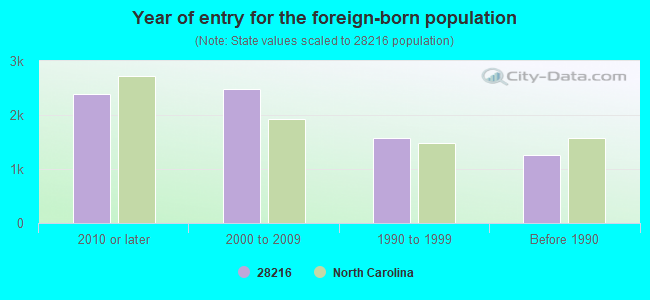
Foreign born population: 6,917 (12.7%) (40.1% of them are naturalized citizens)
Major facilities with environmental interests located in this zip code:
BASF CORPORATION (4330 CHESAPEAKE DRIVE in CHARLOTTE, NC)
AIR SYNTHETIC MINOR (AIRS/AFS) STATE MASTER (North Carolina facility info) - -115DA4YG00M29W84AY3X0E6UR5, WASTEWATER FACILITY, -0-014811, UNDERGROUND STORAGE TANK PROGRAM CRITERIA AND HAZARDOUS AIR POLLUTANT INVENTORY (Inventory of air pollution sources) HAZARDOUS WASTE BIENNIAL REPORTER (Resource Conservation and Recovery Act (tracking hazardous waste)) Large Quantity Generators, more that 1000 kg of hazardous waste/month (Resource Conservation and Recovery Act (tracking hazardous waste)) - notification TRI REPORTER (Tracking of toxic chemicals releasing facilities) Business SIC classification: INDUSTRIAL ORGANIC CHEMICALS; NONCLASSIFIABLE ESTABLISHMENTS Organizations: FRANSIS CHADIKUN (CONTACT/OPERATOR)
BROOKSHIRE AMOCO (3521 BROOKSHIRE BLVD in CHARLOTTE, NC)
STATE MASTER (North Carolina facility info) - UNDERGROUND STORAGE TANK PROGRAM (Resource Conservation and Recovery Act (tracking hazardous waste)) Business SIC classification: NONCLASSIFIABLE ESTABLISHMENTS Organizations: MARK OIL CO (CONTACT/OWNER)
AMERISTEEL CORPORATION (301 BLACK SATCHEL DRIVE in CHARLOTTE, NC)
STATE MASTER (North Carolina facility info) - -115DA4YG00M29W84AX3YRAD7EP, WASTEWATER FACILITY National Pollutant Discharge Elimination System NON-MAJOR (Tracking pollutant discharge elimination systems) - permit Business SIC classification: MISCELLANEOUS STRUCTURAL METALWORK Alternative names: AMERISTEEL CORP-CHARLOTTE
APPERSON BUSINESS FORMS (901 I-85 N in CHARLOTTE, NC)
AIR MINOR (AIRS/AFS) CRITERIA AND HAZARDOUS AIR POLLUTANT INVENTORY (Inventory of air pollution sources) (Resource Conservation and Recovery Act (tracking hazardous waste)) Business SIC classification: COMMERCIAL PRINTING, LITHOGRAPHIC; MANIFOLD BUSINESS FORMS Business NAICS classification: MUSHROOM PRODUCTION.; MANIFOLD BUSINESS FORMS PRINTING. Organizations: APPERSON PRINT MGT SVR INC (CONTACT/OWNER)
Alternative names: APPERSON PRINT MANAGEMENT SVR
BOSTON GEAR (701 NORTH I-85 in CHARLOTTE, NC)
AIR MINOR (AIRS/AFS) HAZARDOUS WASTE BIENNIAL REPORTER (Resource Conservation and Recovery Act (tracking hazardous waste)) Small Quantity Generators, between 100 kg and 1000 kg of hazardous waste/month (Resource Conservation and Recovery Act (tracking hazardous waste)) TRI REPORTER (Tracking of toxic chemicals releasing facilities) Business SIC classification: MOTOR VEHICLE PARTS AND ACCESSORIES; AUTOMOBILES AND OTHER MOTOR VEHICLES Business NAICS classification: MECHANICAL POWER TRANSMISSION EQUIPMENT MANUFACTURING. Organizations: BENDIX COMMERCIAL VEHICLE SYS LLC (CONTACT/OWNER)
, OLDS PROPERTIES CORP (CONTACT/OWNER)
Alternative names: ALLIED-SIGNAL, TBS, BENDIX COMMERCIAL VEHICLE SYSTEMS LLC, BENDIX HEAVY VEHICLE
BIGGERS BROTHERS INC (920 BLACK SATCHEL DR in CHARLOTTE, NC)
STATE MASTER (North Carolina facility info) - UNDERGROUND STORAGE TANK PROGRAM Conditionally Exempt Small Quantity Generators, less than 100 kg/month of hazardous waste (Resource Conservation and Recovery Act (tracking hazardous waste)) - notification Business SIC classification: NONCLASSIFIABLE ESTABLISHMENTS Organizations: IU INTERNATIONAL (CONTACT/OWNER)
CHEMICAL TEX LABORATORIES INCORPORATED (1016 N. I-85 SERVICE RD. in CHARLOTTE, NC)
STATE MASTER (North Carolina facility info) - -115DA4YG00PJAD84AY3VGA07AG, WASTEWATER FACILITY TRI REPORTER (Tracking of toxic chemicals releasing facilities) Business SIC classification: SURFACE ACTIVE AGENTS, FINISHING AGENTS, SULFONATED OILS, AND ASSISTANTS
ATLANTIC DESIGN (5601 WILKINSON BLVD in CHARLOTTE, NC)
AIR MINOR (AIRS/AFS) Conditionally Exempt Small Quantity Generators, less than 100 kg/month of hazardous waste (Resource Conservation and Recovery Act (tracking hazardous waste)) - notification TRI REPORTER (Tracking of toxic chemicals releasing facilities) Business SIC classification: PRINTED CIRCUIT BOARDS; ELECTRONIC COMPONENTS Organizations: THE SMT CENTRE (CONTACT/OWNER)
Alternative names: THE SMT CENTRE INC
ABC INDUSTRIESINC (DBA ABC ENGRAVERS) (724 N. I-85 in CHARLOTTE, NC)
HAZARDOUS WASTE BIENNIAL REPORTER (Resource Conservation and Recovery Act (tracking hazardous waste)) (Resource Conservation and Recovery Act (tracking hazardous waste)) TRI REPORTER (Tracking of toxic chemicals releasing facilities) Business SIC classification: ELECTROPLATING, PLATING, POLISHING, ANODIZING, AND COLORING Organizations: HENRY SCALA (CONTACT/OWNER)
Alternative names: ABC INDS. INC. DBA ABC ENGRAVERS
BURRIS CHEMICAL, INC. (4709 ROZZELLS FERRY RD in CHARLOTTE, NC)
AIR SYNTHETIC MINOR (AIRS/AFS) COMPLIANCE ACTIVITY (Tracking inspections of insecticide, fungicide, and rodenticide, and toxic substances) (Resource Conservation and Recovery Act (tracking hazardous waste)) Business SIC classification: INDUSTRIAL INORGANIC CHEMICALS Organizations: A.A. BURRIS JR. (CONTACT/OWNER)
CMUD-FRANKLIN WATER TREATMENT PLANT (5200 BROOKSHIRE BOULEVARD in CHARLOTTE, NC)
AIR SYNTHETIC MINOR (AIRS/AFS) CRITERIA AND HAZARDOUS AIR POLLUTANT INVENTORY (Inventory of air pollution sources) National Pollutant Discharge Elimination System NON-MAJOR (Tracking pollutant discharge elimination systems) - permit Business SIC and NAICS classification: WATER SUPPLY Alternative names: CMUD - FRANKLIN WTP
AMERICAN BARMAG (5800 BELLHAVEN BLVD in CHARLOTTE, NC)
(Resource Conservation and Recovery Act (tracking hazardous waste))
ATOFINA AT CAROLINA TRANSFER (900 N HOSKINS RD in CHARLOTTE, NC)
(Resource Conservation and Recovery Act (tracking hazardous waste)) Organizations: PEOPLES SERVICE INC (CONTACT/OWNER)
Housing units lacking complete plumbing facilities: 0.5% Housing units lacking complete kitchen facilities: 0.4%
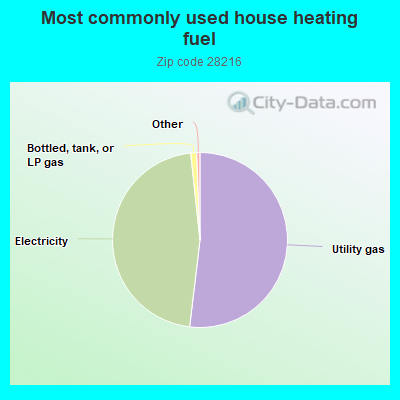
51.9%Utility gas
46.4%Electricity
1.1%Bottled, tank, or LP gas
Population in 1990: 22,464. Population change in the 1990s: +7,299 (+32.5%).
Place of birth for U.S.-born residents:
This state: 28,283
Northeast: 6,421
Midwest: 1,812
South: 8,968
West: 1,380
54% of the 28216 zip code residents lived in the same house 5 years ago. Out of people who lived in different houses, 64% lived in this county. Out of people who lived in different counties, 50% lived in North Carolina.
91% of the 28216 zip code residents lived in the same house 1 year ago. Out of people who lived in different houses, 56% moved from this county. Out of people who lived in different houses, 17% moved from different county within same state. Out of people who lived in different houses, 21% moved from different state. Out of people who lived in different houses, 6% moved from abroad.
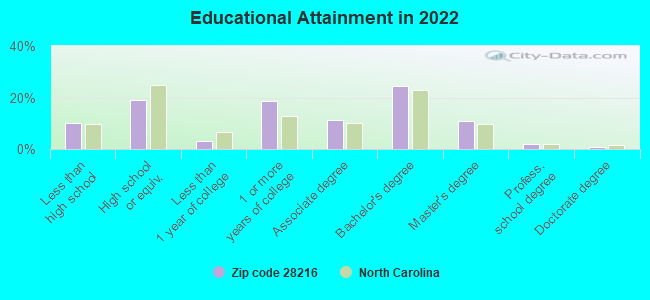
Private vs. public school enrollment:
Students in private schools in grades 1 to 8 (elementary and middle school): 89
Here:
1.8%
North Carolina:
13.8%
Students in private schools in grades 9 to 12 (high school): 146
Here:
4.9%
North Carolina:
11.9%
Students in private undergraduate colleges: 753
Here:
26.3%
North Carolina:
19.3%
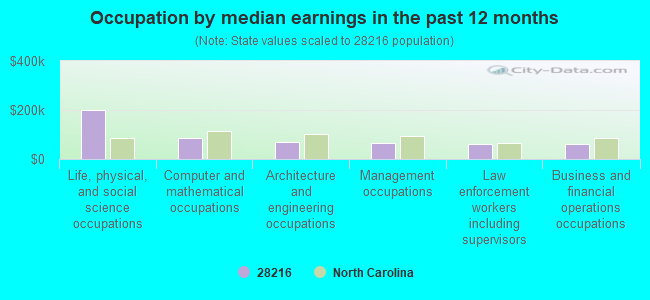
Occupation by median earnings in the past 12 months ($)
201,224Life, physical, and social science occupations
85,352Computer and mathematical occupations
70,075Architecture and engineering occupations
66,573Management occupations
61,789Law enforcement workers including supervisors
61,163Business and financial operations occupations
Companies with biggest federal contracts located in this zip code (CHARLOTTE, NC):
JENKINS ELECTRIC COMPANY (5933 BROOKSHIRE BLVD; small business) : $597,730 in 2 contractsfrom 2004 to 2005
$592,080 with Navy for Aircraft Maintenance and Repair Shop Specialized Equipment. Signed on 2005-09-22. Completion date: 2006-04-30.
$5,650 with Navy for Miscellaneous Items. Signed on 2004-09-10. Completion date: 2004-10-15.
INTERNATIONAL SURFACE PREPARAT (4804 ROZZELLES FERRY ROAD) : $195,525 in 8 contractsfrom 2001 to 2005
Contracts for Maintenance, Repair and Rebuilding of Equipment -- Maintenance and Repair Shop Equipment, Abrasive Materials, Bars and Rods by United States Coast Guard (disused code: now 7008), Army Signed by year:2000: $0; 2001: $154,000; 2002: $2,000; 2003: $0; 2004: $26,280; 2005: $13,245; 2006: $0.
Biggest contracts:
$146,000 with United States Coast Guard (disused code: now 7008) for Maintenance, Repair and Rebuilding of Equipment -- Maintenance and Repair Shop Equipment. Taking place in MA. Signed on 2001-07-15. Completion date: 2001-12-15.
$9,925 with Army for Abrasive Materials. Taking place in MS. Signed on 2004-07-26. Completion date: 2004-08-03.
$8,884 with Army for Abrasive Materials. Taking place in TX. Signed on 2005-09-29. Completion date: 2005-10-29.
$8,441 with Army for Bars and Rods. Taking place in TX. Signed on 2004-05-11. Completion date: 2004-04-16.
PNEUMAFIL CORPORATION (4500 CHESAPEAKE DR; small business) : $182,892 in 5 contractsfrom 2003 to 2006
Contracts for Aircraft Maintenance and Repair Shop Specialized Equipment, Ores, Miscellaneous Communication Equipment, Miscellaneous Fire Control Equipment by Navy Signed by year:2000: $0; 2001: $0; 2002: $0; 2003: $99,210; 2004: $54,564; 2005: $11,240; 2006: $17,878.
Biggest contracts:
$99,210 with Navy for Aircraft Maintenance and Repair Shop Specialized Equipment. Taking place in CT. Signed on 2003-12-16. Completion date: 2004-04-20.
$54,564 with Navy for Ores. Signed on 2004-09-08. Completion date: 2005-01-24.
$11,240 with Navy for Miscellaneous Communication Equipment. Taking place in CT. Signed on 2005-03-08. Completion date: 2005-06-06.
$8,939 with Navy for Miscellaneous Fire Control Equipment. Taking place in CT. Signed on 2006-03-02. Completion date: 2006-06-06.
EZ BOX MACHINERY CO , INC (6126 BROOKSHIRE BLVD #E; small business) : $145,450 in 4 contractsfrom 2001 to 2003
$39,550 with Air Force for Miscellaneous Materials Handling Equipment. Signed on 2003-09-29. Completion date: 2004-01-30.
$37,420 with Army for Pulp and Paper Industries Machinery. Signed on 2001-03-23. Completion date: 2001-05-23.
$34,710 with Navy for Planers and Shapers. Signed on 2001-09-19. Completion date: 2001-11-14.
$33,770 with Navy for Wrapping and Packaging Machinery. Signed on 2001-06-18. Completion date: 2001-08-20.
LOOPER OIL CO INC (7117 MT HLLY HNTERSVIL RD; small business) : $108,270 in 4 contractsfrom 2000 to 2005
$64,192 with Defense Logistics Agency for Fuel Oils. Signed on 2000-08-04. Completion date: 2003-03-31.
$40,120, same as above.Signed on 2000-05-10. Completion date: 2003-03-31.
$3,958, same as above.Signed on 2005-02-28. Completion date: 2005-03-01.
$0, same as above.Signed on 2000-08-04. Completion date: 2003-03-31.
VENTURA FOODS, LLC (9009-H PERIMETER WOODS DRI) : $87,289 in 3 contractsfrom 2002 to 2004
$32,767 with Defense Logistics Agency for Fruits and Vegetables. Signed on 2002-05-16. Completion date: 2002-05-16.
$27,522 with Defense Logistics Agency for Food, Oils and Fats. Signed on 2004-03-22. Completion date: 2004-07-27.
$27,000, same as above.Signed on 2002-07-16. Completion date: 2002-10-04.
CROWDER CONSTRUCTION COMPANY (6425 BROOKSHIRE BLVD; small business) : $73,279 in 2 contractsin 2004
$49,850 with Army for Maintenance, Repair and Rebuilding of Equipment -- Weapons. Taking place in VA. Signed on 2004-04-23. Completion date: 2004-05-21.
$23,429 with Army for Maintenance, Repair or Alteration of Real Property -- Other Non-Building Facilities. Taking place in VA. Signed on 2004-02-20. Completion date: 2004-03-09.
LCI CORPORATION (4433 CHESAPEAKE DRIVE; small business)
$39,700 with Army for Laboratory Equipment and Supplies. Signed on 2003-09-15. Completion date: 2003-10-17.
JOHNSON C SMITH UNIVERSITY INC (100 BEATTIES FORD RD) : $31,419 in 2 contractsfrom 2003 to 2004
$24,888 with Army for Educational Services. Signed on 2003-05-30. Completion date: 2003-05-30.
$6,531, same as above.Signed on 2004-04-06. Completion date: 2004-04-06.
S V E SALES, INC (6128-F BROOKSHIRE BLVD; small business) : $22,617 in 3 contractsfrom 2004 to 2006
$8,609 with Army for Lumber and Related Basic Wood Materials. Taking place in VA. Signed on 2006-04-11. Completion date: 2006-05-26.
$7,960 with Army for Motor Passenger Services. Taking place in VA. Signed on 2004-02-11. Completion date: 2004-01-31.
$6,048 with Army for Plastics Fabricated Materials. Taking place in VA. Signed on 2004-09-27. Completion date: 2004-11-30.
Top industries in this zip code by the number of employees in 2005:
Educational Services: Colleges, Universities, and Professional Schools (500-999 employees: 1 establishment)
Management of Companies and Enterprises: Corporate, Subsidiary, and Regional Managing Offices (250-499: 1, 50-99: 1, 20-49: 4, 5-9: 1, 1-4: 2)
2005 - 2018 National Fire Incident Reporting System (NFIRS) incidents
Based on the data from the years 2005 - 2018 the average number of fires per year is 180. The highest number of reported fires - 220 took place in 2006, and the least - 142 in 2009. The data has a dropping trend.
When looking into fire subcategories, the most reports belonged to: Outside Fires (39.2%), and Structure Fires (34.1%).
Fire incident types reported to NFIRS in Zip Code 28216


 Nearest zip codes: 28208, 28214, 28206, 28269, 28202, 28078.
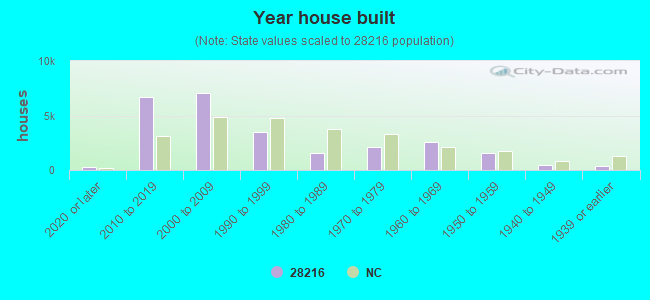


 Based on the data from the years 2005 - 2018 the average number of fires per year is 180. The highest number of reported fires - 220 took place in 2006, and the least - 142 in 2009. The data has a dropping trend.
 When looking into fire subcategories, the most reports belonged to: Outside Fires (39.2%), and Structure Fires (34.1%).