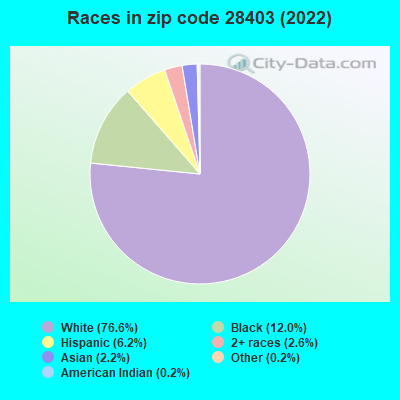
Estimated zip code population in 2022: 40,493 Zip code population in 2010: 36,063 Zip code population in 2000: 30,334
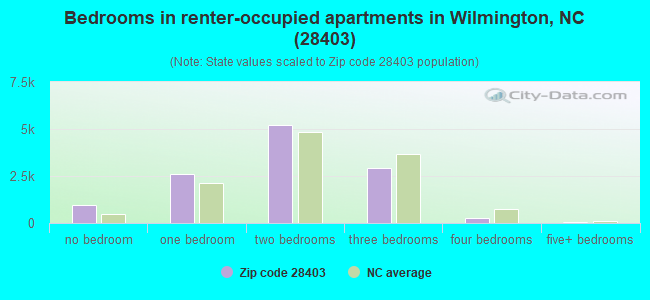
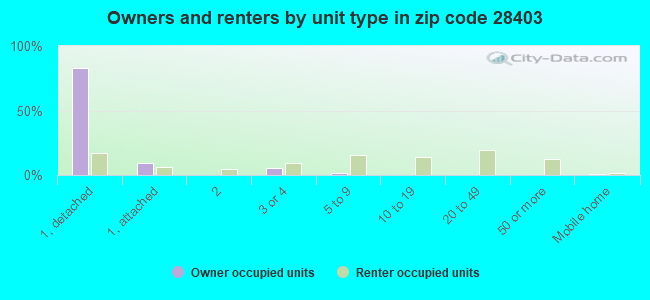
Houses and condos: 20,649 Renter-occupied apartments: 11,976
% of renters here:
64%
State:
33%
March 2022 cost of living index in zip code 28403: 95.9 (near average, U.S. average is 100)
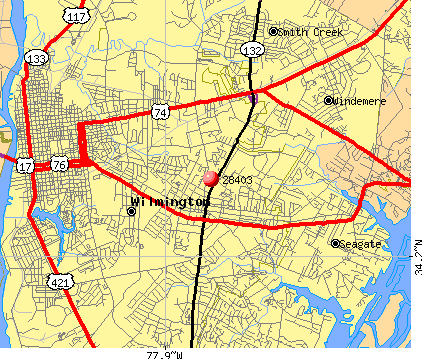
Land area: 14.1 sq. mi. Water area: 0.3 sq. mi.
Population density: 2,877 people per square mile
(average).
OSM Map
General Map
Google Map
MSN Map
OSM Map
General Map
Google Map
MSN Map
OSM Map
General Map
Google Map
MSN Map
OSM Map
General Map
Google Map
MSN Map
Please wait while loading the map...
Real estate property taxes paid for housing units in 2022:
This zip code:
0.6% ($2,295)
North Carolina:
0.6% ($1,769)
Median real estate property taxes paid for housing units with mortgages in 2022: $2,300 (0.6%) Median real estate property taxes paid for housing units with no mortgage in 2022: $2,208 (0.7%)
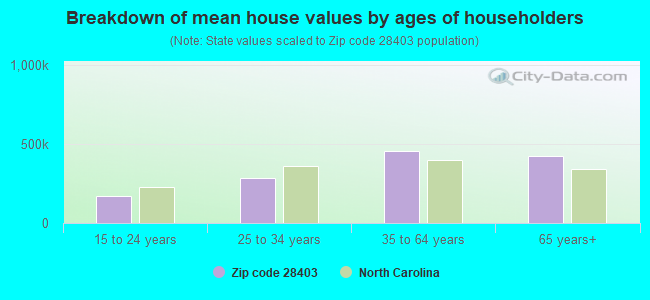
Estimated median house/condo value in 2022: $354,901
28403:
$354,901
North Carolina:
$280,600
According to our research of North Carolina and other state lists, there were 32 registered sex offenders living in 28403 zip code as of April 27, 2024. The ratio of all residents to sex offenders in zip code 28403 is 1,283 to 1. The ratio of registered sex offenders to all residents in this zip code is much lower than the state average.
Median resident age:
This zip code:
30.4 years
North Carolina median age:
39.2 years
Average household size:
This zip code:
1.9 people
North Carolina:
2.4 people
Averages for the 2020 tax year for zip code 28403, filed in 2021:
Average Adjusted Gross Income (AGI) in 2020: $80,512 (Individual Income Tax Returns)
Here:
$80,512
State:
$70,020
Salary/wage: $55,348 (reported on 81.0% of returns)
Here:
$55,348
State:
$58,387
(% of AGI for various income ranges: 1244.7% for AGIs below $25k, 3773.9% for AGIs $25k-50k, 7059.0% for AGIs $50k-75k, 10245.1% for AGIs $75k-100k, 21145.7% for AGIs $100k-200k, 131659.1% for AGIs over 200k)
Taxable interest for individuals: $2,054 (reported on 28.5% of returns)
This zip code:
$2,054
North Carolina:
$1,479
(% of AGI for various income ranges: 8.6% for AGIs below $25k, 17.7% for AGIs $25k-50k, 50.7% for AGIs $50k-75k, 134.7% for AGIs $75k-100k, 390.5% for AGIs $100k-200k, 2255.0% for AGIs over 200k)
Ordinary dividends: $14,350 (reported on 21.9% of returns)
Here:
$14,350
State:
$7,888
(% of AGI for various income ranges: 34.1% for AGIs below $25k, 59.4% for AGIs $25k-50k, 255.8% for AGIs $50k-75k, 531.5% for AGIs $75k-100k, 1764.0% for AGIs $100k-200k, 14406.8% for AGIs over 200k)
Net capital gain/loss in AGI: +$45,196 (reported on 21.3% of returns)
Here:
+$45,196
State:
+$23,652
(% of AGI for various income ranges: 20.5% for AGIs below $25k, 37.8% for AGIs $25k-50k, 168.1% for AGIs $50k-75k, 427.8% for AGIs $75k-100k, 2041.0% for AGIs $100k-200k, 63561.8% for AGIs over 200k)
Profit/loss from business: +$16,304 (reported on 17.7% of returns)
Here:
+$16,304
State:
+$11,710
(% of AGI for various income ranges: 165.3% for AGIs below $25k, 197.6% for AGIs $25k-50k, 393.4% for AGIs $50k-75k, 561.3% for AGIs $75k-100k, 1348.7% for AGIs $100k-200k, 7815.9% for AGIs over 200k)
Taxable individual retirement arrangement distribution: $24,603 (reported on 8.0% of returns)
28403:
$24,603
North Carolina:
$20,247
(% of AGI for various income ranges: 33.7% for AGIs below $25k, 72.8% for AGIs $25k-50k, 229.7% for AGIs $50k-75k, 594.2% for AGIs $75k-100k, 1850.2% for AGIs $100k-200k, 5077.7% for AGIs over 200k)
Self-employed (Keogh) retirement plans: $23,450 (reported on 0.7% of returns)
28403:
$23,450
North Carolina:
$26,749
(% of AGI for various income ranges: 2.8% for AGIs below $25k, 95.3% for AGIs $100k-200k, 956.8% for AGIs over 200k)
Total itemized deductions: $36,975 (reported on 9.2% of returns)
Here:
$36,975
State:
$34,549
(% of AGI for various income ranges: 37.5% for AGIs below $25k, 85.9% for AGIs $25k-50k, 421.6% for AGIs $50k-75k, 718.7% for AGIs $75k-100k, 1997.5% for AGIs $100k-200k, 13781.4% for AGIs over 200k)
Charity contributions: $14,640 (reported on 7.6% of returns)
Here:
$14,640
State:
$13,360
(% of AGI for various income ranges: 2.7% for AGIs below $25k, 10.1% for AGIs $25k-50k, 66.0% for AGIs $50k-75k, 127.8% for AGIs $75k-100k, 420.7% for AGIs $100k-200k, 6290.9% for AGIs over 200k)
Taxes paid: $7,915 (reported on 9.1% of returns)
28403:
$7,915
State:
$7,586
(% of AGI for various income ranges: 5.0% for AGIs below $25k, 14.0% for AGIs $25k-50k, 69.7% for AGIs $50k-75k, 175.3% for AGIs $75k-100k, 566.2% for AGIs $100k-200k, 2689.5% for AGIs over 200k)
Earned income credit: $1,846 (reported on 15.1% of returns)
Here:
$1,846
State:
$2,337
(% of AGI for various income ranges: 65.6% for AGIs below $25k, 42.5% for AGIs $25k-50k)
Percentage of individuals using paid preparers for their 2020 taxes: 93.1%
Here:
93%
State:
93%
(% for various income ranges: 92.2% for AGIs below $25k, 94.2% for AGIs $25k-50k, 93.1% for AGIs $50k-75k, 93.1% for AGIs $75k-100k, 92.4% for AGIs $100k-200k, 95.1% for AGIs over 200k)
Averages for the 2012 tax year for zip code 28403, filed in 2013:
Average Adjusted Gross Income (AGI) in 2012: $57,235 (Individual Income Tax Returns)
Here:
$57,235
State:
$54,937
Salary/wage: $39,184 (reported on 82.8% of returns)
Here:
$39,184
State:
$46,336
(% of AGI for various income ranges: 80.6% for AGIs below $25k, 80.3% for AGIs $25k-50k, 72.3% for AGIs $50k-75k, 64.1% for AGIs $75k-100k, 60.6% for AGIs $100k-200k, 34.2% for AGIs over 200k)
Taxable interest for individuals: $2,022 (reported on 30.2% of returns)
This zip code:
$2,022
North Carolina:
$1,298
(% of AGI for various income ranges: 0.8% for AGIs below $25k, 0.6% for AGIs $25k-50k, 0.9% for AGIs $50k-75k, 1.1% for AGIs $75k-100k, 1.2% for AGIs $100k-200k, 1.3% for AGIs over 200k)
Ordinary dividends: $10,597 (reported on 20.6% of returns)
Here:
$10,597
State:
$6,213
(% of AGI for various income ranges: 2.0% for AGIs below $25k, 1.7% for AGIs $25k-50k, 2.8% for AGIs $50k-75k, 3.5% for AGIs $75k-100k, 4.1% for AGIs $100k-200k, 5.3% for AGIs over 200k)
Net capital gain/loss in AGI: +$32,536 (reported on 17.7% of returns)
Here:
+$32,536
State:
+$12,740
(% of AGI for various income ranges: 0.7% for AGIs $25k-50k, 0.9% for AGIs $50k-75k, 1.9% for AGIs $75k-100k, 3.4% for AGIs $100k-200k, 23.2% for AGIs over 200k)
Profit/loss from business: +$11,731 (reported on 15.8% of returns)
Here:
+$11,731
State:
+$10,311
(% of AGI for various income ranges: 7.5% for AGIs below $25k, 3.2% for AGIs $25k-50k, 3.4% for AGIs $50k-75k, 3.1% for AGIs $75k-100k, 3.9% for AGIs $100k-200k, 1.8% for AGIs over 200k)
Taxable individual retirement arrangement distribution: $18,874 (reported on 8.6% of returns)
28403:
$18,874
North Carolina:
$15,575
(% of AGI for various income ranges: 1.7% for AGIs below $25k, 2.1% for AGIs $25k-50k, 2.8% for AGIs $50k-75k, 4.3% for AGIs $75k-100k, 4.7% for AGIs $100k-200k, 2.3% for AGIs over 200k)
Self-employment retirement plans: $18,400 (reported on 0.9% of returns)
28403:
$18,400
North Carolina:
$21,078
(% of AGI for various income ranges: 0.1% for AGIs $25k-50k, 0.4% for AGIs $100k-200k, 0.5% for AGIs over 200k)
Total itemized deductions: $27,472 (19% of AGI, reported on 27.9% of returns)
Here:
$27,472
State:
$23,438
Here:
19.1% of AGI
State:
21.5% of AGI
(% of AGI for various income ranges: 8.7% for AGIs below $25k, 10.2% for AGIs $25k-50k, 14.6% for AGIs $50k-75k, 17.2% for AGIs $75k-100k, 18.3% for AGIs $100k-200k, 12.6% for AGIs over 200k)
Charity contributions: $4,934 (reported on 22.9% of returns)
Here:
$4,934
State:
$4,687
(% of AGI for various income ranges: 0.7% for AGIs below $25k, 1.2% for AGIs $25k-50k, 1.8% for AGIs $50k-75k, 2.2% for AGIs $75k-100k, 2.6% for AGIs $100k-200k, 2.4% for AGIs over 200k)
Taxes paid: $11,001 (reported on 27.7% of returns)
28403:
$11,001
State:
$8,823
(% of AGI for various income ranges: 1.4% for AGIs below $25k, 2.4% for AGIs $25k-50k, 4.3% for AGIs $50k-75k, 5.9% for AGIs $75k-100k, 7.6% for AGIs $100k-200k, 6.6% for AGIs over 200k)
Earned income credit: $1,809 (reported on 18.2% of returns)
Here:
$1,809
State:
$2,376
(% of AGI for various income ranges: 4.5% for AGIs below $25k, 0.6% for AGIs $25k-50k)
Percentage of individuals using paid preparers for their 2012 taxes: 46.5%
Here:
46%
State:
53%
(% for various income ranges: 40.3% for AGIs below $25k, 41.2% for AGIs $25k-50k, 54.3% for AGIs $50k-75k, 58.2% for AGIs $75k-100k, 68.8% for AGIs $100k-200k, 84.2% for AGIs over 200k)
Averages for the 2004 tax year for zip code 28403, filed in 2005:
Average Adjusted Gross Income (AGI) in 2004: $46,236 (Individual Income Tax Returns)
Here:
$46,236
State:
$45,376
Salary/wage: $33,056 (reported on 81.7% of returns)
Here:
$33,056
State:
$39,442
(% of AGI for various income ranges: 228.1% for AGIs below $10k, 82.4% for AGIs $10k-25k, 79.6% for AGIs $25k-50k, 69.2% for AGIs $50k-75k, 62.8% for AGIs $75k-100k, 39.6% for AGIs over 100k)
Taxable interest for individuals: $2,394 (reported on 37.6% of returns)
This zip code:
$2,394
North Carolina:
$1,515
(% of AGI for various income ranges: 8.6% for AGIs below $10k, 1.5% for AGIs $10k-25k, 1.4% for AGIs $25k-50k, 1.7% for AGIs $50k-75k, 2.0% for AGIs $75k-100k, 2.1% for AGIs over 100k)
Taxable dividends: $7,495 (reported on 26.0% of returns)
Here:
$7,495
State:
$4,016
(% of AGI for various income ranges: 12.8% for AGIs below $10k, 2.0% for AGIs $10k-25k, 2.0% for AGIs $25k-50k, 3.0% for AGIs $50k-75k, 4.2% for AGIs $75k-100k, 5.5% for AGIs over 100k)
Net capital gain/loss: +$22,880 (reported on 22.4% of returns)
Here:
+$22,880
State:
+$11,152
(% of AGI for various income ranges: 3.0% for AGIs below $10k, 0.6% for AGIs $10k-25k, 0.8% for AGIs $25k-50k, 3.0% for AGIs $50k-75k, 3.3% for AGIs $75k-100k, 19.9% for AGIs over 100k)
Profit/loss from business: +$13,319 (reported on 15.1% of returns)
Here:
+$13,319
State:
+$9,490
(% of AGI for various income ranges: -4.9% for AGIs below $10k, 3.9% for AGIs $10k-25k, 3.7% for AGIs $25k-50k, 3.9% for AGIs $50k-75k, 4.3% for AGIs $75k-100k, 5.0% for AGIs over 100k)
IRA payment deduction: $3,031 (reported on 2.3% of returns)
28403:
$3,031
North Carolina:
$2,967
(% of AGI for various income ranges: 0.4% for AGIs below $10k, 0.1% for AGIs $10k-25k, 0.2% for AGIs $25k-50k, 0.2% for AGIs $50k-75k, 0.2% for AGIs $75k-100k, 0.1% for AGIs over 100k)
Self-employed pension: $14,841 (reported on 1.2% of returns)
Here:
$14,841
North Carolina:
$14,754
(% of AGI for various income ranges: 0.6% for AGIs below $10k, 0.1% for AGIs $25k-50k, 0.1% for AGIs $50k-75k, 0.1% for AGIs $75k-100k, 0.7% for AGIs over 100k)
Total itemized deductions: $23,671 (22% of AGI, reported on 30.4% of returns)
Here:
$23,671
State:
$19,464
Here:
21.6% of AGI
State:
22.7% of AGI
(% of AGI for various income ranges: 22.6% for AGIs below $10k, 8.0% for AGIs $10k-25k, 13.3% for AGIs $25k-50k, 17.7% for AGIs $50k-75k, 18.7% for AGIs $75k-100k, 16.7% for AGIs over 100k)
Charity contributions deductions: $6,050 (5% of AGI, reported on 26.6% of returns)
Here:
$6,050
State:
$4,035
Here:
5.1% of AGI
State:
4.5% of AGI
(% of AGI for various income ranges: 1.4% for AGIs below $10k, 0.9% for AGIs $10k-25k, 1.8% for AGIs $25k-50k, 2.7% for AGIs $50k-75k, 3.1% for AGIs $75k-100k, 4.9% for AGIs over 100k)
Total tax: $8,763 (reported on 71.9% of returns)
28403:
$8,763
State:
$7,257
(% of AGI for various income ranges: 6.1% for AGIs below $10k, 4.3% for AGIs $10k-25k, 7.7% for AGIs $25k-50k, 9.9% for AGIs $50k-75k, 11.4% for AGIs $75k-100k, 18.9% for AGIs over 100k)
Earned income credit: $1,611 (reported on 15.2% of returns)
Here:
$1,611
State:
$1,851
Percentage of individuals using paid preparers for their 2004 taxes: 57.4%
Here:
57%
State:
62%
(% for various income ranges: 51.5% for AGIs below $10k, 55.4% for AGIs $10k-25k, 54.1% for AGIs $25k-50k, 62.3% for AGIs $50k-75k, 63.2% for AGIs $75k-100k, 80.0% for AGIs over 100k)
Likely homosexual households (counted as self-reported same-sex unmarried-partner households)
Lesbian couples: 0.3% of all households
Gay men: 0.0% of all households
Household received Food Stamps/SNAP in the past 12 months: 1,602 Household did not receive Food Stamps/SNAP in the past 12 months: 17,240
Women who had a birth in the past 12 months: 359 (212 now married, 144 unmarried) Women who did not have a birth in the past 12 months: 13,795 (3,338 now married, 10,400 unmarried)
Housing units in zip code 28403 with a mortgage: 4,539 (439 second mortgage, 430 both second mortgage and home equity loan) Houses without a mortgage: 125
Median monthly owner costs for units with a mortgage: $1,655 Median monthly owner costs for units without a mortgage: $585
Residents with income below the poverty level in 2022:
This zip code:
23.5%
Whole state:
12.8%
Residents with income below 50% of the poverty level in 2022:
This zip code:
11.3%
Whole state:
6.8%
Median number of rooms in houses and condos:
Here:
6.5
State:
6.4
Median number of rooms in apartments:
Here:
4.0
State:
4.4
Notable locations in this zip code not listed on our city pages
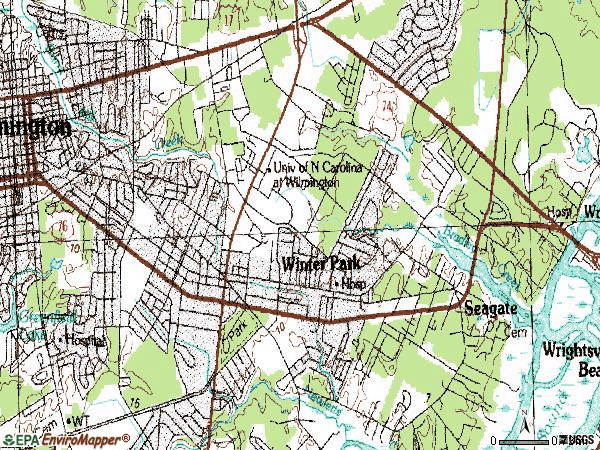
Notable locations in zip code 28403: Cape Fear Country Club (A), Duck Haven Golf Course (B), Oleander (C), Audubon (D), Fernside (E), Wilmington Residential Facility For Women (F), University of North Carolina - Wilmington Campus Student Recreation Center (G), University of North Carolina - Wilmington Campus Kenan Auditorium (H), The Kempton at Brightmore (I), The Commons at Brightmore (J), Federal Bureau Investigation (K), University of North Carolina - Wilmington Campus Randall Library (L). Display/hide their locations on the map
Shopping Centers: Azalea Plaza Shopping Center (1), Galleria Shopping Center (2), University Center Shopping Center (3), University Common Shopping Center (4), Hanover Shopping Center (5), Independence Mall (6). Display/hide their locations on the map
Churches in zip code 28403 include: Bible Baptist Church (A), Devon Park United Methodist Church (B), Church of the Servant (C), Saint Johns Episcopal Church (D), Saint Andrews on the Sound Episcopal Church (E), Pine Valley Church (F), Wrightsville Avenue Church of God (G), Winter Park Presbyterian Church (H), Winter Park Baptist Church (I). Display/hide their locations on the map
Parks in zip code 28403 include: University of North Carolina - Wilmington Campus Trask Coliseum (1), Airlie Gardens (2), Beaumont Park (3), Empie Park (4). Display/hide their locations on the map
Tourist attractions (not listed on the city page) : Jungle Rapids Family Fun Park (5320 Oleander Drive) (1), Credit Union & S Enterprises Inc (2130 Dexter Street) (2). Display/hide their approximate locations on the map
2,846 married couples with children.
1,534 single-parent households (195 men, 1,339 women).
91.1% of residents of 28403 zip code speak English at home.
4.8% of residents speak Spanish at home (76% very well, 13% well, 7% not well, 4% not at all).
1.7% of residents speak other Indo-European language at home (58% very well, 20% well, 22% not well).
1.6% of residents speak Asian or Pacific Island language at home (57% very well, 23% well, 5% not well, 15% not at all).
0.7% of residents speak other language at home (46% very well, 21% well, 5% not well, 28% not at all).
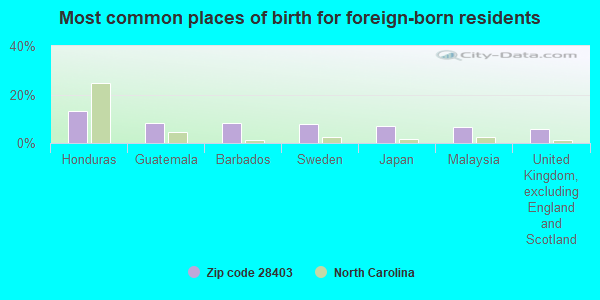
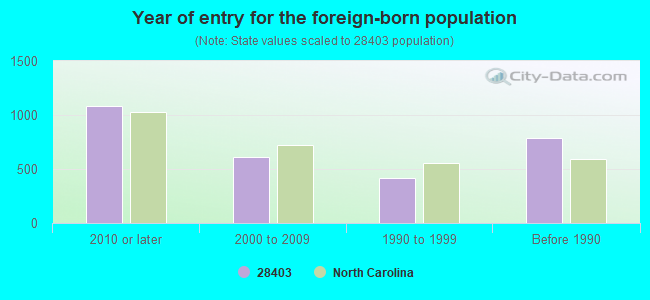
Foreign born population: 2,150 (5.3%) (46.6% of them are naturalized citizens)
Facilities with environmental interests located in this zip code:
BUSINESS TELECOM, INC. (BTI) (3255 BURNT MILL DRIVE, SUITE 1, 2 & 3 in WILMINGTON, NC)
ENFORCEMENT/COMPLIANCE ACTIVITY (Integrated Compliance Information System) - ICIS-04-2003-9973, FORMAL ENFORCEMENT ACTION (Integrated Compliance Information System) - ICIS-04-2003-9973, FORMAL ENFORCEMENT ACTION
CARTER GROUP, INC (5424 OLEANDER DR, SUITE 11 in WILMINGTON, NC)
AIR MINOR (AIRS/AFS) STATE MASTER (North Carolina facility info) - AIR PROGRAM Conditionally Exempt Small Quantity Generators, less than 100 kg/month of hazardous waste (Resource Conservation and Recovery Act (tracking hazardous waste)) - notification Business SIC classification: DRYCLEANING PLANTS, EXCEPT RUG CLEANING Organizations: SUNGIL KIM (CONTACT/OPERATOR)
, KYONG RIDDLE (CONTACT/OWNER)
Alternative names: EAGLE CLEANERS, KIM'S CLEANER
CAPE FEAR MEMORIAL HOSPITAL (5301 WRIGHTSVILLE AVE in WILMINGTON, NC)
AIR MINOR (AIRS/AFS) STATE MASTER (North Carolina facility info) - AIR PROGRAM Conditionally Exempt Small Quantity Generators, less than 100 kg/month of hazardous waste (Resource Conservation and Recovery Act (tracking hazardous waste)) - notification Business SIC classification: GENERAL MEDICAL AND SURGICAL HOSPITALS Organizations: NEW HANOVER REGIONAL MEDICAL CENTER (CONTACT/OWNER)
Alternative names: CAPE FEAR HOSPITAL
CAPE FEAR MOTOR SALES INC (4222 OLEANDER DR in WILMINGTON, NC)
STATE MASTER (North Carolina facility info) - UNDERGROUND STORAGE TANK PROGRAM (Resource Conservation and Recovery Act (tracking hazardous waste)) Business SIC classification: NONCLASSIFIABLE ESTABLISHMENTS Organizations: P. R. SMITH, JR. (CONTACT/OWNER)
BEAU RIVAGE PLANTATION WWTP (U.S. HIGHWAY 421 SOUTH in WILMINGTON, NC)
National Pollutant Discharge Elimination System NON-MAJOR (Tracking pollutant discharge elimination systems) - permit COMMUNITY WATER SYSTEM (SDWIS) - SDWIS-NC0465212 1T, WATER TREATMENT PLANT, SDWIS-NC0465212 6T, SDWIS-NC0465212 9T, Business SIC classification: SEWERAGE SYSTEMS
BRADLEY CREEK PUMP STATION (6341 OLEANDER DRIVE in WILMINGTON, NC)
AIR MINOR (AIRS/AFS) STATE MASTER (North Carolina facility info) - AIR PROGRAM Business SIC classification: SEWERAGE SYSTEMS
BOB KING PONTIAC GENERAL MOTORS CORPORATION INCORPORATED (5115 NEW CENTER DRIVE in WILMINGTON, NC)
STATE MASTER (North Carolina facility info) - UNDERGROUND STORAGE TANK PROGRAM Small Quantity Generators, between 100 kg and 1000 kg of hazardous waste/month (Resource Conservation and Recovery Act (tracking hazardous waste)) - notification Business SIC classification: NONCLASSIFIABLE ESTABLISHMENTS Alternative names: BOB KING PONTIAC GMC INC
ALLEN - GODWIN CONCRETE INC (800 SUNNYVALE DRIVE in WILMINGTON, NC)
AIR SYNTHETIC MINOR (AIRS/AFS) AIR MINOR (AIRS/AFS) CRITERIA AND HAZARDOUS AIR POLLUTANT INVENTORY (Inventory of air pollution sources) National Pollutant Discharge Elimination System NON-MAJOR (Tracking pollutant discharge elimination systems) - permit Business SIC classification: ASPHALT PAVING MIXTURES AND BLOCKS; READY-MIXED CONCRETE Business NAICS classification: ASPHALT PAVING MIXTURE AND BLOCK MANUFACTURING. Alternative names: ALLEN GODWIN CNCRTE INC SUNNYV, APAC CAROLINA INCORPORATED, APAC CAROLINA INC -SUNNYVALE, APAC CAROLINA INCORPORATED WILMINGTON ASPHALT P
CAPE FEAR CENTER FOR INQUIRY (3131 RANDALL PARKWAY SUITE B in WILMINGTON, NC)
(National Center for Education Statistics) - STATE ID-0
CLEAN & TIDY COIN LDY (1047 COLLEGE ROAD in WILMINGTON, NC)
(Resource Conservation and Recovery Act (tracking hazardous waste)) Organizations: GP BIGLEY (CONTACT/OWNER)
CAROLINA YACHT HARBOR (1322 ARLIE RD in WILMINGTON, NC)
National Pollutant Discharge Elimination System NON-MAJOR (Tracking pollutant discharge elimination systems) - permit
CAROLINA TRANSMISSION (5737 OLEANDER DR in WILMINGTON, NC)
Conditionally Exempt Small Quantity Generators, less than 100 kg/month of hazardous waste (Resource Conservation and Recovery Act (tracking hazardous waste)) - notification Organizations: VAL RUSSELL BOUDREAU (CONTACT/OWNER)
Housing units lacking complete plumbing facilities: 0.9% Housing units lacking complete kitchen facilities: 1.1%
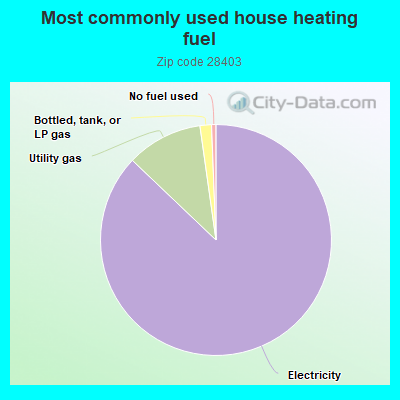
86.6%Electricity
10.6%Utility gas
1.6%Bottled, tank, or LP gas
0.6%No fuel used
Population in 1990: 25,319. Population change in the 1990s: +5,015 (+19.8%).
Place of birth for U.S.-born residents:
This state: 20,649
Northeast: 6,356
Midwest: 2,318
South: 6,388
West: 1,947
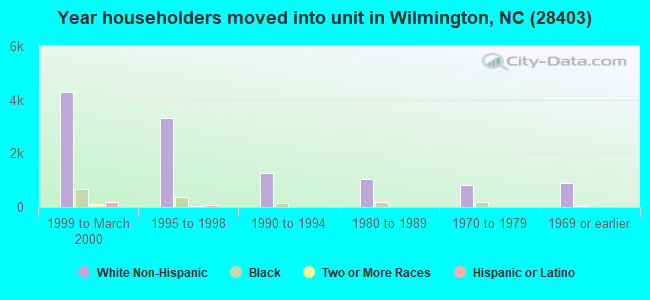
38% of the 28403 zip code residents lived in the same house 5 years ago. Out of people who lived in different houses, 39% lived in this county. Out of people who lived in different counties, 50% lived in North Carolina.
83% of the 28403 zip code residents lived in the same house 1 year ago. Out of people who lived in different houses, 43% moved from this county. Out of people who lived in different houses, 25% moved from different county within same state. Out of people who lived in different houses, 28% moved from different state. Out of people who lived in different houses, 1% moved from abroad.
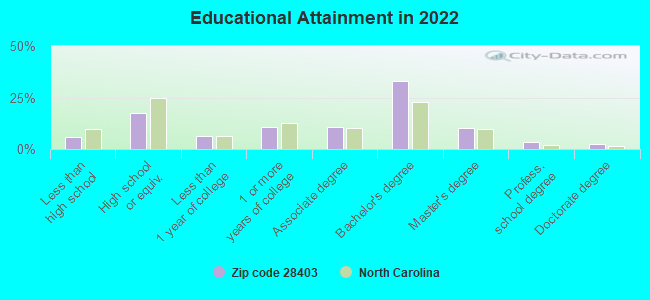
Private vs. public school enrollment:
Students in private schools in grades 1 to 8 (elementary and middle school): 764
Here:
36.1%
North Carolina:
13.8%
Students in private schools in grades 9 to 12 (high school): 154
Here:
15.2%
North Carolina:
11.9%
Students in private undergraduate colleges: 65
Here:
0.7%
North Carolina:
19.3%
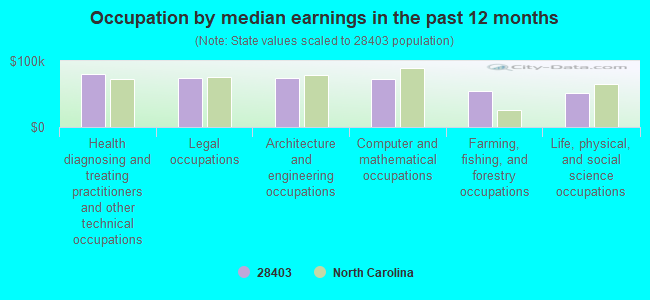
Occupation by median earnings in the past 12 months ($)
80,034Health diagnosing and treating practitioners and other technical occupations
74,644Legal occupations
74,270Architecture and engineering occupations
73,353Computer and mathematical occupations
54,501Farming, fishing, and forestry occupations
51,997Life, physical, and social science occupations
Companies with biggest federal contracts located in this zip code (WILMINGTON, NC):
AMY NORED HOWARD (808 COLONIAL DRIVE; small business) : $463,495 in 8 contractsfrom 2000 to 2003
Contracts for Physical Medicine and Rehabilitation Services, Other Medical Services by Navy Signed by year:2000: $180,835; 2001: $89,761; 2002: $37,535; 2003: $155,364; 2004: $0; 2005: $0; 2006: $0.
Biggest contracts:
$99,536 with Navy for Physical Medicine and Rehabilitation Services. Signed on 2003-10-01. Completion date: 2003-09-30.
$94,858 with Navy for Other Medical Services. Signed on 2000-02-09. Completion date: 2000-09-30.
$90,261 with Navy for Physical Medicine and Rehabilitation Services. Signed on 2001-10-01. Completion date: 2001-09-30.
$85,977, same as above.Signed on 2000-10-01. Completion date: 2001-09-30.
NORTH CAROLINA COASTAL LAND TR (3806 PARK AVE #B; small business) : $157,000 in 2 contractsfrom 2004 to 2005
$89,000 with Navy for Facilities Operations Support Services. Signed on 2005-09-09. Completion date: 2006-09-30.
$68,000, same as above.Signed on 2004-09-29. Completion date: 2004-12-31.
J & J FLOORS, INC (102 EASTWOOD RD; small business) : $113,259 in 9 contractsfrom 2000 to 2006
Contracts for Maintenance, Repair or Alteration of Real Property -- Other Industrial Buildings, Maintenance, Repair or Alteration of Real Property -- Restoration of real property, Maintenance, Repair or Alteration of Real Property -- Recreational Buildings by Navy, Air Force Signed by year:2000: $10,150; 2001: $6,685; 2002: $9,311; 2003: $9,311; 2004: $48,281; 2005: $18,886; 2006: $10,635.
Biggest contracts:
$40,804 with Navy for Maintenance, Repair or Alteration of Real Property -- Other Industrial Buildings. Signed on 2004-03-09. Completion date: 2004-08-31.
$18,886 with Air Force for Maintenance, Repair or Alteration of Real Property -- Restoration of real property. Signed on 2005-02-25. Completion date: 2005-04-21.
$10,635 with Navy for Maintenance, Repair or Alteration of Real Property -- Other Industrial Buildings. Signed on 2006-04-26. Completion date: 2006-05-26.
$10,150, same as above.Signed on 2000-08-08. Completion date: 2000-11-08.
BRUCE WATKINS SUPPLY INC (1940 DAWSON ST; small business) : $111,404 in 11 contractsfrom 2003 to 2005
Contracts for Hardware, Commercial, Floor Polishers and Vacuum Cleaning Equipment by Navy, Army Signed by year:2000: $0; 2001: $0; 2002: $0; 2003: $5,445; 2004: $16,358; 2005: $89,601; 2006: $0.
Biggest contracts:
$17,777 with Navy for Hardware, Commercial. Signed on 2005-04-26. Completion date: 2005-04-26.
$17,085, same as above.Signed on 2005-03-08. Completion date: 2005-03-08.
$15,204, same as above.Signed on 2005-08-03. Completion date: 2005-08-03.
$13,326, same as above.Signed on 2004-10-15. Completion date: 2004-10-15.
NEFF RENTAL, INC (4010 MARKET STREET; small business) : $93,645 in 5 contractsfrom 2000 to 2003
Contracts for Lease or Rental of Equipment -- Materials Handling Equipment, Lease or Rental of Equipment -- Service and Trade Equipment, Lease or Rental of Equipment -- Special Industry Machinery by Army Signed by year:2000: $57,880; 2001: $16,060; 2002: $14,705; 2003: $5,000; 2004: $0; 2005: $0; 2006: $0.
Biggest contracts:
$57,880 with Army for Lease or Rental of Equipment -- Materials Handling Equipment. Signed on 2000-10-24. Completion date: 2000-10-24.
$16,060 with Army for Lease or Rental of Equipment -- Service and Trade Equipment. Signed on 2001-11-20. Completion date: 2001-12-31.
$10,403 with Army for Lease or Rental of Equipment -- Special Industry Machinery. Signed on 2002-04-11. Completion date: 2002-02-15.
$5,000 with Army for Lease or Rental of Equipment -- Service and Trade Equipment. Signed on 2003-07-15. Completion date: 2003-10-10.
COMMUNICATION HEADQUARTERS, IN (3832 OLEANDER DR; small business)
$88,280 with Navy for Miscellaneous Communication Equipment. Signed on 2003-02-12. Completion date: 2003-02-28.
PINTECH CORPORATION (2250 SHIPYARD BLVD; small business) : $76,132 in 6 contractsfrom 2000 to 2006
Contracts for Maintenance, Repair or Alteration of Real Property -- Hospitals and Infirmaries, Maintenance, Repair or Alteration of Real Property -- Other Industrial Buildings by Navy Signed by year:2000: $12,688; 2001: $2,475; 2002: $0; 2003: $0; 2004: $41,362; 2005: $19,282; 2006: $325.
Biggest contracts:
$38,902 with Navy for Maintenance, Repair or Alteration of Real Property -- Hospitals and Infirmaries. Signed on 2004-08-11. Completion date: 2004-09-30.
$19,282, same as above.Signed on 2005-03-23. Completion date: 2005-06-30.
$12,688 with Navy for Maintenance, Repair or Alteration of Real Property -- Other Industrial Buildings. Signed on 2000-09-21. Completion date: 2000-12-21.
$2,475, same as above.Signed on 2001-04-11. Completion date: 2000-12-21.
BUTLERS ELECTRIC SUPPLY OF WIL (2013 CASTEL ST; small business)
$61,284 with Navy for Miscellaneous Electric Power and Distribution Equipment. Signed on 2001-08-21. Completion date: 2001-09-25.
360 COMMUNICATIONS COMPANY (4512 OLEANDER DRIVE) : $42,000 in 6 contractsfrom 2001 to 2004
Contracts for Telephone and Telegraph Equipment by Army Signed by year:2000: $0; 2001: $9,000; 2002: $24,000; 2003: $3,000; 2004: $6,000; 2005: $0; 2006: $0.
Biggest contracts:
$16,500 with Army for Telephone and Telegraph Equipment. Signed on 2002-10-21. Completion date: 2003-09-30.
$9,000, same as above.Signed on 2001-10-01. Completion date: 2002-09-30.
$7,500, same as above.Signed on 2002-07-08. Completion date: 2002-09-30.
$3,000, same as above.Signed on 2004-01-06. Completion date: 2003-09-30.
LINKMASTERS INC (109 HINTON AVE STE 1; small business)
$40,852 with Navy for Radio and Television Communication Equipment, Except Airborne. Signed on 2000-09-15. Completion date: 2000-10-30.
Top industries in this zip code by the number of employees in 2005:
Administrative and Support and Waste Management and Remediation Services: Temporary Help Services (250-499: 2, 100-249: 2, 50-99: 2, 20-49: 4, 10-19: 2)
Health Care and Social Assistance: Home Health Care Services (100-249: 4, 50-99: 2, 20-49: 2, 10-19: 3, 5-9: 1, 1-4: 4)
Health Care and Social Assistance: Offices of Physicians (except Mental Health Specialists) (50-99: 2, 20-49: 12, 10-19: 9, 5-9: 16, 1-4: 15)
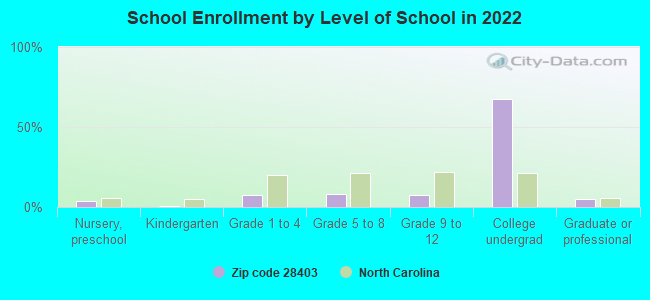
People in group quarters in 2010:
3,851 people in college/university student housing
60 people in workers' group living quarters and job corps centers
53 people in group homes intended for adults
31 people in residential treatment centers for adults
15 people in local jails and other municipal confinement facilities
13 people in emergency and transitional shelters (with sleeping facilities) for people experiencing homelessness
People in group quarters in 2000:
1,923 people in college dormitories (includes college quarters off campus)
195 people in other noninstitutional group quarters
94 people in nursing homes
57 people in other nonhousehold living situations
36 people in state prisons
22 people in other group homes
6 people in mental (psychiatric) hospitals or wards
Fatal accident statistics in 2014:
Fatal accident count: 6
Vehicles involved in fatal accidents: 10
Fatal accidents caused by drunken drivers: 7
Fatalities: 6
Persons involved in fatal accidents: 16
Pedestrians involved in fatal accidents: 1
Fatal accident statistics in 2013:
Fatal accident count: 3
Vehicles involved in fatal accidents: 4
Fatal accidents caused by drunken drivers: 1
Fatalities: 3
Persons involved in fatal accidents: 6
Pedestrians involved in fatal accidents: 2
Home Mortgage Disclosure Act Aggregated Statistics For Year 2009 (Based on 11 full and 4 partial tracts)
A) FHA, FSA/RHS & VA Home Purchase Loans
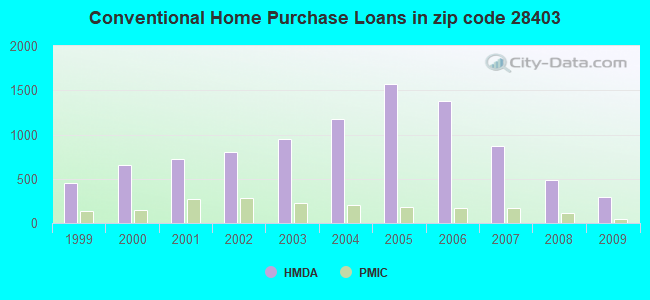
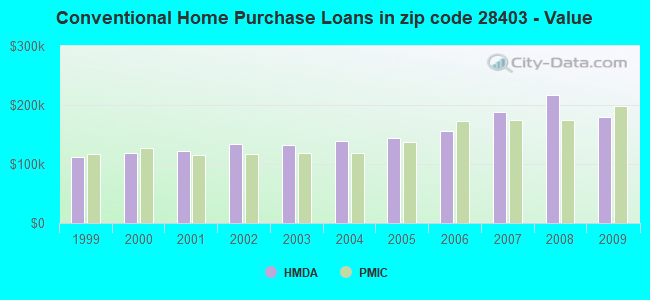
B) Conventional Home Purchase Loans
C) Refinancings
D) Home Improvement Loans
E) Loans on Dwellings For 5+ Families
F) Non-occupant Loans on < 5 Family Dwellings (A B C & D)
G) Loans On Manufactured Home Dwelling (A B C & D)
Number
Average Value
Number
Average Value
Number
Average Value
Number
Average Value
Number
Average Value
Number
Average Value
Number
Average Value
LOANS ORIGINATED
96
$186,551
296
$179,897
1,208
$208,667
41
$145,065
2
$1,107,500
256
$150,867
4
$136,458
APPLICATIONS APPROVED, NOT ACCEPTED
11
$158,982
20
$205,491
117
$207,103
5
$143,722
0
$0
26
$146,760
0
$0
APPLICATIONS DENIED
32
$137,025
48
$142,784
313
$205,446
24
$57,400
0
$0
80
$145,821
4
$68,178
APPLICATIONS WITHDRAWN
20
$149,355
34
$214,584
255
$195,518
4
$99,648
0
$0
67
$147,060
2
$152,770
FILES CLOSED FOR INCOMPLETENESS
7
$182,199
3
$118,770
63
$228,023
1
$63,210
0
$0
2
$147,880
0
$0
Aggregated Statistics For Year 2008 (Based on 11 full and 4 partial tracts)
A) FHA, FSA/RHS & VA Home Purchase Loans
B) Conventional Home Purchase Loans
C) Refinancings
D) Home Improvement Loans
E) Loans on Dwellings For 5+ Families
F) Non-occupant Loans on < 5 Family Dwellings (A B C & D)
G) Loans On Manufactured Home Dwelling (A B C & D)
Number
Average Value
Number
Average Value
Number
Average Value
Number
Average Value
Number
Average Value
Number
Average Value
Number
Average Value
LOANS ORIGINATED
47
$175,230
483
$216,497
857
$200,837
67
$82,539
28
$3,430,004
366
$152,832
2
$45,240
APPLICATIONS APPROVED, NOT ACCEPTED
2
$290,130
42
$156,293
100
$195,208
15
$77,104
0
$0
35
$120,594
2
$29,705
APPLICATIONS DENIED
12
$150,725
68
$192,641
260
$191,175
37
$55,133
0
$0
64
$157,192
8
$140,718
APPLICATIONS WITHDRAWN
8
$182,176
50
$164,887
182
$202,713
10
$128,774
0
$0
39
$165,296
2
$26,710
FILES CLOSED FOR INCOMPLETENESS
1
$113,000
9
$165,066
51
$233,127
2
$73,050
0
$0
11
$100,757
2
$121,230
Aggregated Statistics For Year 2007 (Based on 11 full and 4 partial tracts)
A) FHA, FSA/RHS & VA Home Purchase Loans
B) Conventional Home Purchase Loans
C) Refinancings
D) Home Improvement Loans
E) Loans on Dwellings For 5+ Families
F) Non-occupant Loans on < 5 Family Dwellings (A B C & D)
G) Loans On Manufactured Home Dwelling (A B C & D)
Number
Average Value
Number
Average Value
Number
Average Value
Number
Average Value
Number
Average Value
Number
Average Value
Number
Average Value
LOANS ORIGINATED
16
$163,768
865
$188,173
924
$184,893
134
$93,057
8
$6,264,504
538
$156,974
7
$585,760
APPLICATIONS APPROVED, NOT ACCEPTED
0
$0
120
$195,845
111
$150,578
18
$48,897
0
$0
62
$134,666
9
$60,054
APPLICATIONS DENIED
5
$177,146
167
$161,295
268
$203,168
41
$101,182
0
$0
106
$163,230
14
$53,739
APPLICATIONS WITHDRAWN
2
$99,545
62
$210,722
123
$209,874
13
$134,791
0
$0
28
$177,883
0
$0
FILES CLOSED FOR INCOMPLETENESS
0
$0
27
$298,129
44
$278,151
3
$174,177
0
$0
7
$140,999
0
$0
Aggregated Statistics For Year 2006 (Based on 11 full and 4 partial tracts)
A) FHA, FSA/RHS & VA Home Purchase Loans
B) Conventional Home Purchase Loans
C) Refinancings
D) Home Improvement Loans
E) Loans on Dwellings For 5+ Families
F) Non-occupant Loans on < 5 Family Dwellings (A B C & D)
G) Loans On Manufactured Home Dwelling (A B C & D)
Number
Average Value
Number
Average Value
Number
Average Value
Number
Average Value
Number
Average Value
Number
Average Value
Number
Average Value
LOANS ORIGINATED
28
$166,860
1,380
$155,183
1,056
$183,088
150
$81,174
14
$6,068,442
839
$136,004
8
$81,870
APPLICATIONS APPROVED, NOT ACCEPTED
4
$94,658
109
$133,585
122
$150,388
24
$74,754
0
$0
74
$149,278
11
$47,865
APPLICATIONS DENIED
17
$137,393
240
$133,316
258
$165,604
47
$64,372
0
$0
125
$139,950
44
$86,747
APPLICATIONS WITHDRAWN
5
$154,540
114
$148,293
168
$164,784
13
$90,604
0
$0
82
$135,753
1
$112,000
FILES CLOSED FOR INCOMPLETENESS
0
$0
35
$126,972
61
$176,026
8
$40,452
0
$0
14
$135,292
0
$0
Aggregated Statistics For Year 2005 (Based on 11 full and 4 partial tracts)
A) FHA, FSA/RHS & VA Home Purchase Loans
B) Conventional Home Purchase Loans
C) Refinancings
D) Home Improvement Loans
E) Loans on Dwellings For 5+ Families
F) Non-occupant Loans on < 5 Family Dwellings (A B C & D)
G) Loans On Manufactured Home Dwelling (A B C & D)
Number
Average Value
Number
Average Value
Number
Average Value
Number
Average Value
Number
Average Value
Number
Average Value
Number
Average Value
LOANS ORIGINATED
42
$120,655
1,575
$143,263
1,186
$172,220
101
$92,790
10
$4,875,477
993
$121,020
15
$498,613
APPLICATIONS APPROVED, NOT ACCEPTED
2
$139,955
121
$122,284
138
$100,973
11
$36,541
0
$0
90
$99,933
5
$83,072
APPLICATIONS DENIED
17
$110,316
222
$123,635
282
$178,534
50
$85,902
0
$0
135
$100,736
53
$61,015
APPLICATIONS WITHDRAWN
1
$164,000
213
$123,552
148
$165,146
29
$127,344
0
$0
79
$114,201
0
$0
FILES CLOSED FOR INCOMPLETENESS
0
$0
35
$148,409
92
$168,311
1
$296,580
0
$0
25
$120,560
0
$0
Aggregated Statistics For Year 2004 (Based on 11 full and 4 partial tracts)
A) FHA, FSA/RHS & VA Home Purchase Loans
B) Conventional Home Purchase Loans
C) Refinancings
D) Home Improvement Loans
E) Loans on Dwellings For 5+ Families
F) Non-occupant Loans on < 5 Family Dwellings (A B C & D)
G) Loans On Manufactured Home Dwelling (A B C & D)
Number
Average Value
Number
Average Value
Number
Average Value
Number
Average Value
Number
Average Value
Number
Average Value
Number
Average Value
LOANS ORIGINATED
40
$115,776
1,178
$138,661
980
$151,267
48
$104,890
5
$2,188,324
726
$114,027
12
$105,028
APPLICATIONS APPROVED, NOT ACCEPTED
5
$45,362
138
$117,010
102
$104,897
6
$74,500
0
$0
55
$87,885
17
$52,538
APPLICATIONS DENIED
14
$85,754
185
$107,447
261
$128,878
41
$35,054
0
$0
104
$105,271
41
$44,982
APPLICATIONS WITHDRAWN
5
$108,330
148
$136,687
211
$134,239
9
$16,854
0
$0
63
$94,867
4
$78,048
FILES CLOSED FOR INCOMPLETENESS
0
$0
22
$127,829
51
$129,986
2
$29,740
0
$0
8
$148,258
0
$0
Aggregated Statistics For Year 2003 (Based on 11 full and 4 partial tracts)
A) FHA, FSA/RHS & VA Home Purchase Loans
B) Conventional Home Purchase Loans
C) Refinancings
D) Home Improvement Loans
E) Loans on Dwellings For 5+ Families
F) Non-occupant Loans on < 5 Family Dwellings (A B C & D)
Number
Average Value
Number
Average Value
Number
Average Value
Number
Average Value
Number
Average Value
Number
Average Value
LOANS ORIGINATED
48
$111,289
951
$132,669
2,246
$144,303
34
$34,399
4
$628,465
711
$108,992
APPLICATIONS APPROVED, NOT ACCEPTED
2
$95,605
89
$105,821
199
$125,660
8
$16,509
0
$0
40
$85,933
APPLICATIONS DENIED
16
$93,419
150
$93,371
377
$122,168
24
$16,745
0
$0
64
$106,443
APPLICATIONS WITHDRAWN
15
$103,619
93
$111,381
307
$128,377
1
$83,440
0
$0
74
$93,470
FILES CLOSED FOR INCOMPLETENESS
5
$107,368
18
$143,567
55
$177,034
6
$21,417
0
$0
14
$96,384
Aggregated Statistics For Year 2002 (Based on 11 full and 4 partial tracts)
A) FHA, FSA/RHS & VA Home Purchase Loans
B) Conventional Home Purchase Loans
C) Refinancings
D) Home Improvement Loans
E) Loans on Dwellings For 5+ Families
F) Non-occupant Loans on < 5 Family Dwellings (A B C & D)
Number
Average Value
Number
Average Value
Number
Average Value
Number
Average Value
Number
Average Value
Number
Average Value
LOANS ORIGINATED
47
$109,784
806
$133,059
1,739
$145,063
45
$35,283
4
$359,438
578
$108,824
APPLICATIONS APPROVED, NOT ACCEPTED
5
$106,940
85
$98,390
183
$117,856
12
$29,463
0
$0
36
$100,856
APPLICATIONS DENIED
19
$68,393
196
$70,354
311
$116,551
20
$19,161
0
$0
62
$93,523
APPLICATIONS WITHDRAWN
18
$107,846
71
$129,206
250
$117,376
16
$38,086
0
$0
56
$87,797
FILES CLOSED FOR INCOMPLETENESS
2
$63,375
17
$85,666
57
$157,392
1
$10,000
0
$0
5
$58,134
Aggregated Statistics For Year 2001 (Based on 11 full and 4 partial tracts)
A) FHA, FSA/RHS & VA Home Purchase Loans
B) Conventional Home Purchase Loans
C) Refinancings
D) Home Improvement Loans
E) Loans on Dwellings For 5+ Families
F) Non-occupant Loans on < 5 Family Dwellings (A B C & D)
Number
Average Value
Number
Average Value
Number
Average Value
Number
Average Value
Number
Average Value
Number
Average Value
LOANS ORIGINATED
74
$99,258
721
$121,525
1,356
$144,896
79
$33,350
2
$3,663,500
440
$97,276
APPLICATIONS APPROVED, NOT ACCEPTED
3
$79,223
84
$83,075
123
$109,690
12
$24,764
0
$0
23
$72,422
APPLICATIONS DENIED
14
$86,007
195
$62,049
278
$122,544
23
$26,132
0
$0
43
$81,880
APPLICATIONS WITHDRAWN
17
$107,226
70
$125,085
235
$119,652
3
$31,507
0
$0
37
$109,161
FILES CLOSED FOR INCOMPLETENESS
2
$91,200
3
$125,127
45
$104,802
0
$0
0
$0
18
$106,461
Aggregated Statistics For Year 2000 (Based on 11 full and 4 partial tracts)
A) FHA, FSA/RHS & VA Home Purchase Loans
B) Conventional Home Purchase Loans
C) Refinancings
D) Home Improvement Loans
E) Loans on Dwellings For 5+ Families
F) Non-occupant Loans on < 5 Family Dwellings (A B C & D)
Number
Average Value
Number
Average Value
Number
Average Value
Number
Average Value
Number
Average Value
Number
Average Value
LOANS ORIGINATED
67
$98,798
650
$119,323
446
$105,244
44
$27,801
2
$5,815,040
217
$89,936
APPLICATIONS APPROVED, NOT ACCEPTED
24
$63,402
95
$95,040
121
$88,378
12
$48,202
0
$0
18
$89,997
APPLICATIONS DENIED
61
$50,704
237
$58,514
257
$190,057
36
$21,984
0
$0
37
$58,775
APPLICATIONS WITHDRAWN
17
$88,551
52
$115,084
111
$80,318
6
$27,277
0
$0
10
$80,867
FILES CLOSED FOR INCOMPLETENESS
2
$104,085
17
$141,798
17
$177,918
2
$176,860
0
$0
3
$98,173
Aggregated Statistics For Year 1999 (Based on 6 full and 2 partial tracts)
A) FHA, FSA/RHS & VA Home Purchase Loans
B) Conventional Home Purchase Loans
C) Refinancings
D) Home Improvement Loans
E) Loans on Dwellings For 5+ Families
F) Non-occupant Loans on < 5 Family Dwellings (A B C & D)
2002 - 2018 National Fire Incident Reporting System (NFIRS) incidents
According to the data from the years 2002 - 2018 the average number of fire incidents per year is 146. The highest number of reported fire incidents - 179 took place in 2018, and the least - 107 in 2003. The data has an increasing trend.
When looking into fire subcategories, the most reports belonged to: Outside Fires (48.5%), and Structure Fires (35.1%).
Fire incident types reported to NFIRS in Zip Code 28403


 Nearest zip codes: 28405, 28409, 28480, 28412, 28401, 28411.


 According to the data from the years 2002 - 2018 the average number of fire incidents per year is 146. The highest number of reported fire incidents - 179 took place in 2018, and the least - 107 in 2003. The data has an increasing trend.
 When looking into fire subcategories, the most reports belonged to: Outside Fires (48.5%), and Structure Fires (35.1%).