Estimated zip code population in 2022: 35,106 Zip code population in 2010: 29,152 Zip code population in 2000: 24,968
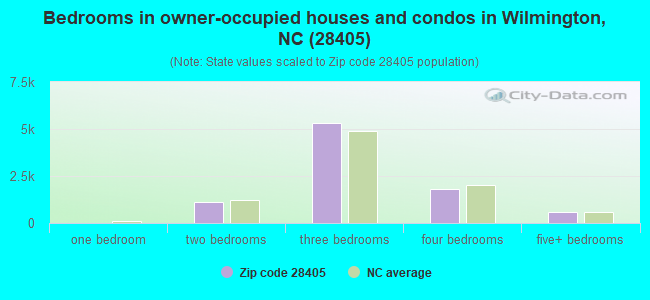
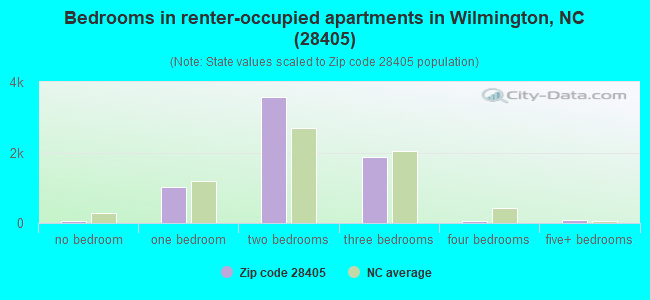
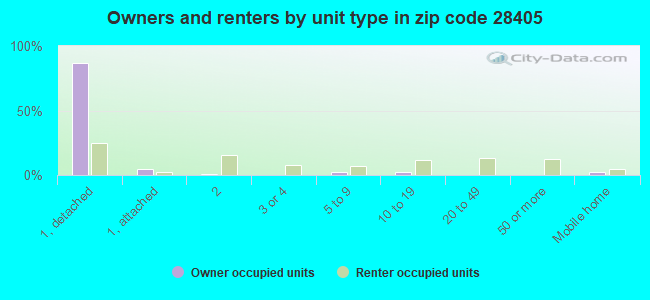
Houses and condos: 17,046 Renter-occupied apartments: 6,697
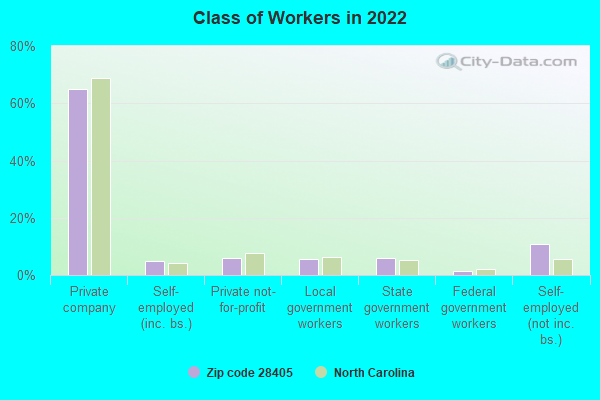
% of renters here:
43%
State:
33%
March 2022 cost of living index in zip code 28405: 94.9 (less than average, U.S. average is 100)
Land area: 24.1 sq. mi. Water area: 0.5 sq. mi.
Population density: 1,459 people per square mile
(low).
OSM Map
General Map
Google Map
MSN Map
OSM Map
General Map
Google Map
MSN Map
OSM Map
General Map
Google Map
MSN Map
OSM Map
General Map
Google Map
MSN Map
Please wait while loading the map...
Real estate property taxes paid for housing units in 2022:
This zip code:
0.5% ($1,869)
North Carolina:
0.6% ($1,769)
Median real estate property taxes paid for housing units with mortgages in 2022: $1,769 (0.5%) Median real estate property taxes paid for housing units with no mortgage in 2022: $2,141 (0.5%)
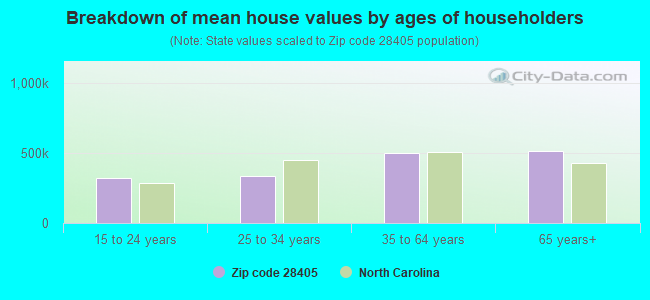
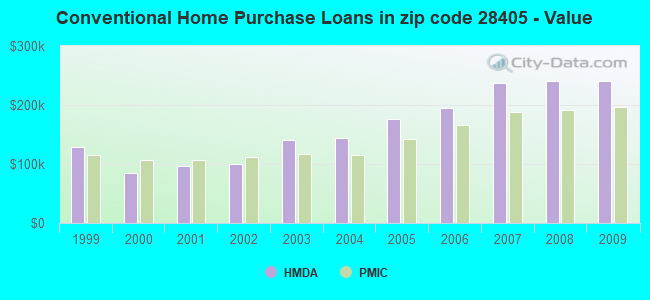
Estimated median house/condo value in 2022: $352,512
28405:
$352,512
North Carolina:
$280,600
According to our research of North Carolina and other state lists, there were 41 registered sex offenders living in 28405 zip code as of April 27, 2024. The ratio of all residents to sex offenders in zip code 28405 is 781 to 1. The ratio of registered sex offenders to all residents in this zip code is lower than the state average.
Median resident age:
This zip code:
38.7 years
North Carolina median age:
39.2 years
Average household size:
This zip code:
2.2 people
North Carolina:
2.4 people
Averages for the 2020 tax year for zip code 28405, filed in 2021:
Average Adjusted Gross Income (AGI) in 2020: $93,392 (Individual Income Tax Returns)
Here:
$93,392
State:
$70,020
Salary/wage: $61,362 (reported on 76.6% of returns)
Here:
$61,362
State:
$58,387
(% of AGI for various income ranges: 1208.6% for AGIs below $25k, 3800.2% for AGIs $25k-50k, 6701.7% for AGIs $50k-75k, 10127.6% for AGIs $75k-100k, 17122.6% for AGIs $100k-200k, 113732.2% for AGIs over 200k)
Taxable interest for individuals: $2,657 (reported on 33.3% of returns)
This zip code:
$2,657
North Carolina:
$1,479
(% of AGI for various income ranges: 14.6% for AGIs below $25k, 23.5% for AGIs $25k-50k, 63.7% for AGIs $50k-75k, 89.9% for AGIs $75k-100k, 363.0% for AGIs $100k-200k, 3260.7% for AGIs over 200k)
Ordinary dividends: $13,939 (reported on 24.3% of returns)
Here:
$13,939
State:
$7,888
(% of AGI for various income ranges: 45.1% for AGIs below $25k, 60.8% for AGIs $25k-50k, 152.8% for AGIs $50k-75k, 399.1% for AGIs $75k-100k, 1442.4% for AGIs $100k-200k, 13085.2% for AGIs over 200k)
Net capital gain/loss in AGI: +$59,488 (reported on 23.4% of returns)
Here:
+$59,488
State:
+$23,652
(% of AGI for various income ranges: 15.9% for AGIs below $25k, 49.0% for AGIs $25k-50k, 154.9% for AGIs $50k-75k, 350.5% for AGIs $75k-100k, 1391.3% for AGIs $100k-200k, 78610.0% for AGIs over 200k)
Profit/loss from business: +$17,493 (reported on 18.8% of returns)
Here:
+$17,493
State:
+$11,710
(% of AGI for various income ranges: 173.0% for AGIs below $25k, 260.5% for AGIs $25k-50k, 312.6% for AGIs $50k-75k, 545.1% for AGIs $75k-100k, 1251.7% for AGIs $100k-200k, 7775.9% for AGIs over 200k)
Taxable individual retirement arrangement distribution: $27,686 (reported on 10.9% of returns)
28405:
$27,686
North Carolina:
$20,247
(% of AGI for various income ranges: 53.5% for AGIs below $25k, 103.6% for AGIs $25k-50k, 302.9% for AGIs $50k-75k, 625.2% for AGIs $75k-100k, 2012.0% for AGIs $100k-200k, 7068.9% for AGIs over 200k)
Self-employed (Keogh) retirement plans: $25,967 (reported on 0.7% of returns)
28405:
$25,967
North Carolina:
$26,749
(% of AGI for various income ranges: 74.8% for AGIs $100k-200k, 921.5% for AGIs over 200k)
Total itemized deductions: $40,565 (reported on 10.4% of returns)
Here:
$40,565
State:
$34,549
(% of AGI for various income ranges: 51.1% for AGIs below $25k, 137.3% for AGIs $25k-50k, 337.9% for AGIs $50k-75k, 659.5% for AGIs $75k-100k, 1596.2% for AGIs $100k-200k, 15034.4% for AGIs over 200k)
Charity contributions: $18,130 (reported on 8.5% of returns)
Here:
$18,130
State:
$13,360
(% of AGI for various income ranges: 5.0% for AGIs below $25k, 19.2% for AGIs $25k-50k, 51.3% for AGIs $50k-75k, 107.7% for AGIs $75k-100k, 357.1% for AGIs $100k-200k, 7507.8% for AGIs over 200k)
Taxes paid: $7,998 (reported on 10.1% of returns)
28405:
$7,998
State:
$7,586
(% of AGI for various income ranges: 6.7% for AGIs below $25k, 22.1% for AGIs $25k-50k, 72.9% for AGIs $50k-75k, 160.7% for AGIs $75k-100k, 443.3% for AGIs $100k-200k, 2432.6% for AGIs over 200k)
Earned income credit: $2,245 (reported on 15.7% of returns)
Here:
$2,245
State:
$2,337
(% of AGI for various income ranges: 102.0% for AGIs below $25k, 59.9% for AGIs $25k-50k, 1.0% for AGIs $50k-75k)
Percentage of individuals using paid preparers for their 2020 taxes: 92.1%
Here:
92%
State:
93%
(% for various income ranges: 90.3% for AGIs below $25k, 92.2% for AGIs $25k-50k, 92.7% for AGIs $50k-75k, 92.6% for AGIs $75k-100k, 93.3% for AGIs $100k-200k, 95.9% for AGIs over 200k)
Averages for the 2012 tax year for zip code 28405, filed in 2013:
Average Adjusted Gross Income (AGI) in 2012: $63,598 (Individual Income Tax Returns)
Here:
$63,598
State:
$54,937
Salary/wage: $46,565 (reported on 82.1% of returns)
Here:
$46,565
State:
$46,336
(% of AGI for various income ranges: 76.2% for AGIs below $25k, 79.5% for AGIs $25k-50k, 70.4% for AGIs $50k-75k, 66.4% for AGIs $75k-100k, 59.5% for AGIs $100k-200k, 44.9% for AGIs over 200k)
Taxable interest for individuals: $2,560 (reported on 32.7% of returns)
This zip code:
$2,560
North Carolina:
$1,298
(% of AGI for various income ranges: 0.9% for AGIs below $25k, 0.5% for AGIs $25k-50k, 0.9% for AGIs $50k-75k, 1.0% for AGIs $75k-100k, 1.1% for AGIs $100k-200k, 2.0% for AGIs over 200k)
Ordinary dividends: $10,336 (reported on 20.8% of returns)
Here:
$10,336
State:
$6,213
(% of AGI for various income ranges: 1.7% for AGIs below $25k, 1.4% for AGIs $25k-50k, 1.7% for AGIs $50k-75k, 2.9% for AGIs $75k-100k, 3.5% for AGIs $100k-200k, 5.0% for AGIs over 200k)
Net capital gain/loss in AGI: +$23,973 (reported on 17.6% of returns)
Here:
+$23,973
State:
+$12,740
(% of AGI for various income ranges: 0.9% for AGIs $50k-75k, 1.1% for AGIs $75k-100k, 2.6% for AGIs $100k-200k, 15.9% for AGIs over 200k)
Profit/loss from business: +$16,045 (reported on 16.4% of returns)
Here:
+$16,045
State:
+$10,311
(% of AGI for various income ranges: 8.5% for AGIs below $25k, 3.8% for AGIs $25k-50k, 3.6% for AGIs $50k-75k, 2.7% for AGIs $75k-100k, 3.1% for AGIs $100k-200k, 4.3% for AGIs over 200k)
Taxable individual retirement arrangement distribution: $23,204 (reported on 11.1% of returns)
28405:
$23,204
North Carolina:
$15,575
(% of AGI for various income ranges: 2.3% for AGIs below $25k, 2.2% for AGIs $25k-50k, 3.5% for AGIs $50k-75k, 3.7% for AGIs $75k-100k, 7.0% for AGIs $100k-200k, 3.9% for AGIs over 200k)
Self-employment retirement plans: $25,660 (reported on 0.7% of returns)
28405:
$25,660
North Carolina:
$21,078
(% of AGI for various income ranges: 0.2% for AGIs below $25k, 0.2% for AGIs $100k-200k, 0.6% for AGIs over 200k)
Total itemized deductions: $27,963 (21% of AGI, reported on 34.3% of returns)
Here:
$27,963
State:
$23,438
Here:
20.8% of AGI
State:
21.5% of AGI
(% of AGI for various income ranges: 10.6% for AGIs below $25k, 11.4% for AGIs $25k-50k, 15.1% for AGIs $50k-75k, 17.0% for AGIs $75k-100k, 18.2% for AGIs $100k-200k, 15.3% for AGIs over 200k)
Charity contributions: $5,031 (reported on 27.8% of returns)
Here:
$5,031
State:
$4,687
(% of AGI for various income ranges: 0.9% for AGIs below $25k, 1.3% for AGIs $25k-50k, 2.0% for AGIs $50k-75k, 2.5% for AGIs $75k-100k, 2.4% for AGIs $100k-200k, 2.7% for AGIs over 200k)
Taxes paid: $10,851 (reported on 34.0% of returns)
28405:
$10,851
State:
$8,823
(% of AGI for various income ranges: 1.8% for AGIs below $25k, 2.7% for AGIs $25k-50k, 4.4% for AGIs $50k-75k, 5.6% for AGIs $75k-100k, 7.5% for AGIs $100k-200k, 7.4% for AGIs over 200k)
Earned income credit: $2,194 (reported on 17.8% of returns)
Here:
$2,194
State:
$2,376
(% of AGI for various income ranges: 5.8% for AGIs below $25k, 0.8% for AGIs $25k-50k)
Percentage of individuals using paid preparers for their 2012 taxes: 49.9%
Here:
50%
State:
53%
(% for various income ranges: 46.3% for AGIs below $25k, 44.4% for AGIs $25k-50k, 51.4% for AGIs $50k-75k, 51.9% for AGIs $75k-100k, 62.7% for AGIs $100k-200k, 82.8% for AGIs over 200k)
Averages for the 2004 tax year for zip code 28405, filed in 2005:
Average Adjusted Gross Income (AGI) in 2004: $55,957 (Individual Income Tax Returns)
Here:
$55,957
State:
$45,376
Salary/wage: $39,405 (reported on 82.3% of returns)
Here:
$39,405
State:
$39,442
(% of AGI for various income ranges: 221.7% for AGIs below $10k, 78.5% for AGIs $10k-25k, 77.6% for AGIs $25k-50k, 72.5% for AGIs $50k-75k, 69.0% for AGIs $75k-100k, 40.3% for AGIs over 100k)
Taxable interest for individuals: $2,650 (reported on 42.4% of returns)
This zip code:
$2,650
North Carolina:
$1,515
(% of AGI for various income ranges: 10.8% for AGIs below $10k, 1.4% for AGIs $10k-25k, 1.2% for AGIs $25k-50k, 1.2% for AGIs $50k-75k, 1.7% for AGIs $75k-100k, 2.5% for AGIs over 100k)
Taxable dividends: $7,328 (reported on 25.6% of returns)
Here:
$7,328
State:
$4,016
(% of AGI for various income ranges: 8.9% for AGIs below $10k, 1.7% for AGIs $10k-25k, 1.7% for AGIs $25k-50k, 2.1% for AGIs $50k-75k, 2.4% for AGIs $75k-100k, 4.6% for AGIs over 100k)
Net capital gain/loss: +$33,511 (reported on 22.3% of returns)
Here:
+$33,511
State:
+$11,152
(% of AGI for various income ranges: -2.0% for AGIs below $10k, 0.8% for AGIs $10k-25k, 0.9% for AGIs $25k-50k, 1.7% for AGIs $50k-75k, 2.9% for AGIs $75k-100k, 24.6% for AGIs over 100k)
Profit/loss from business: +$16,875 (reported on 16.5% of returns)
Here:
+$16,875
State:
+$9,490
(% of AGI for various income ranges: 15.8% for AGIs below $10k, 4.7% for AGIs $10k-25k, 3.8% for AGIs $25k-50k, 3.0% for AGIs $50k-75k, 3.8% for AGIs $75k-100k, 6.0% for AGIs over 100k)
IRA payment deduction: $3,117 (reported on 2.8% of returns)
28405:
$3,117
North Carolina:
$2,967
(% of AGI for various income ranges: 0.7% for AGIs below $10k, 0.2% for AGIs $10k-25k, 0.2% for AGIs $25k-50k, 0.2% for AGIs $50k-75k, 0.2% for AGIs $75k-100k, 0.1% for AGIs over 100k)
Self-employed pension: $20,301 (reported on 1.1% of returns)
Here:
$20,301
North Carolina:
$14,754
(% of AGI for various income ranges: 0.1% for AGIs $25k-50k, 0.1% for AGIs $50k-75k, 0.2% for AGIs $75k-100k, 0.7% for AGIs over 100k)
Total itemized deductions: $23,870 (22% of AGI, reported on 39.6% of returns)
Here:
$23,870
State:
$19,464
Here:
22.1% of AGI
State:
22.7% of AGI
(% of AGI for various income ranges: 41.4% for AGIs below $10k, 10.8% for AGIs $10k-25k, 16.1% for AGIs $25k-50k, 18.2% for AGIs $50k-75k, 19.5% for AGIs $75k-100k, 16.7% for AGIs over 100k)
Charity contributions deductions: $6,258 (5% of AGI, reported on 35.2% of returns)
Here:
$6,258
State:
$4,035
Here:
5.4% of AGI
State:
4.5% of AGI
(% of AGI for various income ranges: 1.9% for AGIs below $10k, 1.3% for AGIs $10k-25k, 2.2% for AGIs $25k-50k, 2.9% for AGIs $50k-75k, 3.0% for AGIs $75k-100k, 5.4% for AGIs over 100k)
Total tax: $10,189 (reported on 75.0% of returns)
28405:
$10,189
State:
$7,257
(% of AGI for various income ranges: 6.2% for AGIs below $10k, 4.1% for AGIs $10k-25k, 7.2% for AGIs $25k-50k, 9.0% for AGIs $50k-75k, 10.4% for AGIs $75k-100k, 19.1% for AGIs over 100k)
Earned income credit: $1,775 (reported on 15.8% of returns)
Here:
$1,775
State:
$1,851
Percentage of individuals using paid preparers for their 2004 taxes: 55.4%
Here:
55%
State:
62%
(% for various income ranges: 49.0% for AGIs below $10k, 55.5% for AGIs $10k-25k, 53.0% for AGIs $25k-50k, 54.7% for AGIs $50k-75k, 61.9% for AGIs $75k-100k, 71.1% for AGIs over 100k)
Likely homosexual households (counted as self-reported same-sex unmarried-partner households)
Lesbian couples: 0.2% of all households
Gay men: 0.1% of all households
Household received Food Stamps/SNAP in the past 12 months: 2,030 Household did not receive Food Stamps/SNAP in the past 12 months: 13,572
Women who had a birth in the past 12 months: 195 (160 now married, 37 unmarried) Women who did not have a birth in the past 12 months: 8,102 (3,048 now married, 5,044 unmarried)
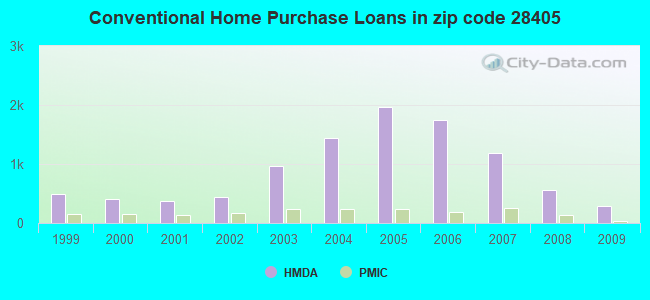
Housing units in zip code 28405 with a mortgage: 5,804 (528 second mortgage, 458 both second mortgage and home equity loan) Houses without a mortgage: 134
Median monthly owner costs for units with a mortgage: $1,503 Median monthly owner costs for units without a mortgage: $694
Residents with income below the poverty level in 2022:
This zip code:
14.7%
Whole state:
12.8%
Residents with income below 50% of the poverty level in 2022:
This zip code:
5.8%
Whole state:
6.8%
Median number of rooms in houses and condos:
Here:
6.4
State:
6.4
Median number of rooms in apartments:
Here:
4.3
State:
4.4
Notable locations in this zip code not listed on our city pages
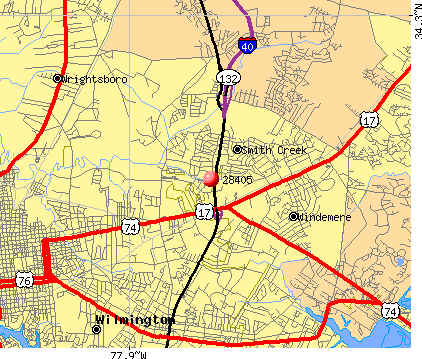
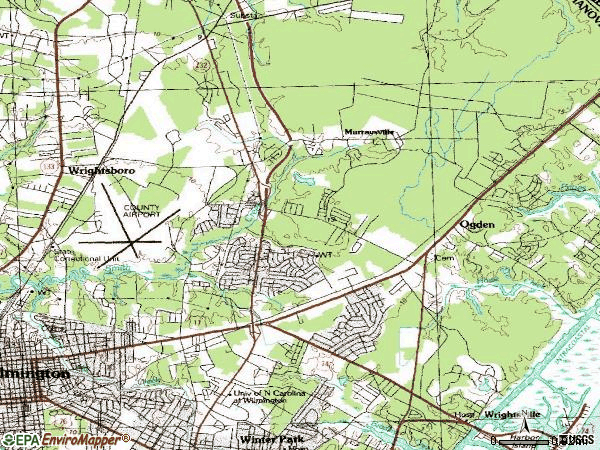
Notable locations in zip code 28405: Corporate Drive Industrial Park (A), North Chase Parkway Industrial Park (B), Inland Greens Golf Course (C), Britthaven of Wrightsville (D), Britthaven of North Chase (E), North Carolina State Highway Patrol (F), Pinnacle Special Police (G). Display/hide their locations on the map
Churches in zip code 28405 include: Emmanuel Associate Reformed Presbyterian Church (A), Ebenezer Missionary Baptist Church (B), Covenant Church (C), Cornerstone Baptist Church (D), Mount Hermon Missionary Baptist Church (E), Macedonia Missionary Baptist Church (F), Bible Church (G), Mount Holly Church (H), Saint Phillips Church (I). Display/hide their locations on the map
3,809 married couples with children.
1,920 single-parent households (153 men, 1,767 women).
92.8% of residents of 28405 zip code speak English at home.
5.0% of residents speak Spanish at home (60% very well, 25% well, 11% not well, 4% not at all).
1.8% of residents speak other Indo-European language at home (75% very well, 17% well, 8% not well).
0.3% of residents speak Asian or Pacific Island language at home (54% very well, 12% well, 34% not well).
0.1% of residents speak other language at home (41% very well, 59% well).
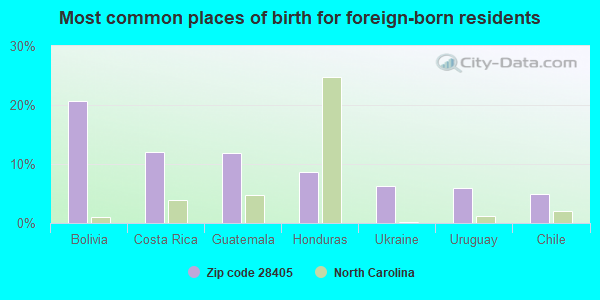
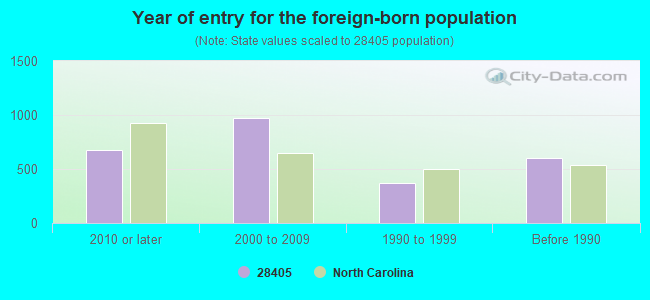
Foreign born population: 2,116 (6.0%) (42.1% of them are naturalized citizens)
Major facilities with environmental interests located in this zip code:
APPLIED ANALYTICAL LEARNING CENTER INC (1206 NORTH 23RD STREET in WILMINGTON, NC)
AIR MINOR (AIRS/AFS) STATE MASTER (North Carolina facility info) - AIR PROGRAM HAZARDOUS WASTE BIENNIAL REPORTER (Resource Conservation and Recovery Act (tracking hazardous waste)) Large Quantity Generators, more that 1000 kg of hazardous waste/month (Resource Conservation and Recovery Act (tracking hazardous waste)) - notification Large Quantity Generators, more that 1000 kg of hazardous waste/month (Resource Conservation and Recovery Act (tracking hazardous waste)) - notification Business SIC classification: PHARMACEUTICAL PREPARATIONS Business NAICS classification: PHARMACEUTICAL PREPARATION MANUFACTURING. Alternative names: APPLIED ANALYTICAL **INACTIVE**, APPLIED ANALYTICAL INDUSTRIES
APPLIED ANALYTICAL (1726 NORTH 23RD STREET in WILMINGTON, NC)
AIR MINOR (AIRS/AFS) STATE MASTER (North Carolina facility info) - AIR PROGRAM HAZARDOUS WASTE BIENNIAL REPORTER (Resource Conservation and Recovery Act (tracking hazardous waste)) Large Quantity Generators, more that 1000 kg of hazardous waste/month (Resource Conservation and Recovery Act (tracking hazardous waste)) - notification Business SIC classification: PHARMACEUTICAL PREPARATIONS; COMMERCIAL PHYSICAL AND BIOLOGICAL RESEARCH Business NAICS classification: PHARMACEUTICAL PREPARATION MANUFACTURING.; PHARMACEUTICAL PREPARATION MANUFACTURING. Organizations: AAIPHARMA (CONTACT/OPERATOR)
Alternative names: APPLIED ANALYTICAL **INACTIVE**
BENCHMARK HMF (2501 NORTHCHASE PARKWAY SE in WILMINGTON, NC)
AIR MINOR (AIRS/AFS) STATE MASTER (North Carolina facility info) - AIR PROGRAM Small Quantity Generators, between 100 kg and 1000 kg of hazardous waste/month (Resource Conservation and Recovery Act (tracking hazardous waste)) Business SIC classification: METAL DOORS, SASH, FRAMES, MOLDING, AND TRIM Business NAICS classification: METAL WINDOW AND DOOR MANUFACTURING. Organizations: THERMA TRU CORP. (CONTACT/OPERATOR)
Alternative names: THERMA TRU BENCHMARK HMF
AMERICAN DISTILLATION CO INC (220 OLD DAIRY RD. in WILMINGTON, NC)
STATE MASTER (North Carolina facility info) - -115DA4YG00M29W84AX3YG6TGEH, WASTEWATER FACILITY National Pollutant Discharge Elimination System NON-MAJOR (Tracking pollutant discharge elimination systems) - permit Business SIC classification: INDUSTRIAL ORGANIC CHEMICALS
ANALYTICAL PERSPECTIVES (2714 EXCHANGE DR in WILMINGTON, NC)
STATE MASTER (New Jersey environmental info) - NJEMS-NC005, LAB CERTIFICATION - COMMERCIAL ENVIRONMENTAL LAB Conditionally Exempt Small Quantity Generators, less than 100 kg/month of hazardous waste (Resource Conservation and Recovery Act (tracking hazardous waste)) - notification Business SIC classification: TESTING LABORATORIES Alternative names: ALTA ANALYTICAL PERSPECTIVES
CAPE FEAR TOYOTA. INCORPORATED (5640 MARKET STREET in WILMINGTON, NC)
STATE MASTER (North Carolina facility info) - UNDERGROUND STORAGE TANK PROGRAM Small Quantity Generators, between 100 kg and 1000 kg of hazardous waste/month (Resource Conservation and Recovery Act (tracking hazardous waste)) - notification Business SIC classification: NONCLASSIFIABLE ESTABLISHMENTS Organizations: STEAVE JACOBS (CONTACT/OWNER)
Alternative names: TOYOTA OF WILMINGTON
DR HUBERT EATON SR ELEM (6701 GORDON ROAD in WILMINGTON, NC)
(National Center for Education Statistics) - STATE ID-353 Organizations: NEW HANOVER COUNTY SCHOOLS (SCHOOL DISTRICT)
BENNETTE BROTHERS YACHTS (8118 MARKET STREET in WILMINGTON, NC)
(Resource Conservation and Recovery Act (tracking hazardous waste)) Organizations: PAUL BENNETT (CONTACT/OWNER)
CASE POWER & EQUIPMENT (5935 MARKET ST in WILMINGTON, NC)
(Resource Conservation and Recovery Act (tracking hazardous waste)) Organizations: J I CASE COMPANY (CONTACT/OWNER)
AAIPHARMA INC (1726 NO 23RD ST in WILMINGTON, NC)
National Pollutant Discharge Elimination System NON-MAJOR (Tracking pollutant discharge elimination systems) - permit Business SIC classification: PHARMACEUTICAL PREPARATIONS
CAROLINA COAST COLLISION (6711 AMSTERDAM WAY in WILMINGTON, NC)
(Resource Conservation and Recovery Act (tracking hazardous waste))
AAI (2320 SCIENTIFIC PARK DR in WILMINGTON, NC)
Conditionally Exempt Small Quantity Generators, less than 100 kg/month of hazardous waste (Resource Conservation and Recovery Act (tracking hazardous waste)) - notification
BELLSOUTH TELECOMMUNICATIONS (2500 COLLEGE RD in WILMINGTON, NC)
Conditionally Exempt Small Quantity Generators, less than 100 kg/month of hazardous waste (Resource Conservation and Recovery Act (tracking hazardous waste)) - notification Organizations: LEASE PROPERTIES INC (CONTACT/OWNER)
Housing units lacking complete plumbing facilities: 0.6% Housing units lacking complete kitchen facilities: 0.4%
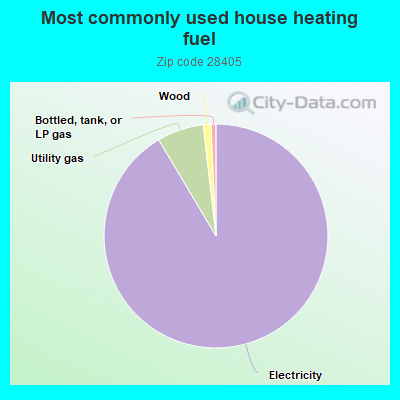
91.0%Electricity
6.7%Utility gas
1.1%Wood
0.7%Bottled, tank, or LP gas
Population in 1990: 26,744.
Place of birth for U.S.-born residents:
This state: 17,463
Northeast: 4,607
Midwest: 2,691
South: 6,330
West: 1,407
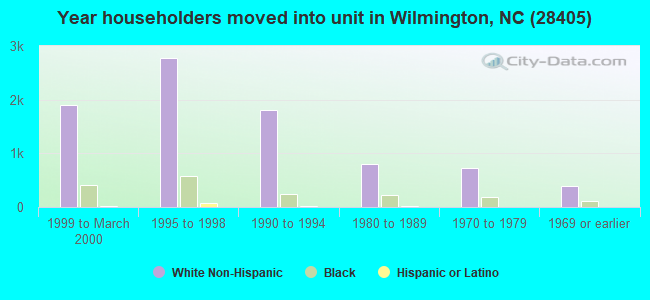
50% of the 28405 zip code residents lived in the same house 5 years ago. Out of people who lived in different houses, 44% lived in this county. Out of people who lived in different counties, 50% lived in North Carolina.
88% of the 28405 zip code residents lived in the same house 1 year ago. Out of people who lived in different houses, 45% moved from this county. Out of people who lived in different houses, 25% moved from different county within same state. Out of people who lived in different houses, 26% moved from different state. Out of people who lived in different houses, 2% moved from abroad.
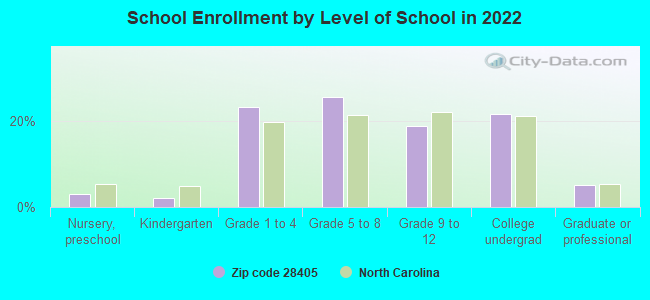
Private vs. public school enrollment:
Students in private schools in grades 1 to 8 (elementary and middle school): 648
Here:
16.9%
North Carolina:
13.8%
Students in private schools in grades 9 to 12 (high school): 269
Here:
18.1%
North Carolina:
11.9%
Students in private undergraduate colleges: 131
Here:
7.7%
North Carolina:
19.3%
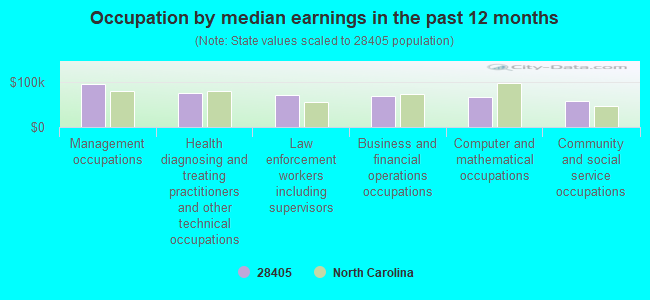
Occupation by median earnings in the past 12 months ($)
95,848Management occupations
75,129Health diagnosing and treating practitioners and other technical occupations
70,803Law enforcement workers including supervisors
68,004Business and financial operations occupations
67,929Computer and mathematical occupations
57,230Community and social service occupations
Companies with biggest federal contracts located in this zip code (WILMINGTON, NC):
SOUTHEASTERN AEP, INC (4553 TECHNOLOGY DRIVE, SUI) : $4,128,831 in 103 contractsfrom 2000 to 2006
Contracts for Other Architect and Engineering Services, Construction of Structures and Facilities -- Miscellaneous Buildings, Architect - Engineer Services (including landscaping, interior layout, and designing), Other Buildings, and moreby Army, Navy Signed by year:2000: $831,506; 2001: $389,863; 2002: $984,917; 2003: $814,372; 2004: $445,307; 2005: $580,967; 2006: $81,899.
Biggest contracts:
$446,789 with Army for Other Architect and Engineering Services. Signed on 2002-03-08. Completion date: 2002-06-19.
$191,480, same as above.Signed on 2002-07-01. Completion date: 2002-08-30.
$170,636, same as above.Signed on 2001-01-11. Completion date: 2001-05-23.
$166,545, same as above.Signed on 2003-03-07. Completion date: 2003-08-25.
AIR WILMINGTON INC (1831 HEWLETT DR; small business) : $1,608,816 in 4 contractsfrom 2002 to 2005
$1,174,376 with Defense Logistics Agency for Liquid Propellants and Fuels, Petroleum Base. Signed on 2005-03-15. Completion date: 2009-03-31.
$427,420, same as above.Signed on 2002-04-15. Completion date: 2005-03-31.
$7,020, same as above.Signed on 2005-09-01. Completion date: 2009-03-31.
$0, same as above.Signed on 2005-09-01. Completion date: 2009-03-31.
JOHNSON CONTROLS, INC (395 N GREEN MEADOWS DR; small business) : $1,480,771 in 21 contractsfrom 2002 to 2006
Contracts for Construction of Structures and Facilities -- Other Hospital Buildings, Maintenance, Repair or Alteration of Real Property -- Schools, Maintenance, Repair and Rebuilding of Equipment -- Miscellaneous, Maintenance, Repair or Alteration of Real Property -- Other Industrial Buildings, and moreby Navy, Army Signed by year:2000: $0; 2001: $0; 2002: $736,847; 2003: $245,500; 2004: $143,487; 2005: $345,243; 2006: $9,694.
Biggest contracts:
$736,847 with Navy for Construction of Structures and Facilities -- Other Hospital Buildings. Signed on 2002-11-07. Completion date: 2003-09-30.
$204,000 with Army for Maintenance, Repair or Alteration of Real Property -- Schools. Signed on 2003-12-16. Completion date: 2004-05-31.
$197,535 with Army for Maintenance, Repair and Rebuilding of Equipment -- Miscellaneous. Signed on 2005-05-12. Completion date: 2005-09-30.
$91,000, same as above.Signed on 2005-09-27. Completion date: 2005-12-30.
GRAYLYND INC (1519 NORTH 23RD STREET, SU; small business) : $1,106,870 in 15 contractsfrom 2003 to 2005
Contracts for Maintenance, Repair or Alteration of Real Property -- Open Storage Facilities, Maintenance, Repair or Alteration of Real Property -- Dining Facilities, Maintenance, Repair or Alteration of Real Property -- Other Administrative Facilities and Service Buildings, Maintenance, Repair or Alteration of Real Property -- Miscellaneous Buildings, and moreby Air Force, Army Signed by year:2000: $0; 2001: $0; 2002: $0; 2003: $167,288; 2004: $865,450; 2005: $74,132; 2006: $0.
Biggest contracts:
$699,490 with Air Force for Maintenance, Repair or Alteration of Real Property -- Open Storage Facilities. Signed on 2004-09-22. Completion date: 2005-05-12.
$119,860 with Air Force for Maintenance, Repair or Alteration of Real Property -- Dining Facilities. Signed on 2004-12-03. Completion date: 2005-07-31.
$78,790 with Air Force for Maintenance, Repair or Alteration of Real Property -- Other Administrative Facilities and Service Buildings. Signed on 2003-09-26. Completion date: 2003-11-14.
$77,583 with Army for Maintenance, Repair or Alteration of Real Property -- Miscellaneous Buildings. Signed on 2003-07-22. Completion date: 2003-09-30.
LEXXLE (1121 PEMBROKE JONES DR; small business) : $474,910 in 3 contractsfrom 2005 to 2006
$250,000 with Air Force for Other Defense -- Applied Research and Exploratory Development (R&D). Signed on 2006-04-13. Completion date: 2008-04-12.
$125,000, same as above.Signed on 2006-06-01. Completion date: 2008-04-12.
$99,910, same as above.Signed on 2005-04-11. Completion date: 2006-01-11.
P E HOOVER ENTERPISES INC (6411 AMSTERDAM WAY SUITE #; small business) : $413,043 in 12 contractsfrom 2002 to 2006
Contracts for Custodial Janitorial Services by U.S. Army Corps of Engineers - civil program financing only, Army, Navy Signed by year:2000: $0; 2001: $0; 2002: -$2,009; 2003: $70,210; 2004: $150,296; 2005: $133,800; 2006: $60,746.
Biggest contracts:
$75,148 with U.S. Army Corps of Engineers - civil program financing only for Custodial Janitorial Services. Taking place in SC. Signed on 2004-10-29. Completion date: 2003-12-31.
$75,148 with Army for Custodial Janitorial Services. Taking place in SC. Signed on 2004-10-29. Completion date: 2003-12-31.
$60,746, same as above.Signed on 2006-05-10. Completion date: 2005-12-31.
$60,000 with U.S. Army Corps of Engineers - civil program financing only for Custodial Janitorial Services. Taking place in SC. Signed on 2005-03-04. Completion date: 2005-12-31.
TECH POWER INC (2725 OLD WRIGHTSBORO DRIVE; small business) : $308,109 in 7 contractsfrom 2001 to 2005
Contracts for Converters, Electrical, Nonrotating, Wire and Cable, Electrical, Switches, Connectors, Electrical, and moreby Navy Signed by year:2000: $0; 2001: $37,020; 2002: $199,922; 2003: $0; 2004: $66,585; 2005: $4,582; 2006: $0.
Biggest contracts:
$66,585 with Navy for Converters, Electrical, Nonrotating. Signed on 2004-06-10. Completion date: 2004-07-18.
$58,661 with Navy for Wire and Cable, Electrical. Signed on 2002-06-18. Completion date: 2002-07-21.
$57,140 with Navy for Switches. Signed on 2002-07-29. Completion date: 2002-08-23.
$53,315 with Navy for Connectors, Electrical. Signed on 2002-11-27. Completion date: 2003-02-14.
INDUSTRIAL SALES CO , INC (2001 BLUECLAY ROAD; small business) : $261,722 in 13 contractsfrom 2000 to 2006
Contracts for Rigging and Rigging Gear, Pipe, Tube and Rigid Tubing, Plumbing Fixtures and Accessories by Army, U.S. Army Corps of Engineers - civil program financing only, Navy Signed by year:2000: $147,000; 2001: $0; 2002: $0; 2003: $0; 2004: $14,717; 2005: $69,745; 2006: $30,260.
Biggest contracts:
$73,500 with Army for Rigging and Rigging Gear. Signed on 2000-11-29. Completion date: 2000-12-15.
$73,500, same as above.Signed on 2000-09-26. Completion date: 2000-09-21.
$30,260 with Army for Pipe, Tube and Rigid Tubing. Signed on 2006-04-05. Completion date: 2006-04-18.
$21,660, same as above.Signed on 2005-03-24. Completion date: 2005-04-01.
NEWELL DAVIS COMPANY, INC (2962 N KERR AVE; small business) : $226,125 in 27 contractsfrom 2001 to 2006
Contracts for Rigging and Rigging Gear, Miscellaneous Materials Handling Equipment, Structural Shapes, Packaging and Packing Bulk Materials, and moreby Army, Navy Signed by year:2000: $0; 2001: $75,348; 2002: $3,208; 2003: $68,967; 2004: $26,880; 2005: $23,685; 2006: $28,037.
Biggest contracts:
$75,348 with Army for Rigging and Rigging Gear. Signed on 2001-01-29. Completion date: 2000-12-15.
$38,008 with Navy for Miscellaneous Materials Handling Equipment. Signed on 2003-06-25. Completion date: 2003-09-05.
$25,618 with Navy for Structural Shapes. Signed on 2004-09-22. Completion date: 2004-11-12.
$17,446 with Army for Packaging and Packing Bulk Materials. Signed on 2003-11-04. Completion date: 2003-10-23.
ISO AERO SERVICE, INC (1410 N KERR AVE; small business) : $186,155 in 4 contractsfrom 2000 to 2005
$182,095 with Defense Logistics Agency for Liquid Propellants and Fuels, Petroleum Base. Signed on 2000-07-20. Completion date: 2000-07-25.
$4,650 with Navy for Other Wildlife Management Services. Signed on 2005-05-11. Completion date: 2005-05-29.
$0 with Defense Logistics Agency for Liquid Propellants and Fuels, Petroleum Base. Signed on 2000-07-20. Completion date: 2000-07-25.
-$590 with Navy for Other Wildlife Management Services. Signed on 2005-06-03. Completion date: 2005-06-03.
Top industries in this zip code by the number of employees in 2005:
Professional, Scientific, and Technical Services: Research and Development in the Physical, Engineering, and Life Sciences (250-499: 1, 100-249: 1, 50-99: 1, 10-19: 1, 1-4: 1)
2002 - 2018 National Fire Incident Reporting System (NFIRS) incidents
According to the data from the years 2002 - 2018 the average number of fires per year is 138. The highest number of reported fire incidents - 260 took place in 2007, and the least - 79 in 2002. The data has a growing trend.
When looking into fire subcategories, the most reports belonged to: Outside Fires (45.6%), and Structure Fires (37.6%).
Fire incident types reported to NFIRS in Zip Code 28405

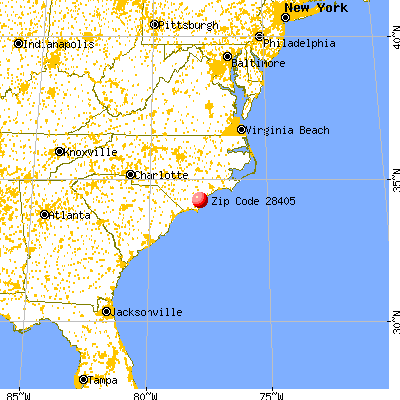


 Nearest zip codes: 28403, 28480, 28411, 28429, 28401, 28409.


 According to the data from the years 2002 - 2018 the average number of fires per year is 138. The highest number of reported fire incidents - 260 took place in 2007, and the least - 79 in 2002. The data has a growing trend.
 When looking into fire subcategories, the most reports belonged to: Outside Fires (45.6%), and Structure Fires (37.6%).