Estimated zip code population in 2022: 21,167 Zip code population in 2010: 20,041 Zip code population in 2000: 17,116
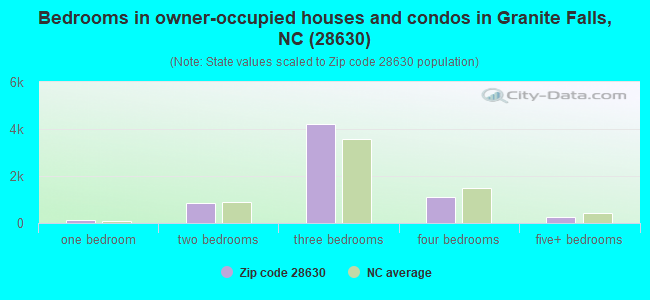
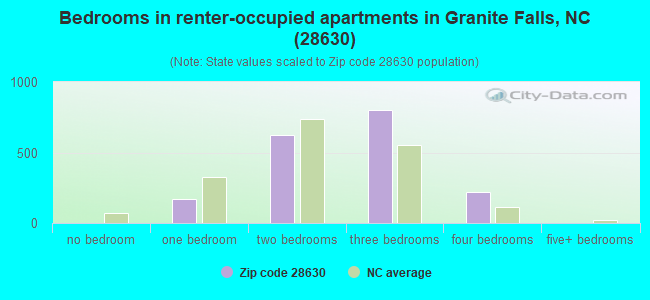
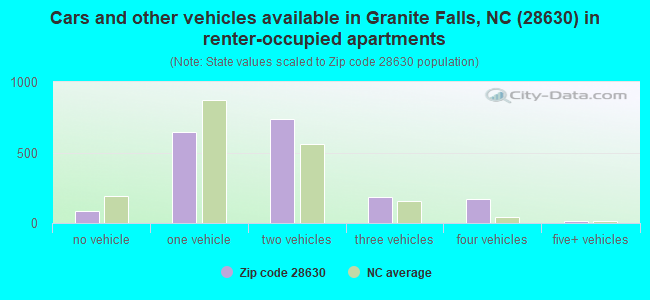
Houses and condos: 9,572 Renter-occupied apartments: 1,818
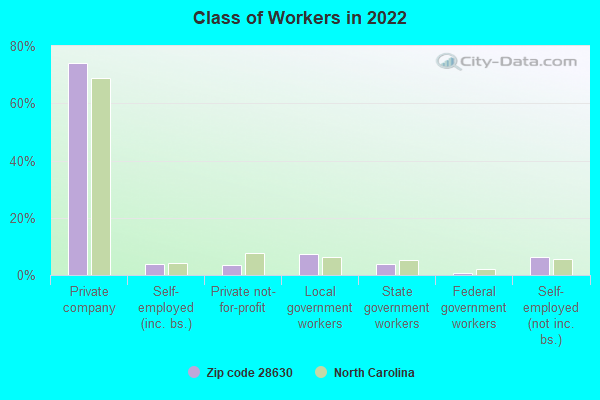
% of renters here:
22%
State:
33%
March 2022 cost of living index in zip code 28630: 86.1 (less than average, U.S. average is 100)
Land area: 60.0 sq. mi. Water area: 2.1 sq. mi.
Population density: 353 people per square mile
(very low).
OSM Map
General Map
Google Map
MSN Map
OSM Map
General Map
Google Map
MSN Map
OSM Map
General Map
Google Map
MSN Map
OSM Map
General Map
Google Map
MSN Map
Please wait while loading the map...
Real estate property taxes paid for housing units in 2022:
This zip code:
0.6% ($1,252)
North Carolina:
0.6% ($1,769)
Median real estate property taxes paid for housing units with mortgages in 2022: $1,379 (0.5%) Median real estate property taxes paid for housing units with no mortgage in 2022: $982 (0.6%)
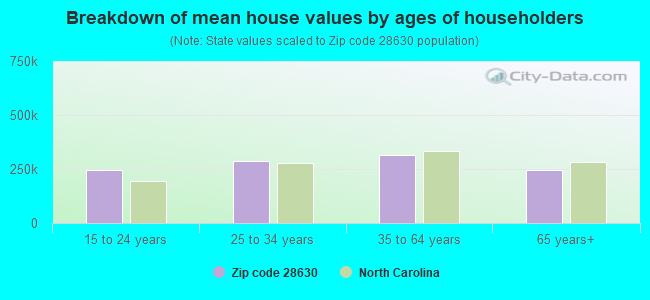
Estimated median house/condo value in 2022: $220,872
28630:
$220,872
North Carolina:
$280,600
According to our research of North Carolina and other state lists, there were 40 registered sex offenders living in 28630 zip code as of April 26, 2024. The ratio of all residents to sex offenders in zip code 28630 is 513 to 1. The ratio of registered sex offenders to all residents in this zip code is near the state average.
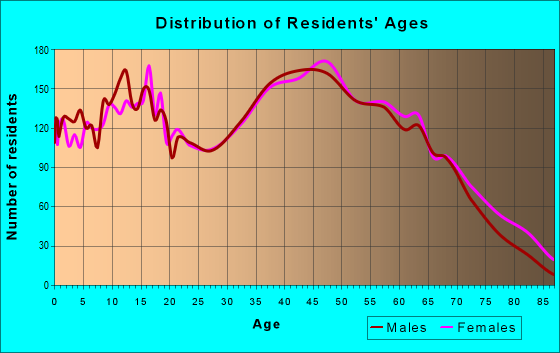
Median resident age:
This zip code:
45.7 years
North Carolina median age:
39.2 years
Average household size:
This zip code:
2.5 people
North Carolina:
2.4 people
Averages for the 2020 tax year for zip code 28630, filed in 2021:
Average Adjusted Gross Income (AGI) in 2020: $56,215 (Individual Income Tax Returns)
Here:
$56,215
State:
$70,020
Salary/wage: $47,333 (reported on 84.7% of returns)
Here:
$47,333
State:
$58,387
(% of AGI for various income ranges: 1138.5% for AGIs below $25k, 3701.5% for AGIs $25k-50k, 6763.5% for AGIs $50k-75k, 9321.7% for AGIs $75k-100k, 16329.8% for AGIs $100k-200k, 64947.1% for AGIs over 200k)
Taxable interest for individuals: $1,198 (reported on 26.7% of returns)
This zip code:
$1,198
North Carolina:
$1,479
(% of AGI for various income ranges: 8.4% for AGIs below $25k, 9.5% for AGIs $25k-50k, 28.9% for AGIs $50k-75k, 64.3% for AGIs $75k-100k, 128.9% for AGIs $100k-200k, 1560.0% for AGIs over 200k)
Ordinary dividends: $4,764 (reported on 12.0% of returns)
Here:
$4,764
State:
$7,888
(% of AGI for various income ranges: 14.3% for AGIs below $25k, 19.1% for AGIs $25k-50k, 42.3% for AGIs $50k-75k, 93.6% for AGIs $75k-100k, 289.1% for AGIs $100k-200k, 2594.3% for AGIs over 200k)
Net capital gain/loss in AGI: +$14,372 (reported on 10.8% of returns)
Here:
+$14,372
State:
+$23,652
(% of AGI for various income ranges: 4.2% for AGIs below $25k, 21.7% for AGIs $25k-50k, 50.4% for AGIs $50k-75k, 131.6% for AGIs $75k-100k, 450.6% for AGIs $100k-200k, 13678.6% for AGIs over 200k)
Profit/loss from business: +$11,099 (reported on 14.0% of returns)
Here:
+$11,099
State:
+$11,710
(% of AGI for various income ranges: 115.9% for AGIs below $25k, 94.1% for AGIs $25k-50k, 195.4% for AGIs $50k-75k, 346.6% for AGIs $75k-100k, 514.3% for AGIs $100k-200k, 3548.6% for AGIs over 200k)
Taxable individual retirement arrangement distribution: $15,297 (reported on 8.9% of returns)
28630:
$15,297
North Carolina:
$20,247
(% of AGI for various income ranges: 66.7% for AGIs below $25k, 92.3% for AGIs $25k-50k, 165.6% for AGIs $50k-75k, 260.7% for AGIs $75k-100k, 642.2% for AGIs $100k-200k, 2964.3% for AGIs over 200k)
Total itemized deductions: $34,462 (reported on 4.7% of returns)
Here:
$34,462
State:
$34,549
(% of AGI for various income ranges: 29.2% for AGIs below $25k, 37.8% for AGIs $25k-50k, 129.8% for AGIs $50k-75k, 253.1% for AGIs $75k-100k, 842.4% for AGIs $100k-200k, 8232.9% for AGIs over 200k)
Charity contributions: $15,331 (reported on 4.1% of returns)
Here:
$15,331
State:
$13,360
(% of AGI for various income ranges: 8.7% for AGIs $25k-50k, 38.4% for AGIs $50k-75k, 59.7% for AGIs $75k-100k, 271.5% for AGIs $100k-200k, 4517.1% for AGIs over 200k)
Taxes paid: $7,463 (reported on 4.6% of returns)
28630:
$7,463
State:
$7,586
(% of AGI for various income ranges: 2.8% for AGIs below $25k, 5.6% for AGIs $25k-50k, 25.1% for AGIs $50k-75k, 48.8% for AGIs $75k-100k, 229.1% for AGIs $100k-200k, 1602.9% for AGIs over 200k)
Earned income credit: $2,189 (reported on 19.2% of returns)
Here:
$2,189
State:
$2,337
(% of AGI for various income ranges: 96.5% for AGIs below $25k, 70.9% for AGIs $25k-50k, 1.6% for AGIs $50k-75k)
Percentage of individuals using paid preparers for their 2020 taxes: 94.0%
Here:
94%
State:
93%
(% for various income ranges: 93.8% for AGIs below $25k, 94.1% for AGIs $25k-50k, 93.8% for AGIs $50k-75k, 93.8% for AGIs $75k-100k, 94.5% for AGIs $100k-200k, 95.5% for AGIs over 200k)
Averages for the 2012 tax year for zip code 28630, filed in 2013:
Average Adjusted Gross Income (AGI) in 2012: $44,738 (Individual Income Tax Returns)
Here:
$44,738
State:
$54,937
Salary/wage: $38,379 (reported on 86.4% of returns)
Here:
$38,379
State:
$46,336
(% of AGI for various income ranges: 77.5% for AGIs below $25k, 83.1% for AGIs $25k-50k, 82.7% for AGIs $50k-75k, 79.6% for AGIs $75k-100k, 75.4% for AGIs $100k-200k, 40.9% for AGIs over 200k)
Taxable interest for individuals: $990 (reported on 29.7% of returns)
This zip code:
$990
North Carolina:
$1,298
(% of AGI for various income ranges: 0.7% for AGIs below $25k, 0.3% for AGIs $25k-50k, 0.6% for AGIs $50k-75k, 0.4% for AGIs $75k-100k, 1.0% for AGIs $100k-200k, 1.0% for AGIs over 200k)
Ordinary dividends: $3,202 (reported on 11.9% of returns)
Here:
$3,202
State:
$6,213
(% of AGI for various income ranges: 0.8% for AGIs below $25k, 0.4% for AGIs $25k-50k, 0.7% for AGIs $50k-75k, 0.6% for AGIs $75k-100k, 1.6% for AGIs $100k-200k, 1.2% for AGIs over 200k)
Net capital gain/loss in AGI: +$6,138 (reported on 8.0% of returns)
Here:
+$6,138
State:
+$12,740
(% of AGI for various income ranges: 0.4% for AGIs below $25k, 0.2% for AGIs $25k-50k, 0.3% for AGIs $50k-75k, 0.5% for AGIs $75k-100k, 1.8% for AGIs $100k-200k, 3.9% for AGIs over 200k)
Profit/loss from business: +$9,224 (reported on 15.0% of returns)
Here:
+$9,224
State:
+$10,311
(% of AGI for various income ranges: 6.2% for AGIs below $25k, 2.6% for AGIs $25k-50k, 2.0% for AGIs $50k-75k, 1.2% for AGIs $75k-100k, 2.3% for AGIs $100k-200k, 5.3% for AGIs over 200k)
Taxable individual retirement arrangement distribution: $11,576 (reported on 9.3% of returns)
28630:
$11,576
North Carolina:
$15,575
(% of AGI for various income ranges: 3.1% for AGIs below $25k, 2.4% for AGIs $25k-50k, 1.9% for AGIs $50k-75k, 3.0% for AGIs $75k-100k, 4.2% for AGIs $100k-200k)
Total itemized deductions: $20,716 (22% of AGI, reported on 26.2% of returns)
Here:
$20,716
State:
$23,438
Here:
22.2% of AGI
State:
21.5% of AGI
(% of AGI for various income ranges: 5.6% for AGIs below $25k, 8.6% for AGIs $25k-50k, 12.4% for AGIs $50k-75k, 15.3% for AGIs $75k-100k, 17.3% for AGIs $100k-200k, 13.5% for AGIs over 200k)
Charity contributions: $4,535 (reported on 21.3% of returns)
Here:
$4,535
State:
$4,687
(% of AGI for various income ranges: 0.6% for AGIs below $25k, 1.4% for AGIs $25k-50k, 2.4% for AGIs $50k-75k, 3.1% for AGIs $75k-100k, 3.9% for AGIs $100k-200k, 1.4% for AGIs over 200k)
Taxes paid: $6,575 (reported on 26.1% of returns)
28630:
$6,575
State:
$8,823
(% of AGI for various income ranges: 0.8% for AGIs below $25k, 1.9% for AGIs $25k-50k, 3.5% for AGIs $50k-75k, 5.0% for AGIs $75k-100k, 6.8% for AGIs $100k-200k, 5.1% for AGIs over 200k)
Earned income credit: $2,259 (reported on 24.0% of returns)
Here:
$2,259
State:
$2,376
(% of AGI for various income ranges: 7.3% for AGIs below $25k, 1.4% for AGIs $25k-50k)
Percentage of individuals using paid preparers for their 2012 taxes: 56.0%
Here:
56%
State:
53%
(% for various income ranges: 52.9% for AGIs below $25k, 55.0% for AGIs $25k-50k, 59.6% for AGIs $50k-75k, 61.3% for AGIs $75k-100k, 65.2% for AGIs $100k-200k, 66.7% for AGIs over 200k)
Averages for the 2004 tax year for zip code 28630, filed in 2005:
Average Adjusted Gross Income (AGI) in 2004: $37,905 (Individual Income Tax Returns)
Here:
$37,905
State:
$45,376
Salary/wage: $33,978 (reported on 90.0% of returns)
Here:
$33,978
State:
$39,442
(% of AGI for various income ranges: 108.2% for AGIs below $10k, 83.4% for AGIs $10k-25k, 86.9% for AGIs $25k-50k, 87.2% for AGIs $50k-75k, 85.7% for AGIs $75k-100k, 55.1% for AGIs over 100k)
Taxable interest for individuals: $968 (reported on 34.4% of returns)
This zip code:
$968
North Carolina:
$1,515
(% of AGI for various income ranges: 3.6% for AGIs below $10k, 1.1% for AGIs $10k-25k, 0.6% for AGIs $25k-50k, 0.5% for AGIs $50k-75k, 0.4% for AGIs $75k-100k, 1.9% for AGIs over 100k)
Taxable dividends: $2,623 (reported on 13.3% of returns)
Here:
$2,623
State:
$4,016
(% of AGI for various income ranges: 1.7% for AGIs below $10k, 0.7% for AGIs $10k-25k, 0.4% for AGIs $25k-50k, 0.3% for AGIs $50k-75k, 0.4% for AGIs $75k-100k, 3.0% for AGIs over 100k)
Net capital gain/loss: +$6,060 (reported on 9.8% of returns)
Here:
+$6,060
State:
+$11,152
(% of AGI for various income ranges: -1.0% for AGIs below $10k, 0.2% for AGIs $10k-25k, 0.4% for AGIs $25k-50k, 0.5% for AGIs $50k-75k, 1.1% for AGIs $75k-100k, 6.1% for AGIs over 100k)
Profit/loss from business: +$7,659 (reported on 15.6% of returns)
Here:
+$7,659
State:
+$9,490
(% of AGI for various income ranges: 2.2% for AGIs below $10k, 5.3% for AGIs $10k-25k, 3.0% for AGIs $25k-50k, 1.6% for AGIs $50k-75k, 1.7% for AGIs $75k-100k, 5.0% for AGIs over 100k)
IRA payment deduction: $2,886 (reported on 2.1% of returns)
28630:
$2,886
North Carolina:
$2,967
(% of AGI for various income ranges: 0.1% for AGIs $10k-25k, 0.2% for AGIs $25k-50k, 0.1% for AGIs $50k-75k, 0.2% for AGIs $75k-100k, 0.1% for AGIs over 100k)
Self-employed pension: $15,417 (reported on 0.3% of returns)
Here:
$15,417
North Carolina:
$14,754
Total itemized deductions: $16,745 (24% of AGI, reported on 30.6% of returns)
Here:
$16,745
State:
$19,464
Here:
24.3% of AGI
State:
22.7% of AGI
(% of AGI for various income ranges: 12.5% for AGIs below $10k, 6.4% for AGIs $10k-25k, 10.5% for AGIs $25k-50k, 14.9% for AGIs $50k-75k, 17.9% for AGIs $75k-100k, 18.0% for AGIs over 100k)
Charity contributions deductions: $4,335 (6% of AGI, reported on 25.1% of returns)
Here:
$4,335
State:
$4,035
Here:
5.9% of AGI
State:
4.5% of AGI
(% of AGI for various income ranges: 1.5% for AGIs below $10k, 1.0% for AGIs $10k-25k, 1.7% for AGIs $25k-50k, 2.8% for AGIs $50k-75k, 3.5% for AGIs $75k-100k, 5.6% for AGIs over 100k)
Total tax: $4,545 (reported on 74.4% of returns)
28630:
$4,545
State:
$7,257
(% of AGI for various income ranges: 3.4% for AGIs below $10k, 3.9% for AGIs $10k-25k, 6.2% for AGIs $25k-50k, 8.0% for AGIs $50k-75k, 9.5% for AGIs $75k-100k, 17.6% for AGIs over 100k)
Earned income credit: $1,722 (reported on 19.5% of returns)
Here:
$1,722
State:
$1,851
Percentage of individuals using paid preparers for their 2004 taxes: 66.5%
Here:
66%
State:
62%
(% for various income ranges: 60.1% for AGIs below $10k, 68.0% for AGIs $10k-25k, 67.5% for AGIs $25k-50k, 67.2% for AGIs $50k-75k, 66.5% for AGIs $75k-100k, 73.1% for AGIs over 100k)
Likely homosexual households (counted as self-reported same-sex unmarried-partner households)
Lesbian couples: 0.4% of all households
Gay men: 0.1% of all households
Household received Food Stamps/SNAP in the past 12 months: 951 Household did not receive Food Stamps/SNAP in the past 12 months: 7,357
Women who had a birth in the past 12 months: 142 (103 now married, 39 unmarried) Women who did not have a birth in the past 12 months: 3,984 (1,862 now married, 2,125 unmarried)
Housing units in zip code 28630 with a mortgage: 3,792 (382 second mortgage, 401 both second mortgage and home equity loan) Houses without a mortgage: 238
Median monthly owner costs for units with a mortgage: $1,133 Median monthly owner costs for units without a mortgage: $348
Residents with income below the poverty level in 2022:
This zip code:
12.0%
Whole state:
12.8%
Residents with income below 50% of the poverty level in 2022:
This zip code:
6.7%
Whole state:
6.8%
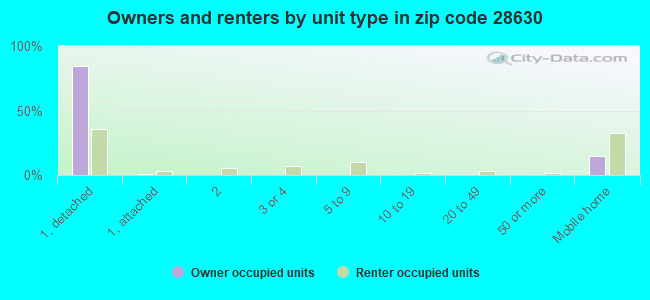
Median number of rooms in houses and condos:
Here:
6.1
State:
6.4
Median number of rooms in apartments:
Here:
4.8
State:
4.4
Notable locations in this zip code not listed on our city pages
Churches in zip code 28630 include: Clove Church (A), Lovelady Church (B), Mountain Grove Church (C), Oak Grove Church (D), Pooveys Grove Church (E), Temple Hill Church (F), Lovelady Church (G), Cajah Mountain Baptist Church (H), Concord Baptist Church (I). Display/hide their locations on the map
Streams, rivers, and creeks: Gunpowder Creek (A), Billy Branch (B), Stafford Creek (C), Silver Creek (D), Rock Creek (E), Pilot Branch (F), Morris Creek (G), Hayes Mill Creek (H), Freemason Creek (I). Display/hide their locations on the map
In group quarters: 129 (-1 institutionalized population)
Size of family households: 2,578 2-persons, 1,234 3-persons, 1,015 4-persons, 487 5-persons, 164 6-persons, 103 7-or-more-persons
Size of nonfamily households: 2,280 1-person, 332 2-persons, 119 3-persons
2,752 married couples with children.
1,095 single-parent households (375 men, 720 women).
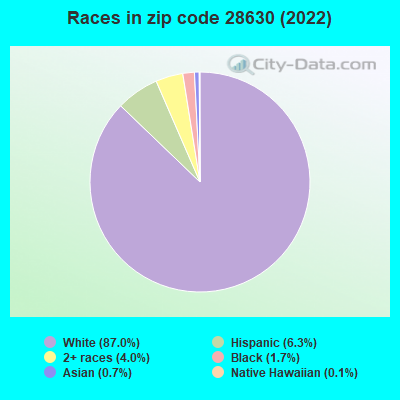
93.8% of residents of 28630 zip code speak English at home.
4.7% of residents speak Spanish at home (84% very well, 10% well, 5% not well).
1.0% of residents speak other Indo-European language at home (70% very well, 11% well, 19% not well).
0.4% of residents speak Asian or Pacific Island language at home (100% very well).
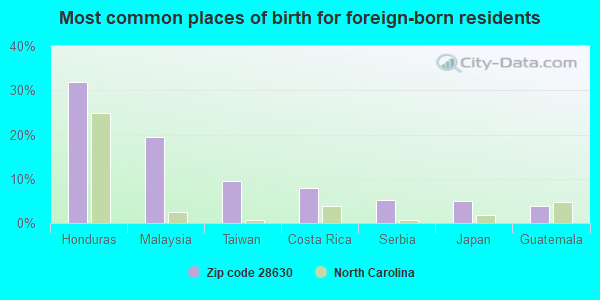
Foreign born population: 478 (2.3%) (62.4% of them are naturalized citizens)
This zip code:
2.3%
Whole state:
8.6%
32%Honduras
19%Malaysia
10%Taiwan
8%Costa Rica
5%Serbia
5%Japan
4%Guatemala
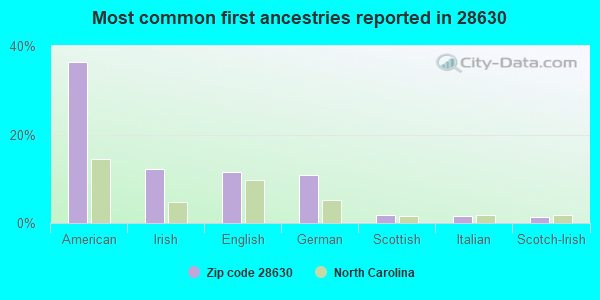
36%American
12%Irish
11%English
11%German
2%Scottish
1%Italian
1%Scotch-Irish
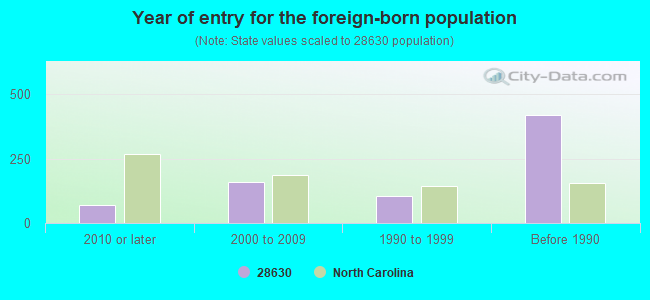
Year of entry for the foreign-born population
702010 or later
1612000 to 2009
1041990 to 1999
419Before 1990
Facilities with environmental interests located in this zip code:
DUDLEY SHOALS ELEMENTARY SCHOOL (1500 DUDLEY SHOALS ROAD in GRANITE FALLS, NC)
STATE MASTER (North Carolina facility info) - UNDERGROUND STORAGE TANK PROGRAM (National Center for Education Statistics) - STATE ID-316 Business SIC classification: NONCLASSIFIABLE ESTABLISHMENTS Organizations: CALDWELL COUNTY SCHOOLS (SCHOOL DISTRICT)
ALLEN BECK INDUSTRIES INCORPORATED (3305 KELLINA LANE HWY 321 N in GRANITE FALLS, NC)
AIR MINOR (AIRS/AFS) STATE MASTER (North Carolina facility info) - UNDERGROUND STORAGE TANK PROGRAM, AIR PROGRAM TRI REPORTER (Tracking of toxic chemicals releasing facilities) Business SIC classification: PLASTICS FOAM PRODUCTS; NONCLASSIFIABLE ESTABLISHMENTS
AUTUMN HOUSE INCORPORATED (1206 PREMIERE RD in GRANITE FALLS, NC)
AIR MINOR (AIRS/AFS) STATE MASTER (North Carolina facility info) - AIR PROGRAM Business SIC and NAICS classification: HARDWOOD VENEER AND PLYWOOD
BURNS WOOD PRODUCTS INCORPORATED (CEDAR VALLEY ROAD in GRANITE FALLS, NC)
AIR MINOR (AIRS/AFS) STATE MASTER (North Carolina facility info) - AIR PROGRAM Business SIC and NAICS classification: HARDWOOD VENEER AND PLYWOOD
CNC WOOD TECHNOLOGY INCORPORATED (361 WEBB-PRICE RD in GRANITE FALLS, NC)
AIR MINOR (AIRS/AFS) STATE MASTER (North Carolina facility info) - AIR PROGRAM Business SIC classification: HARDWOOD DIMENSION AND FLOORING MILLS; WOOD HOUSEHOLD FURNITURE, EXCEPT UPHOLSTERED
CAMBRIDGE CHAIR COMPANY ** INACTIVE ** (36 DUDLEY AVENUE in GRANITE FALLS, NC)
AIR MINOR (AIRS/AFS) (Resource Conservation and Recovery Act (tracking hazardous waste)) Business SIC classification: WOOD HOUSEHOLD FURNITURE, EXCEPT UPHOLSTERED Organizations: CAMBRIDGE CHAIR LLC (CONTACT/OWNER)
ASSOCIATED HARDWOOD PRODUCTS (HIGHWAY 321A NORTH in GRANITE FALLS, NC)
AIR SYNTHETIC MINOR (AIRS/AFS) STATE MASTER (North Carolina facility info) - AIR PROGRAM Business SIC classification: HARDWOOD DIMENSION AND FLOORING MILLS Business NAICS classification: CUT STOCK, RESAWING LUMBER, AND PLANING.
ARCONA LEATHER COMPANY (1370 MISSION RD in SAWMILLS, NC)
(Resource Conservation and Recovery Act (tracking hazardous waste))
CALDWELL COUNTY-SMALL MS4 (30 FALLS AVE in GRANITE FALLS, NC)
National Pollutant Discharge Elimination System NON-MAJOR (Tracking pollutant discharge elimination systems) - permit Alternative names: CO OF CALDWELL CALDWELL CO SMA
Housing units lacking complete plumbing facilities: 2.6% Housing units lacking complete kitchen facilities: 2.5%
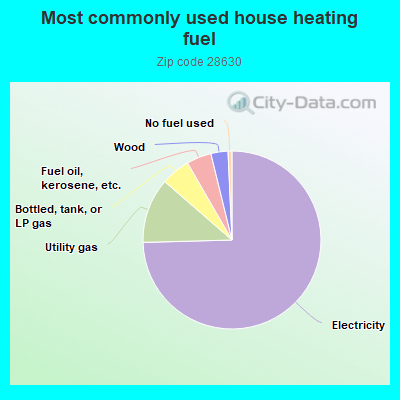
74.5%Electricity
11.8%Utility gas
5.3%Bottled, tank, or LP gas
4.5%Fuel oil, kerosene, etc.
3.1%Wood
0.7%No fuel used
Population in 1990: 17,749.
Place of birth for U.S.-born residents:
This state: 16,290
Northeast: 826
Midwest: 465
South: 1,691
West: 855
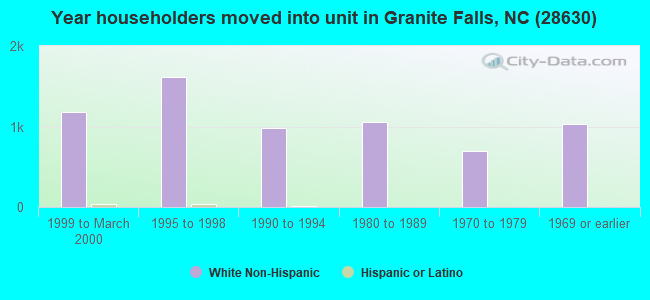
59% of the 28630 zip code residents lived in the same house 5 years ago. Out of people who lived in different houses, 62% lived in this county. Out of people who lived in different counties, 50% lived in North Carolina.
93% of the 28630 zip code residents lived in the same house 1 year ago. Out of people who lived in different houses, 45% moved from this county. Out of people who lived in different houses, 42% moved from different county within same state. Out of people who lived in different houses, 16% moved from different state. Out of people who lived in different houses, 2% moved from abroad.
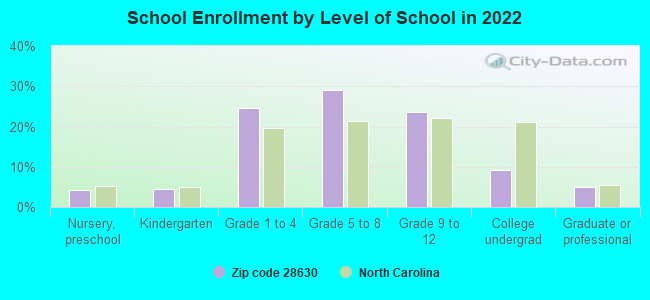
Private vs. public school enrollment:
Students in private schools in grades 1 to 8 (elementary and middle school): 240
Here:
11.2%
North Carolina:
13.8%
Students in private schools in grades 9 to 12 (high school): 84
Here:
9.0%
North Carolina:
11.9%
Students in private undergraduate colleges: 41
Here:
11.2%
North Carolina:
19.3%
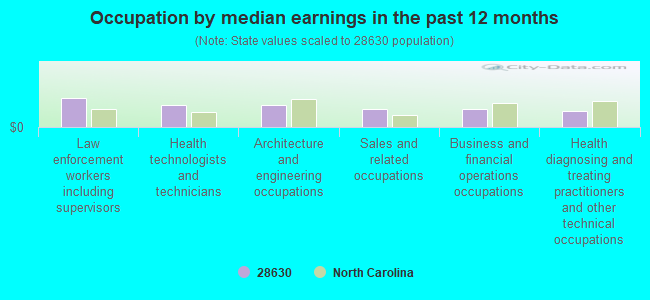
Occupation by median earnings in the past 12 months ($)
103,204Law enforcement workers including supervisors
75,932Health technologists and technicians
75,718Architecture and engineering occupations
63,942Sales and related occupations
63,060Business and financial operations occupations
55,720Health diagnosing and treating practitioners and other technical occupations
Companies with federal contracts located in this zip code:
WHITE FOX CONSTRUCTION CO INC (1761 MORRIS CREEK ROAD in GRANITE FALLS, NC; small business) : $409,485 in 5 contractsfrom 2003 to 2005
Contracts for Construction of Structures and Facilities -- Sewage and Waste Facilities, Construction of Structures and Facilities -- Miscellaneous Buildings, Other Management Support Services by Forest Service, Air Force Signed by year:2000: $0; 2001: $0; 2002: $0; 2003: $267,958; 2004: $132,537; 2005: $8,990; 2006: $0.
Biggest contracts:
$132,624 with Forest Service for Construction of Structures and Facilities -- Sewage and Waste Facilities. Signed on 2003-06-15. Completion date: 2003-09-15.
$132,624, same as above.Signed on 2003-06-15. Completion date: 2003-09-15.
$132,537 with Forest Service for Construction of Structures and Facilities -- Miscellaneous Buildings. Signed on 2004-04-02. Completion date: 2004-08-01.
$8,990 with Air Force for Other Management Support Services. Taking place in AK. Signed on 2005-09-22. Completion date: 2005-09-30.
DOCUMENT MANAGEMENT, INC (4012 HICKORY BLVD in GRANITE FALLS, NC; small business) : $77,943 in 48 contractsfrom 2002 to 2004
Contracts for Stationery and Record Forms, Office Supplies by Federal Supply Service, Army Signed by year:2000: $0; 2001: $0; 2002: $10,668; 2003: $64,275; 2004: $3,000; 2005: $0; 2006: $0.
Biggest contracts:
$11,180 with Federal Supply Service for Stationery and Record Forms. Signed on 2003-03-15. Completion date: 2003-04-15.
$6,321, same as above.Signed on 2003-03-15. Completion date: 2003-04-15.
$6,072, same as above.Signed on 2003-09-15. Completion date: 2003-10-15.
$4,692, same as above.Signed on 2003-03-15. Completion date: 2003-04-15.
Top industries in this zip code by the number of employees in 2005:
Health Care and Social Assistance: Nursing Care Facilities (100-249 employees: 1 establishment)
Other Services (except Public Administration): Religious Organizations (20-49: 2, 5-9: 9, 1-4: 7)
2002 - 2018 National Fire Incident Reporting System (NFIRS) incidents
According to the data from the years 2002 - 2018 the average number of fire incidents per year is 85. The highest number of reported fire incidents - 139 took place in 2014, and the least - 21 in 2005. The data has a growing trend.
When looking into fire subcategories, the most reports belonged to: Structure Fires (44.4%), and Outside Fires (40.9%).
Fire incident types reported to NFIRS in Zip Code 28630


 Nearest zip codes: 28667, 28638, 28637, 28601, 28666, 28671.
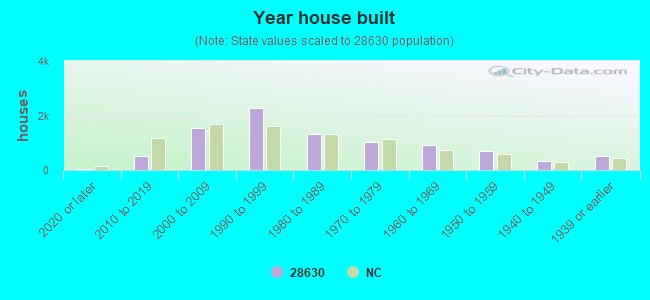


 According to the data from the years 2002 - 2018 the average number of fire incidents per year is 85. The highest number of reported fire incidents - 139 took place in 2014, and the least - 21 in 2005. The data has a growing trend.
 When looking into fire subcategories, the most reports belonged to: Structure Fires (44.4%), and Outside Fires (40.9%).