Estimated zip code population in 2022: 12,033 Zip code population in 2010: 10,381 Zip code population in 2000: 9,321
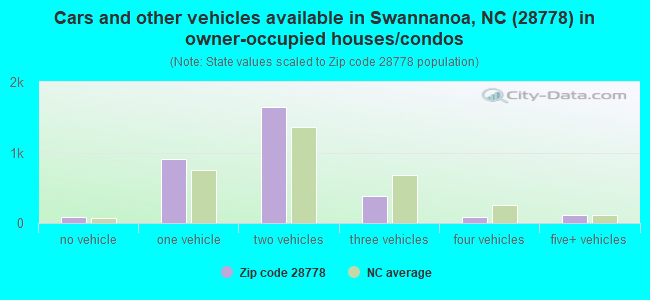
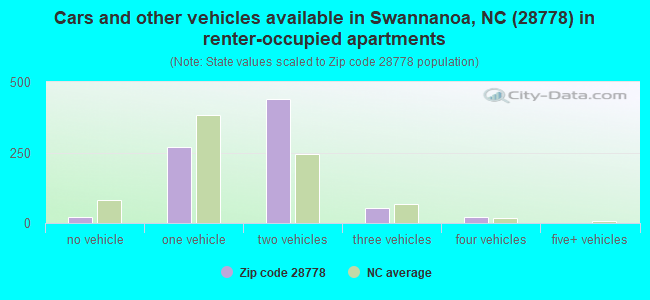
Houses and condos: 5,006 Renter-occupied apartments: 795
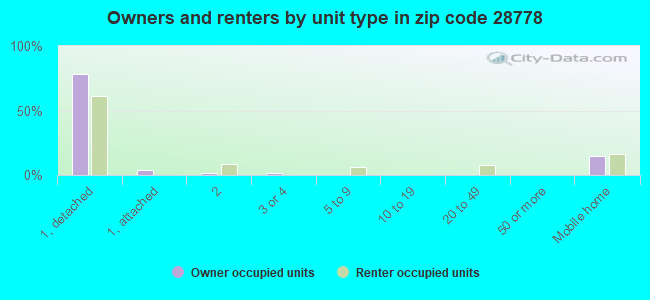
% of renters here:
20%
State:
33%
March 2022 cost of living index in zip code 28778: 90.0 (less than average, U.S. average is 100)
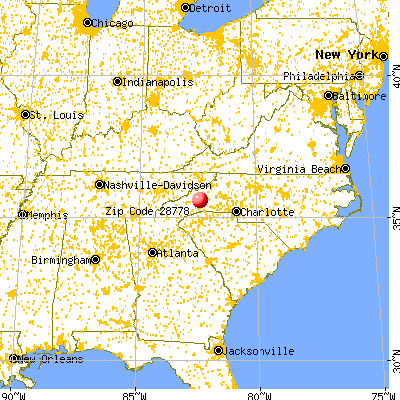
Land area: 34.4 sq. mi. Water area: 0.1 sq. mi.
Population density: 350 people per square mile
(very low).
OSM Map
General Map
Google Map
MSN Map
OSM Map
General Map
Google Map
MSN Map
OSM Map
General Map
Google Map
MSN Map
OSM Map
General Map
Google Map
MSN Map
Please wait while loading the map...
Real estate property taxes paid for housing units in 2022:
This zip code:
0.5% ($1,432)
North Carolina:
0.6% ($1,769)
Median real estate property taxes paid for housing units with mortgages in 2022: $1,452 (0.5%) Median real estate property taxes paid for housing units with no mortgage in 2022: $1,400 (0.6%)
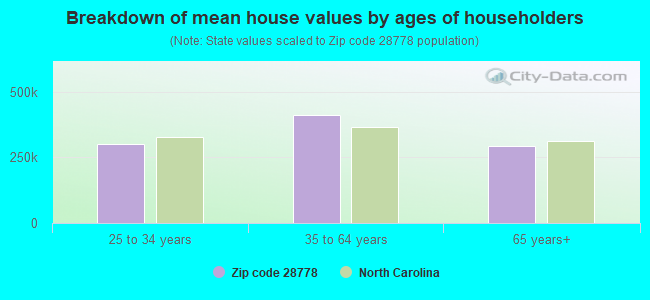
Estimated median house/condo value in 2022: $271,999
28778:
$271,999
North Carolina:
$280,600
According to our research of North Carolina and other state lists, there were 12 registered sex offenders living in 28778 zip code as of April 27, 2024. The ratio of all residents to sex offenders in zip code 28778 is 934 to 1. The ratio of registered sex offenders to all residents in this zip code is lower than the state average.
Median resident age:
This zip code:
42.0 years
North Carolina median age:
39.2 years
Average household size:
This zip code:
2.8 people
North Carolina:
2.4 people
Averages for the 2020 tax year for zip code 28778, filed in 2021:
Average Adjusted Gross Income (AGI) in 2020: $52,903 (Individual Income Tax Returns)
Here:
$52,903
State:
$70,020
Salary/wage: $43,835 (reported on 79.3% of returns)
Here:
$43,835
State:
$58,387
(% of AGI for various income ranges: 1130.4% for AGIs below $25k, 3644.9% for AGIs $25k-50k, 6862.6% for AGIs $50k-75k, 9259.3% for AGIs $75k-100k, 16624.1% for AGIs $100k-200k, 44462.5% for AGIs over 200k)
Taxable interest for individuals: $761 (reported on 30.8% of returns)
This zip code:
$761
North Carolina:
$1,479
(% of AGI for various income ranges: 17.5% for AGIs below $25k, 13.3% for AGIs $25k-50k, 37.2% for AGIs $50k-75k, 64.5% for AGIs $75k-100k, 95.9% for AGIs $100k-200k, 530.0% for AGIs over 200k)
Ordinary dividends: $3,985 (reported on 16.6% of returns)
Here:
$3,985
State:
$7,888
(% of AGI for various income ranges: 39.2% for AGIs below $25k, 38.0% for AGIs $25k-50k, 108.0% for AGIs $50k-75k, 138.3% for AGIs $75k-100k, 398.6% for AGIs $100k-200k, 1365.0% for AGIs over 200k)
Net capital gain/loss in AGI: +$9,626 (reported on 15.6% of returns)
Here:
+$9,626
State:
+$23,652
(% of AGI for various income ranges: 12.4% for AGIs below $25k, 42.2% for AGIs $25k-50k, 158.6% for AGIs $50k-75k, 132.4% for AGIs $75k-100k, 570.5% for AGIs $100k-200k, 10852.5% for AGIs over 200k)
Profit/loss from business: +$10,654 (reported on 19.1% of returns)
Here:
+$10,654
State:
+$11,710
(% of AGI for various income ranges: 198.1% for AGIs below $25k, 239.7% for AGIs $25k-50k, 312.6% for AGIs $50k-75k, 450.0% for AGIs $75k-100k, 546.8% for AGIs $100k-200k, 2055.0% for AGIs over 200k)
Taxable individual retirement arrangement distribution: $14,685 (reported on 9.3% of returns)
28778:
$14,685
North Carolina:
$20,247
(% of AGI for various income ranges: 80.3% for AGIs below $25k, 86.5% for AGIs $25k-50k, 164.4% for AGIs $50k-75k, 362.4% for AGIs $75k-100k, 1332.3% for AGIs $100k-200k)
Total itemized deductions: $37,239 (reported on 5.7% of returns)
Here:
$37,239
State:
$34,549
(% of AGI for various income ranges: 59.9% for AGIs below $25k, 103.9% for AGIs $25k-50k, 243.0% for AGIs $50k-75k, 338.6% for AGIs $75k-100k, 1132.3% for AGIs $100k-200k, 9555.0% for AGIs over 200k)
Charity contributions: $7,645 (reported on 4.5% of returns)
Here:
$7,645
State:
$13,360
(% of AGI for various income ranges: 14.6% for AGIs $25k-50k, 25.4% for AGIs $50k-75k, 59.3% for AGIs $75k-100k, 309.1% for AGIs $100k-200k, 1330.0% for AGIs over 200k)
Taxes paid: $6,207 (reported on 5.5% of returns)
28778:
$6,207
State:
$7,586
(% of AGI for various income ranges: 6.8% for AGIs below $25k, 11.9% for AGIs $25k-50k, 46.6% for AGIs $50k-75k, 83.1% for AGIs $75k-100k, 259.1% for AGIs $100k-200k, 1032.5% for AGIs over 200k)
Earned income credit: $2,032 (reported on 17.2% of returns)
Here:
$2,032
State:
$2,337
(% of AGI for various income ranges: 85.4% for AGIs below $25k, 62.2% for AGIs $25k-50k)
Percentage of individuals using paid preparers for their 2020 taxes: 94.3%
Here:
94%
State:
93%
(% for various income ranges: 91.8% for AGIs below $25k, 94.7% for AGIs $25k-50k, 96.0% for AGIs $50k-75k, 95.5% for AGIs $75k-100k, 97.6% for AGIs $100k-200k, 100.0% for AGIs over 200k)
Averages for the 2012 tax year for zip code 28778, filed in 2013:
Average Adjusted Gross Income (AGI) in 2012: $39,267 (Individual Income Tax Returns)
Here:
$39,267
State:
$54,937
Salary/wage: $34,586 (reported on 83.7% of returns)
Here:
$34,586
State:
$46,336
(% of AGI for various income ranges: 75.5% for AGIs below $25k, 79.9% for AGIs $25k-50k, 78.2% for AGIs $50k-75k, 73.9% for AGIs $75k-100k, 67.3% for AGIs $100k-200k, 48.0% for AGIs over 200k)
Taxable interest for individuals: $669 (reported on 31.5% of returns)
This zip code:
$669
North Carolina:
$1,298
(% of AGI for various income ranges: 1.0% for AGIs below $25k, 0.5% for AGIs $25k-50k, 0.4% for AGIs $50k-75k, 0.6% for AGIs $75k-100k, 0.5% for AGIs $100k-200k, 0.3% for AGIs over 200k)
Ordinary dividends: $3,628 (reported on 14.3% of returns)
Here:
$3,628
State:
$6,213
(% of AGI for various income ranges: 1.4% for AGIs below $25k, 0.8% for AGIs $25k-50k, 1.1% for AGIs $50k-75k, 0.8% for AGIs $75k-100k, 1.4% for AGIs $100k-200k, 4.4% for AGIs over 200k)
Net capital gain/loss in AGI: +$2,451 (reported on 11.4% of returns)
Here:
+$2,451
State:
+$12,740
(% of AGI for various income ranges: 0.3% for AGIs $25k-50k, 0.5% for AGIs $50k-75k, 0.2% for AGIs $75k-100k, 1.5% for AGIs $100k-200k, 3.8% for AGIs over 200k)
Profit/loss from business: +$7,114 (reported on 16.3% of returns)
Here:
+$7,114
State:
+$10,311
(% of AGI for various income ranges: 7.7% for AGIs below $25k, 3.0% for AGIs $25k-50k, 0.9% for AGIs $50k-75k, 2.3% for AGIs $75k-100k, 3.3% for AGIs $100k-200k)
Taxable individual retirement arrangement distribution: $13,180 (reported on 10.0% of returns)
28778:
$13,180
North Carolina:
$15,575
(% of AGI for various income ranges: 3.3% for AGIs below $25k, 2.8% for AGIs $25k-50k, 2.8% for AGIs $50k-75k, 3.1% for AGIs $75k-100k, 7.1% for AGIs $100k-200k)
Total itemized deductions: $18,990 (26% of AGI, reported on 25.9% of returns)
Here:
$18,990
State:
$23,438
Here:
25.9% of AGI
State:
21.5% of AGI
(% of AGI for various income ranges: 9.4% for AGIs below $25k, 9.3% for AGIs $25k-50k, 12.1% for AGIs $50k-75k, 15.8% for AGIs $75k-100k, 16.3% for AGIs $100k-200k, 16.4% for AGIs over 200k)
Charity contributions: $4,074 (reported on 21.4% of returns)
Here:
$4,074
State:
$4,687
(% of AGI for various income ranges: 0.9% for AGIs below $25k, 1.1% for AGIs $25k-50k, 1.8% for AGIs $50k-75k, 3.0% for AGIs $75k-100k, 3.4% for AGIs $100k-200k, 5.8% for AGIs over 200k)
Taxes paid: $5,481 (reported on 25.9% of returns)
28778:
$5,481
State:
$8,823
(% of AGI for various income ranges: 1.3% for AGIs below $25k, 2.0% for AGIs $25k-50k, 3.6% for AGIs $50k-75k, 4.7% for AGIs $75k-100k, 5.9% for AGIs $100k-200k, 6.9% for AGIs over 200k)
Earned income credit: $2,041 (reported on 21.9% of returns)
Here:
$2,041
State:
$2,376
(% of AGI for various income ranges: 5.8% for AGIs below $25k, 1.1% for AGIs $25k-50k)
Percentage of individuals using paid preparers for their 2012 taxes: 51.1%
Here:
51%
State:
53%
(% for various income ranges: 48.8% for AGIs below $25k, 49.2% for AGIs $25k-50k, 54.7% for AGIs $50k-75k, 54.8% for AGIs $75k-100k, 61.9% for AGIs $100k-200k, 100.0% for AGIs over 200k)
Averages for the 2004 tax year for zip code 28778, filed in 2005:
Average Adjusted Gross Income (AGI) in 2004: $32,891 (Individual Income Tax Returns)
Here:
$32,891
State:
$45,376
Salary/wage: $30,173 (reported on 85.0% of returns)
Here:
$30,173
State:
$39,442
(% of AGI for various income ranges: 98.1% for AGIs below $10k, 81.3% for AGIs $10k-25k, 84.1% for AGIs $25k-50k, 81.6% for AGIs $50k-75k, 72.1% for AGIs $75k-100k, 59.1% for AGIs over 100k)
Taxable interest for individuals: $1,120 (reported on 36.4% of returns)
This zip code:
$1,120
North Carolina:
$1,515
(% of AGI for various income ranges: 3.9% for AGIs below $10k, 1.3% for AGIs $10k-25k, 1.2% for AGIs $25k-50k, 0.8% for AGIs $50k-75k, 1.0% for AGIs $75k-100k, 1.7% for AGIs over 100k)
Taxable dividends: $2,172 (reported on 15.9% of returns)
Here:
$2,172
State:
$4,016
(% of AGI for various income ranges: 2.9% for AGIs below $10k, 0.9% for AGIs $10k-25k, 0.6% for AGIs $25k-50k, 0.7% for AGIs $50k-75k, 1.5% for AGIs $75k-100k, 1.9% for AGIs over 100k)
Net capital gain/loss: +$6,559 (reported on 12.6% of returns)
Here:
+$6,559
State:
+$11,152
(% of AGI for various income ranges: -0.3% for AGIs below $10k, 0.6% for AGIs $10k-25k, 0.6% for AGIs $25k-50k, 0.9% for AGIs $50k-75k, 2.8% for AGIs $75k-100k, 11.0% for AGIs over 100k)
Profit/loss from business: +$5,793 (reported on 16.4% of returns)
Here:
+$5,793
State:
+$9,490
(% of AGI for various income ranges: 7.8% for AGIs below $10k, 6.1% for AGIs $10k-25k, 2.2% for AGIs $25k-50k, 1.6% for AGIs $50k-75k, 4.2% for AGIs $75k-100k, 0.8% for AGIs over 100k)
IRA payment deduction: $2,394 (reported on 2.4% of returns)
28778:
$2,394
North Carolina:
$2,967
(% of AGI for various income ranges: 0.2% for AGIs $10k-25k, 0.2% for AGIs $25k-50k, 0.2% for AGIs $50k-75k, 0.3% for AGIs $75k-100k)
Total itemized deductions: $16,111 (27% of AGI, reported on 27.1% of returns)
Here:
$16,111
State:
$19,464
Here:
26.6% of AGI
State:
22.7% of AGI
(% of AGI for various income ranges: 12.2% for AGIs below $10k, 9.3% for AGIs $10k-25k, 12.3% for AGIs $25k-50k, 14.0% for AGIs $50k-75k, 15.7% for AGIs $75k-100k, 16.2% for AGIs over 100k)
Charity contributions deductions: $3,238 (5% of AGI, reported on 23.0% of returns)
Here:
$3,238
State:
$4,035
Here:
5.0% of AGI
State:
4.5% of AGI
(% of AGI for various income ranges: 0.8% for AGIs below $10k, 1.1% for AGIs $10k-25k, 1.6% for AGIs $25k-50k, 2.6% for AGIs $50k-75k, 2.8% for AGIs $75k-100k, 3.9% for AGIs over 100k)
Total tax: $3,935 (reported on 71.7% of returns)
28778:
$3,935
State:
$7,257
(% of AGI for various income ranges: 3.7% for AGIs below $10k, 3.9% for AGIs $10k-25k, 6.3% for AGIs $25k-50k, 8.3% for AGIs $50k-75k, 11.1% for AGIs $75k-100k, 16.8% for AGIs over 100k)
Earned income credit: $1,740 (reported on 21.3% of returns)
Here:
$1,740
State:
$1,851
Percentage of individuals using paid preparers for their 2004 taxes: 59.0%
Here:
59%
State:
62%
(% for various income ranges: 52.8% for AGIs below $10k, 61.0% for AGIs $10k-25k, 60.3% for AGIs $25k-50k, 60.2% for AGIs $50k-75k, 59.1% for AGIs $75k-100k, 67.0% for AGIs over 100k)
Likely homosexual households (counted as self-reported same-sex unmarried-partner households)
Lesbian couples: 0.2% of all households
Gay men: 0.3% of all households
Household received Food Stamps/SNAP in the past 12 months: 235 Household did not receive Food Stamps/SNAP in the past 12 months: 3,745
Women who had a birth in the past 12 months: 169 (173 now married, 0 unmarried) Women who did not have a birth in the past 12 months: 2,448 (758 now married, 1,683 unmarried)
Housing units in zip code 28778 with a mortgage: 1,931 (107 second mortgage, 112 both second mortgage and home equity loan) Houses without a mortgage: 53
Median monthly owner costs for units with a mortgage: $1,296 Median monthly owner costs for units without a mortgage: $359
Residents with income below the poverty level in 2022:
This zip code:
12.5%
Whole state:
12.8%
Residents with income below 50% of the poverty level in 2022:
This zip code:
8.9%
Whole state:
6.8%
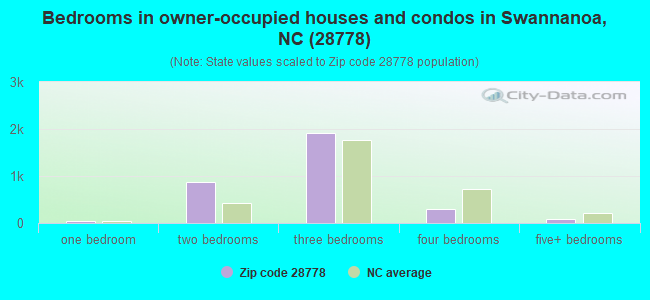
Median number of rooms in houses and condos:
Here:
5.8
State:
6.4
Median number of rooms in apartments:
Here:
5.0
State:
4.4
Notable locations in this zip code not listed on our city pages
Notable locations in zip code 28778: Camp Swannanoa (A), North Carolina State Test Farm (B), Fellowship of Southern Churchmen Camp (C). Display/hide their locations on the map
Churches in zip code 28778 include: Macedonia Church (A), Buckeye Church (B), New Salem Church (C), Beetree Church (D), Christian Creek Church (E), Swannanoa Church (F), Swannanoa Heights Church (G). Display/hide their locations on the map
Reservoirs: Sherwood Lake (A), Flat Top Mountain Lake (B), LeRoy Lake (C), Beetree Reservoir (D), Bee Tree Reservoir (E), Davis Lake (F), Beacon Reservoir (G). Display/hide their locations on the map
Streams, rivers, and creeks: Gregg Branch (A), Stepp Branch (B), North Fork Swannanoa River (C), Bell Branch (D), Beetree Creek (E), Long Branch (F), Spruce Fork (G), Wolfe Branch (H), Wolfpit Branch (I). Display/hide their locations on the map
1,526 married couples with children.
395 single-parent households (35 men, 360 women).
94.4% of residents of 28778 zip code speak English at home.
4.9% of residents speak Spanish at home (27% very well, 5% well, 46% not well, 22% not at all).
0.4% of residents speak other Indo-European language at home (95% very well, 5% well).
0.2% of residents speak Asian or Pacific Island language at home (100% well).
0.1% of residents speak other language at home (33% very well, 67% well).
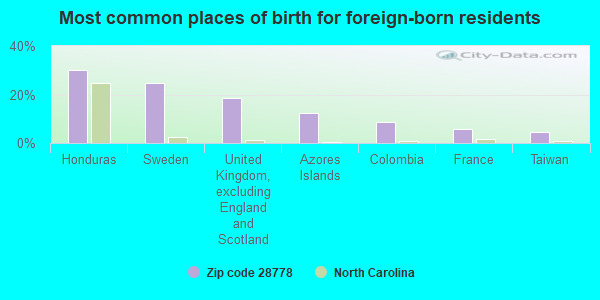
Foreign born population: 390 (3.2%) (44.0% of them are naturalized citizens)
This zip code:
3.2%
Whole state:
8.6%
30%Honduras
25%Sweden
18%United Kingdom, excluding England and Scotland
12%Azores Islands
8%Colombia
6%France
5%Taiwan
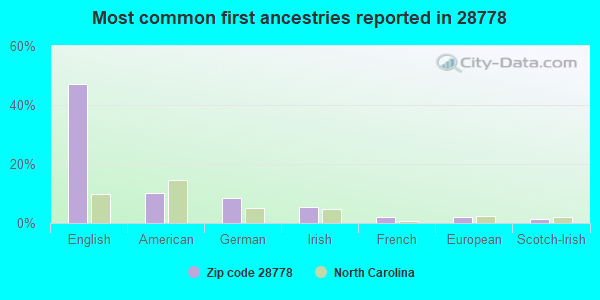
47%English
10%American
9%German
6%Irish
2%French
2%European
1%Scotch-Irish
Year of entry for the foreign-born population
1992010 or later
1672000 to 2009
211990 to 1999
165Before 1990
Major facilities with environmental interests located in this zip code:
CITY OF ASHEVILLE (1370 BEE TREE ROAD in SWANNANOA, NC)
STATE MASTER (North Carolina facility info) - UNDERGROUND STORAGE TANK PROGRAM, -115DA4YG00M29W84AY3VR72P0H, WASTEWATER FACILITY, -4411, HAZARDOUS WASTE PROGRAM National Pollutant Discharge Elimination System NON-MAJOR (Tracking pollutant discharge elimination systems) - permit Conditionally Exempt Small Quantity Generators, less than 100 kg/month of hazardous waste (Resource Conservation and Recovery Act (tracking hazardous waste)) - notification Business SIC classification: WATER SUPPLY; NONCLASSIFIABLE ESTABLISHMENTS Alternative names: ASHEVILLE (CITY)-DEBRUHL WATER TREATMENT PLANT, ASHEVILLE (CITY)-DEBRUHL WTP, BEE TREE WATER PLANT
B.V. HEDRICK- SWANNANOA QUARRY (RED BIRD ROAD in SWANNANOA, NC)
STATE MASTER (North Carolina facility info) - -115DA4YG00M29W84AY3W0ANV0C, WASTEWATER FACILITY National Pollutant Discharge Elimination System NON-MAJOR (Tracking pollutant discharge elimination systems) - permit Business SIC classification: CRUSHED AND BROKEN GRANITE Alternative names: B V HEDRICK
CASTILLIANO, CECILIA - RES. (862 BEE TREE CREEK ROAD in SWANNANOA, NC)
STATE MASTER (North Carolina facility info) - -115DA4YG00NJYW64FBEMG12K98, WASTEWATER FACILITY National Pollutant Discharge Elimination System NON-MAJOR (Tracking pollutant discharge elimination systems) - permit Business SIC classification: SEWERAGE SYSTEMS Alternative names: NEIRA RESIDENCE
CHARLES D. OWEN MANUFACTURING COMPANY (875 WARREN WILSON COLLEGE ROAD in SWANNANOA, NC)
AIR SYNTHETIC MINOR (AIRS/AFS) National Pollutant Discharge Elimination System NON-MAJOR (Tracking pollutant discharge elimination systems) - permit National Pollutant Discharge Elimination System NON-MAJOR (Tracking pollutant discharge elimination systems) - permit Conditionally Exempt Small Quantity Generators, less than 100 kg/month of hazardous waste (Resource Conservation and Recovery Act (tracking hazardous waste)) Business SIC classification: BROADWOVEN FABRIC MILLS, COTTON; BROADWOVEN FABRIC MILLS, MANMADE FIBER AND SILK Business NAICS classification: TEXTILE AND FABRIC FINISHING (EXCEPT BROADWOVEN FABRIC) MILLS. Organizations: SPRINGS INDUSTRIES INC (CONTACT/OPERATOR)
Alternative names: SPRINGS INDUS INC OWEN MFG CO, SPRINGS INDUSTRIES OWEN MFG
ARTSPACE CHARTER (2030 US HWY 70 in SWANNANOA, NC)
(National Center for Education Statistics) - STATE ID-0
BUNCOMBE COMMUNITY-EAST (235 OLD US 70 in SWANNANOA, NC)
(National Center for Education Statistics) - STATE ID-303 Organizations: BUNCOMBE COUNTY SCHOOLS (SCHOOL DISTRICT)
BEACON MANUFACTURING CO (202 WITSON AVENUE in SWANNANOA, NC)
AIR SYNTHETIC MINOR (AIRS/AFS) SUPERFUND (Superfund database) CRITERIA AND HAZARDOUS AIR POLLUTANT INVENTORY (Inventory of air pollution sources) TRI REPORTER (Tracking of toxic chemicals releasing facilities) Business SIC classification: BROADWOVEN FABRIC MILLS, COTTON; BROADWOVEN FABRIC MILLS, MANMADE FIBER AND SILK; HOUSEFURNISHINGS, EXCEPT CURTAINS AND DRAPERIES Business NAICS classification: BROADWOVEN FABRIC MILLS. Alternative names: BEACON BLANKETS, BEACON MANUFACTURING PLANT FIRE
ACCURATE ARMS CO INC (180-A OLD BEE TREE RD in SWANNANOA, NC)
APAC - CAROLINA INC. - BLACK MOUNTAIN (HIGHWAY 70 in SWANNANOA, NC)
AIR SYNTHETIC MINOR (AIRS/AFS) National Pollutant Discharge Elimination System NON-MAJOR (Tracking pollutant discharge elimination systems) - permit Business SIC classification: ASPHALT PAVING MIXTURES AND BLOCKS Alternative names: APAC ATLANTIC INC BLACK MTN, APAC CAROLINA INC-SWANNANOA, APAC OF CAROLINA SWANNANOA
CAMPBELL MACHINERY CO (130-A BUCKEYE COVE RD in SWANNANOA, NC)
(Resource Conservation and Recovery Act (tracking hazardous waste)) Organizations: BRUCE J CAMPBELL (CONTACT/OWNER)
BLACK MOUNTAIN CONCRETE READY (2493 US HWY 70 in SWANNANOA, NC)
National Pollutant Discharge Elimination System NON-MAJOR (Tracking pollutant discharge elimination systems) - permit Business SIC classification: READY-MIXED CONCRETE Alternative names: BLACK MTN CNCRTE READY MIX
BLAKES OF SWANNANOA INCORPORAT (2066 US HWY 70 in SWANNANOA, NC)
National Pollutant Discharge Elimination System NON-MAJOR (Tracking pollutant discharge elimination systems) - permit Business SIC classification: MOTOR VEHICLE PARTS, USED Alternative names: BLAKES OF SWANNANOA, INC.
BRISCO INC (251 BUCKEYE COVE RD in SWANNANOA, NC)
Small Quantity Generators, between 100 kg and 1000 kg of hazardous waste/month (Resource Conservation and Recovery Act (tracking hazardous waste)) - notification Organizations: KEN LANTER (CONTACT/OWNER)
Housing units lacking complete plumbing facilities: 4.1% Housing units lacking complete kitchen facilities: 7.3%
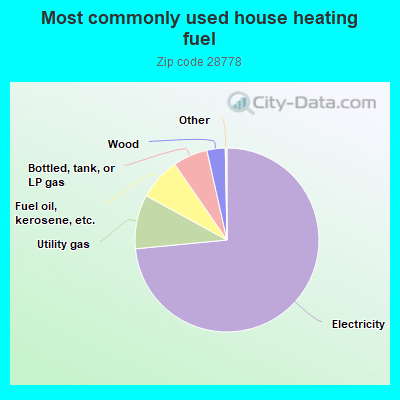
73.4%Electricity
9.5%Utility gas
7.4%Fuel oil, kerosene, etc.
6.1%Bottled, tank, or LP gas
3.2%Wood
Population in 1990: 5,911. Population change in the 1990s: +3,410 (+57.7%).
Place of birth for U.S.-born residents:
This state: 6,658
Northeast: 1,155
Midwest: 884
South: 2,220
West: 547
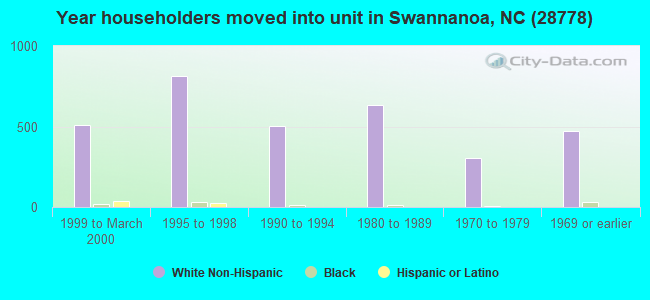
56% of the 28778 zip code residents lived in the same house 5 years ago. Out of people who lived in different houses, 55% lived in this county. Out of people who lived in different counties, 50% lived in North Carolina.
95% of the 28778 zip code residents lived in the same house 1 year ago. Out of people who lived in different houses, 70% moved from this county. Out of people who lived in different houses, 20% moved from different county within same state. Out of people who lived in different houses, 14% moved from different state.
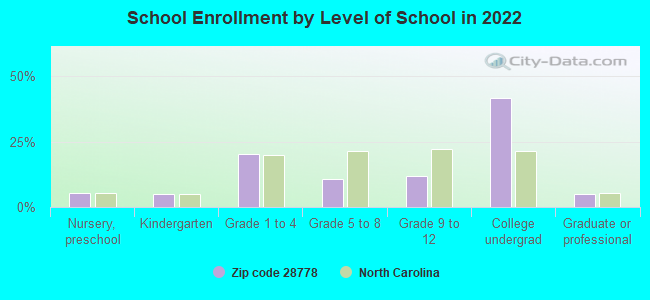
Private vs. public school enrollment:
Students in private schools in grades 1 to 8 (elementary and middle school): 108
Here:
14.7%
North Carolina:
13.8%
Students in private schools in grades 9 to 12 (high school): 79
Here:
27.5%
North Carolina:
11.9%
Students in private undergraduate colleges: 407
Here:
40.8%
North Carolina:
19.3%
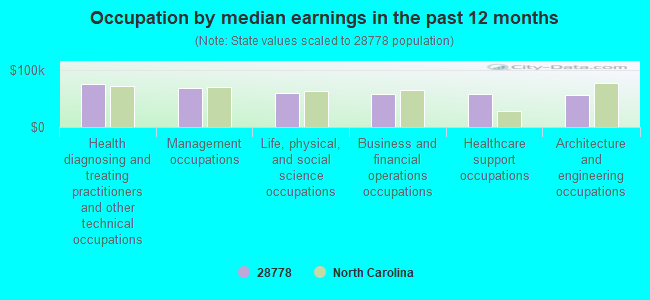
Occupation by median earnings in the past 12 months ($)
75,880Health diagnosing and treating practitioners and other technical occupations
69,131Management occupations
60,194Life, physical, and social science occupations
58,130Business and financial operations occupations
57,159Healthcare support occupations
56,245Architecture and engineering occupations
Top industries in this zip code by the number of employees in 2005:
Educational Services: Colleges, Universities, and Professional Schools (500-999 employees: 1 establishment)
Health Care and Social Assistance: Nursing Care Facilities (100-249: 2)
Accommodation and Food Services: Food Service Contractors (50-99: 1)
Educational Services: Fine Arts Schools (50-99: 1)
People in group quarters in 2010:
774 people in college/university student housing
100 people in nursing facilities/skilled-nursing facilities
35 people in other noninstitutional facilities
31 people in group homes intended for adults
People in group quarters in 2000:
559 people in college dormitories (includes college quarters off campus)
248 people in training schools for juvenile delinquents
113 people in other noninstitutional group quarters
24 people in homes for the mentally retarded
Fatal accident statistics in 2013:
Fatal accident count: 1
Vehicles involved in fatal accidents: 2
Fatal accidents caused by drunken drivers: 0
Fatalities: 1
Persons involved in fatal accidents: 2
Pedestrians involved in fatal accidents: 0
Fatal accident statistics in 2010:
Fatal accident count: 1
Vehicles involved in fatal accidents: 1
Fatal accidents caused by drunken drivers: 1
Fatalities: 1
Persons involved in fatal accidents: 1
Pedestrians involved in fatal accidents: 0
Home Mortgage Disclosure Act Aggregated Statistics For Year 2009 (Based on 2 full and 2 partial tracts)
A) FHA, FSA/RHS & VA Home Purchase Loans
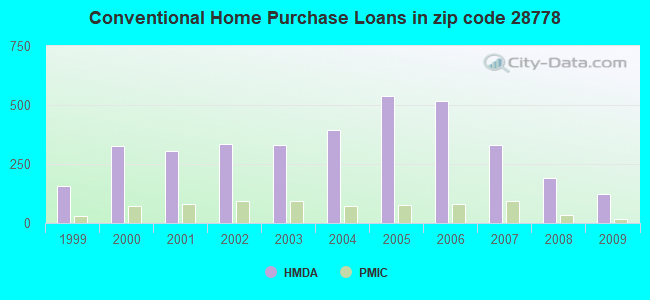
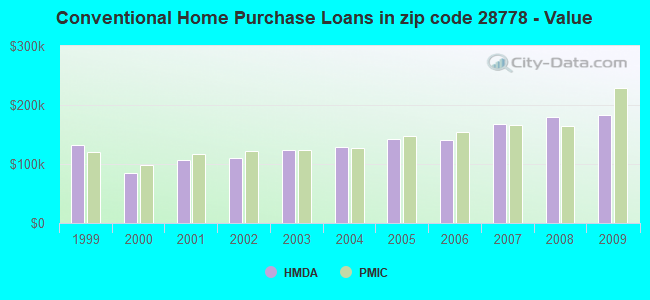
B) Conventional Home Purchase Loans
C) Refinancings
D) Home Improvement Loans
F) Non-occupant Loans on < 5 Family Dwellings (A B C & D)
G) Loans On Manufactured Home Dwelling (A B C & D)
Number
Average Value
Number
Average Value
Number
Average Value
Number
Average Value
Number
Average Value
Number
Average Value
LOANS ORIGINATED
55
$148,477
124
$183,265
508
$172,081
12
$121,424
56
$223,944
13
$312,795
APPLICATIONS APPROVED, NOT ACCEPTED
2
$118,630
13
$156,723
25
$168,780
1
$78,690
5
$279,440
6
$53,097
APPLICATIONS DENIED
9
$133,240
9
$214,012
169
$163,833
13
$49,293
15
$191,748
16
$103,531
APPLICATIONS WITHDRAWN
13
$160,737
19
$186,277
134
$155,738
5
$32,928
6
$218,235
14
$94,322
FILES CLOSED FOR INCOMPLETENESS
4
$146,742
4
$208,042
31
$208,447
2
$64,800
5
$174,804
0
$0
Aggregated Statistics For Year 2008 (Based on 2 full and 2 partial tracts)
A) FHA, FSA/RHS & VA Home Purchase Loans
B) Conventional Home Purchase Loans
C) Refinancings
D) Home Improvement Loans
E) Loans on Dwellings For 5+ Families
F) Non-occupant Loans on < 5 Family Dwellings (A B C & D)
G) Loans On Manufactured Home Dwelling (A B C & D)
Number
Average Value
Number
Average Value
Number
Average Value
Number
Average Value
Number
Average Value
Number
Average Value
Number
Average Value
LOANS ORIGINATED
37
$157,456
190
$179,645
388
$159,882
19
$76,725
1
$901,260
83
$162,508
37
$96,577
APPLICATIONS APPROVED, NOT ACCEPTED
6
$131,923
15
$141,551
38
$161,196
3
$46,097
0
$0
11
$178,947
6
$78,090
APPLICATIONS DENIED
4
$164,292
24
$132,433
181
$148,491
25
$93,554
0
$0
19
$140,181
32
$89,655
APPLICATIONS WITHDRAWN
10
$148,538
28
$205,852
104
$153,643
11
$83,375
0
$0
10
$151,910
15
$102,067
FILES CLOSED FOR INCOMPLETENESS
1
$118,560
9
$177,784
29
$166,651
0
$0
0
$0
1
$183,610
0
$0
Aggregated Statistics For Year 2007 (Based on 2 full and 2 partial tracts)
A) FHA, FSA/RHS & VA Home Purchase Loans
B) Conventional Home Purchase Loans
C) Refinancings
D) Home Improvement Loans
E) Loans on Dwellings For 5+ Families
F) Non-occupant Loans on < 5 Family Dwellings (A B C & D)
G) Loans On Manufactured Home Dwelling (A B C & D)
Number
Average Value
Number
Average Value
Number
Average Value
Number
Average Value
Number
Average Value
Number
Average Value
Number
Average Value
LOANS ORIGINATED
3
$138,227
329
$167,097
414
$152,888
35
$60,865
4
$311,532
122
$170,115
41
$74,665
APPLICATIONS APPROVED, NOT ACCEPTED
3
$90,277
38
$138,095
85
$135,580
6
$30,572
0
$0
21
$159,515
14
$70,731
APPLICATIONS DENIED
4
$185,422
69
$152,371
269
$146,577
37
$37,519
0
$0
20
$211,926
42
$78,785
APPLICATIONS WITHDRAWN
4
$110,655
33
$210,384
91
$162,532
8
$50,721
0
$0
16
$116,156
5
$77,210
FILES CLOSED FOR INCOMPLETENESS
0
$0
3
$111,430
29
$143,691
0
$0
0
$0
0
$0
0
$0
Aggregated Statistics For Year 2006 (Based on 2 full and 2 partial tracts)
A) FHA, FSA/RHS & VA Home Purchase Loans
B) Conventional Home Purchase Loans
C) Refinancings
D) Home Improvement Loans
E) Loans on Dwellings For 5+ Families
F) Non-occupant Loans on < 5 Family Dwellings (A B C & D)
G) Loans On Manufactured Home Dwelling (A B C & D)
Number
Average Value
Number
Average Value
Number
Average Value
Number
Average Value
Number
Average Value
Number
Average Value
Number
Average Value
LOANS ORIGINATED
21
$150,846
517
$140,394
364
$149,026
54
$49,366
1
$209,840
152
$144,248
52
$85,398
APPLICATIONS APPROVED, NOT ACCEPTED
5
$63,968
89
$105,565
58
$131,361
5
$37,776
0
$0
23
$143,272
31
$78,154
APPLICATIONS DENIED
8
$101,664
139
$98,659
193
$123,994
25
$51,166
0
$0
21
$154,381
84
$67,386
APPLICATIONS WITHDRAWN
3
$128,577
60
$132,759
122
$135,942
5
$60,798
0
$0
8
$168,869
10
$89,707
FILES CLOSED FOR INCOMPLETENESS
0
$0
9
$119,260
35
$156,206
2
$81,315
0
$0
3
$123,120
4
$77,260
Aggregated Statistics For Year 2005 (Based on 2 full and 2 partial tracts)
A) FHA, FSA/RHS & VA Home Purchase Loans
B) Conventional Home Purchase Loans
C) Refinancings
D) Home Improvement Loans
F) Non-occupant Loans on < 5 Family Dwellings (A B C & D)
G) Loans On Manufactured Home Dwelling (A B C & D)
Number
Average Value
Number
Average Value
Number
Average Value
Number
Average Value
Number
Average Value
Number
Average Value
LOANS ORIGINATED
6
$114,975
538
$142,979
387
$129,595
49
$45,589
146
$139,929
64
$73,293
APPLICATIONS APPROVED, NOT ACCEPTED
3
$93,070
71
$127,269
119
$115,714
10
$41,773
17
$169,737
24
$55,968
APPLICATIONS DENIED
9
$105,321
121
$107,591
203
$116,890
35
$38,117
16
$110,881
77
$64,895
APPLICATIONS WITHDRAWN
1
$97,580
59
$123,105
180
$136,907
22
$136,954
15
$108,612
20
$86,078
FILES CLOSED FOR INCOMPLETENESS
0
$0
6
$99,125
38
$140,961
1
$49,310
0
$0
2
$83,740
Aggregated Statistics For Year 2004 (Based on 2 full and 2 partial tracts)
A) FHA, FSA/RHS & VA Home Purchase Loans
B) Conventional Home Purchase Loans
C) Refinancings
D) Home Improvement Loans
E) Loans on Dwellings For 5+ Families
F) Non-occupant Loans on < 5 Family Dwellings (A B C & D)
G) Loans On Manufactured Home Dwelling (A B C & D)
Number
Average Value
Number
Average Value
Number
Average Value
Number
Average Value
Number
Average Value
Number
Average Value
Number
Average Value
LOANS ORIGINATED
10
$94,941
396
$129,381
427
$119,349
25
$31,527
1
$230,820
103
$115,368
52
$75,018
APPLICATIONS APPROVED, NOT ACCEPTED
3
$75,937
83
$78,500
88
$110,660
10
$97,978
0
$0
19
$102,139
57
$54,616
APPLICATIONS DENIED
6
$126,392
120
$101,130
252
$108,742
28
$43,441
0
$0
22
$120,315
86
$57,505
APPLICATIONS WITHDRAWN
3
$144,527
54
$114,717
152
$126,855
5
$39,350
0
$0
14
$124,374
17
$92,018
FILES CLOSED FOR INCOMPLETENESS
0
$0
7
$122,939
26
$143,865
2
$38,820
0
$0
1
$90,230
0
$0
Aggregated Statistics For Year 2003 (Based on 2 full and 2 partial tracts)
A) FHA, FSA/RHS & VA Home Purchase Loans
B) Conventional Home Purchase Loans
C) Refinancings
D) Home Improvement Loans
E) Loans on Dwellings For 5+ Families
F) Non-occupant Loans on < 5 Family Dwellings (A B C & D)
Number
Average Value
Number
Average Value
Number
Average Value
Number
Average Value
Number
Average Value
Number
Average Value
LOANS ORIGINATED
5
$139,896
331
$123,932
890
$115,853
26
$41,508
1
$1,521,340
108
$114,017
APPLICATIONS APPROVED, NOT ACCEPTED
4
$22,430
66
$72,735
125
$100,826
4
$25,920
0
$0
4
$154,742
APPLICATIONS DENIED
2
$83,740
107
$62,816
282
$104,022
27
$22,529
0
$0
13
$71,653
APPLICATIONS WITHDRAWN
0
$0
24
$116,505
112
$107,727
1
$20,980
0
$0
11
$115,215
FILES CLOSED FOR INCOMPLETENESS
0
$0
4
$121,552
19
$131,901
1
$31,480
0
$0
2
$96,700
Aggregated Statistics For Year 2002 (Based on 2 full and 2 partial tracts)
A) FHA, FSA/RHS & VA Home Purchase Loans
B) Conventional Home Purchase Loans
C) Refinancings
D) Home Improvement Loans
F) Non-occupant Loans on < 5 Family Dwellings (A B C & D)
Number
Average Value
Number
Average Value
Number
Average Value
Number
Average Value
Number
Average Value
LOANS ORIGINATED
12
$111,562
333
$109,606
628
$119,517
18
$18,677
97
$111,247
APPLICATIONS APPROVED, NOT ACCEPTED
2
$85,735
71
$59,464
91
$96,818
6
$45,500
7
$58,383
APPLICATIONS DENIED
0
$0
124
$59,228
294
$85,312
30
$18,308
6
$65,463
APPLICATIONS WITHDRAWN
1
$224,530
40
$95,081
106
$94,539
4
$34,782
10
$97,660
FILES CLOSED FOR INCOMPLETENESS
0
$0
11
$95,022
20
$121,014
1
$15,740
1
$159,480
Aggregated Statistics For Year 2001 (Based on 2 full and 2 partial tracts)
A) FHA, FSA/RHS & VA Home Purchase Loans
B) Conventional Home Purchase Loans
C) Refinancings
D) Home Improvement Loans
E) Loans on Dwellings For 5+ Families
F) Non-occupant Loans on < 5 Family Dwellings (A B C & D)
Number
Average Value
Number
Average Value
Number
Average Value
Number
Average Value
Number
Average Value
Number
Average Value
LOANS ORIGINATED
18
$102,055
304
$106,699
502
$100,473
32
$19,575
4
$64,300
58
$96,106
APPLICATIONS APPROVED, NOT ACCEPTED
0
$0
66
$48,932
102
$90,804
10
$29,907
0
$0
9
$68,988
APPLICATIONS DENIED
2
$97,695
171
$51,186
242
$77,408
26
$36,601
0
$0
17
$62,114
APPLICATIONS WITHDRAWN
2
$71,775
19
$96,164
109
$84,308
8
$10,532
0
$0
2
$82,885
FILES CLOSED FOR INCOMPLETENESS
1
$79,740
3
$142,387
23
$96,086
0
$0
0
$0
1
$10,490
Aggregated Statistics For Year 2000 (Based on 2 full and 2 partial tracts)
A) FHA, FSA/RHS & VA Home Purchase Loans
B) Conventional Home Purchase Loans
C) Refinancings
D) Home Improvement Loans
F) Non-occupant Loans on < 5 Family Dwellings (A B C & D)
Number
Average Value
Number
Average Value
Number
Average Value
Number
Average Value
Number
Average Value
LOANS ORIGINATED
15
$108,787
326
$85,511
193
$80,138
25
$32,648
63
$83,163
APPLICATIONS APPROVED, NOT ACCEPTED
15
$46,647
71
$65,179
68
$87,848
3
$18,330
2
$93,710
APPLICATIONS DENIED
10
$64,984
228
$37,823
193
$65,283
15
$23,862
17
$67,486
APPLICATIONS WITHDRAWN
9
$69,816
31
$94,209
90
$66,030
8
$20,395
6
$30,673
FILES CLOSED FOR INCOMPLETENESS
1
$64,000
9
$119,964
9
$124,290
0
$0
0
$0
Aggregated Statistics For Year 1999 (Based on 1 full and 1 partial tracts)
A) FHA, FSA/RHS & VA Home Purchase Loans
B) Conventional Home Purchase Loans
C) Refinancings
D) Home Improvement Loans
F) Non-occupant Loans on < 5 Family Dwellings (A B C & D)
Detailed PMIC statistics for the following Tracts:0030.01
, 0030.02
2004 - 2018 National Fire Incident Reporting System (NFIRS) incidents
According to the data from the years 2004 - 2018 the average number of fire incidents per year is 42. The highest number of fires - 87 took place in 2016, and the least - 4 in 2012. The data has a growing trend.
When looking into fire subcategories, the most reports belonged to: Structure Fires (57.7%), and Outside Fires (29.2%).
Fire incident types reported to NFIRS in Zip Code 28778


 Nearest zip codes: 28805, 28757, 28711, 28730, 28709, 28803.


 According to the data from the years 2004 - 2018 the average number of fire incidents per year is 42. The highest number of fires - 87 took place in 2016, and the least - 4 in 2012. The data has a growing trend.
 When looking into fire subcategories, the most reports belonged to: Structure Fires (57.7%), and Outside Fires (29.2%).