Estimated zip code population in 2022: 25,253 Zip code population in 2010: 20,507 Zip code population in 2000: 19,307
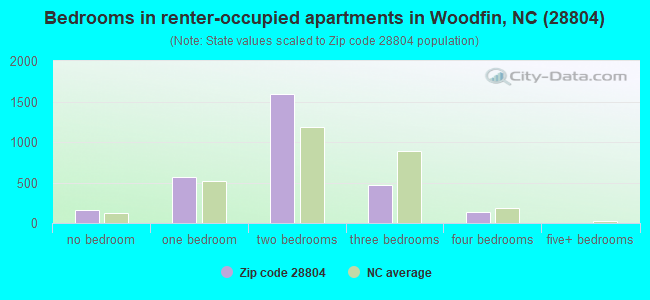
Houses and condos: 11,999 Renter-occupied apartments: 2,919
% of renters here:
30%
State:
33%
March 2022 cost of living index in zip code 28804: 94.3 (less than average, U.S. average is 100)
Land area: 26.6 sq. mi. Water area: 0.6 sq. mi.
Population density: 950 people per square mile
(low).
OSM Map
General Map
Google Map
MSN Map
OSM Map
General Map
Google Map
MSN Map
OSM Map
General Map
Google Map
MSN Map
OSM Map
General Map
Google Map
MSN Map
Please wait while loading the map...
Real estate property taxes paid for housing units in 2022:
This zip code:
0.6% ($3,532)
North Carolina:
0.6% ($1,769)
Median real estate property taxes paid for housing units with mortgages in 2022: $3,567 (0.6%) Median real estate property taxes paid for housing units with no mortgage in 2022: $3,462 (0.6%)
Estimated median house/condo value in 2022: $570,040
28804:
$570,040
North Carolina:
$280,600
According to our research of North Carolina and other state lists, there were 20 registered sex offenders living in 28804 zip code as of April 27, 2024. The ratio of all residents to sex offenders in zip code 28804 is 1,085 to 1. The ratio of registered sex offenders to all residents in this zip code is lower than the state average.
Median resident age:
This zip code:
45.3 years
North Carolina median age:
39.2 years
Average household size:
This zip code:
2.4 people
North Carolina:
2.4 people
Averages for the 2020 tax year for zip code 28804, filed in 2021:
Average Adjusted Gross Income (AGI) in 2020: $98,806 (Individual Income Tax Returns)
Here:
$98,806
State:
$70,020
Salary/wage: $65,443 (reported on 71.3% of returns)
Here:
$65,443
State:
$58,387
(% of AGI for various income ranges: 1141.0% for AGIs below $25k, 3659.5% for AGIs $25k-50k, 6078.7% for AGIs $50k-75k, 8345.5% for AGIs $75k-100k, 15862.3% for AGIs $100k-200k, 84943.8% for AGIs over 200k)
Taxable interest for individuals: $2,779 (reported on 45.1% of returns)
This zip code:
$2,779
North Carolina:
$1,479
(% of AGI for various income ranges: 28.2% for AGIs below $25k, 41.8% for AGIs $25k-50k, 134.8% for AGIs $50k-75k, 193.4% for AGIs $75k-100k, 462.4% for AGIs $100k-200k, 2707.7% for AGIs over 200k)
Ordinary dividends: $14,027 (reported on 35.0% of returns)
Here:
$14,027
State:
$7,888
(% of AGI for various income ranges: 72.5% for AGIs below $25k, 142.2% for AGIs $25k-50k, 415.9% for AGIs $50k-75k, 869.8% for AGIs $75k-100k, 1696.9% for AGIs $100k-200k, 11551.2% for AGIs over 200k)
Net capital gain/loss in AGI: +$33,539 (reported on 33.1% of returns)
Here:
+$33,539
State:
+$23,652
(% of AGI for various income ranges: 30.7% for AGIs below $25k, 100.4% for AGIs $25k-50k, 314.1% for AGIs $50k-75k, 665.3% for AGIs $75k-100k, 1878.8% for AGIs $100k-200k, 38590.8% for AGIs over 200k)
Profit/loss from business: +$18,982 (reported on 21.7% of returns)
Here:
+$18,982
State:
+$11,710
(% of AGI for various income ranges: 213.8% for AGIs below $25k, 354.6% for AGIs $25k-50k, 515.9% for AGIs $50k-75k, 919.8% for AGIs $75k-100k, 1330.4% for AGIs $100k-200k, 6253.8% for AGIs over 200k)
Taxable individual retirement arrangement distribution: $29,373 (reported on 15.2% of returns)
28804:
$29,373
North Carolina:
$20,247
(% of AGI for various income ranges: 84.0% for AGIs below $25k, 175.2% for AGIs $25k-50k, 542.0% for AGIs $50k-75k, 974.5% for AGIs $75k-100k, 2136.4% for AGIs $100k-200k, 7552.3% for AGIs over 200k)
Self-employed (Keogh) retirement plans: $25,529 (reported on 1.5% of returns)
28804:
$25,529
North Carolina:
$26,749
(% of AGI for various income ranges: 56.1% for AGIs $50k-75k, 73.2% for AGIs $100k-200k, 1287.7% for AGIs over 200k)
Total itemized deductions: $41,550 (reported on 13.9% of returns)
Here:
$41,550
State:
$34,549
(% of AGI for various income ranges: 105.9% for AGIs below $25k, 170.2% for AGIs $25k-50k, 613.7% for AGIs $50k-75k, 1137.7% for AGIs $75k-100k, 2001.6% for AGIs $100k-200k, 12746.9% for AGIs over 200k)
Charity contributions: $17,352 (reported on 12.0% of returns)
Here:
$17,352
State:
$13,360
(% of AGI for various income ranges: 6.6% for AGIs below $25k, 20.7% for AGIs $25k-50k, 82.7% for AGIs $50k-75k, 234.0% for AGIs $75k-100k, 388.7% for AGIs $100k-200k, 6822.7% for AGIs over 200k)
Taxes paid: $8,231 (reported on 13.8% of returns)
28804:
$8,231
State:
$7,586
(% of AGI for various income ranges: 16.0% for AGIs below $25k, 26.9% for AGIs $25k-50k, 132.2% for AGIs $50k-75k, 272.1% for AGIs $75k-100k, 525.7% for AGIs $100k-200k, 2090.8% for AGIs over 200k)
Earned income credit: $1,507 (reported on 11.4% of returns)
Here:
$1,507
State:
$2,337
(% of AGI for various income ranges: 53.2% for AGIs below $25k, 42.9% for AGIs $25k-50k)
Percentage of individuals using paid preparers for their 2020 taxes: 92.7%
Here:
93%
State:
93%
(% for various income ranges: 90.8% for AGIs below $25k, 93.2% for AGIs $25k-50k, 94.0% for AGIs $50k-75k, 92.3% for AGIs $75k-100k, 93.0% for AGIs $100k-200k, 96.3% for AGIs over 200k)
Averages for the 2012 tax year for zip code 28804, filed in 2013:
Average Adjusted Gross Income (AGI) in 2012: $72,940 (Individual Income Tax Returns)
Here:
$72,940
State:
$54,937
Salary/wage: $52,371 (reported on 75.3% of returns)
Here:
$52,371
State:
$46,336
(% of AGI for various income ranges: 70.9% for AGIs below $25k, 70.3% for AGIs $25k-50k, 62.3% for AGIs $50k-75k, 55.7% for AGIs $75k-100k, 57.2% for AGIs $100k-200k, 42.6% for AGIs over 200k)
Taxable interest for individuals: $2,175 (reported on 45.9% of returns)
This zip code:
$2,175
North Carolina:
$1,298
(% of AGI for various income ranges: 2.0% for AGIs below $25k, 1.0% for AGIs $25k-50k, 1.6% for AGIs $50k-75k, 1.7% for AGIs $75k-100k, 1.5% for AGIs $100k-200k, 1.1% for AGIs over 200k)
Ordinary dividends: $12,443 (reported on 32.6% of returns)
Here:
$12,443
State:
$6,213
(% of AGI for various income ranges: 3.8% for AGIs below $25k, 3.1% for AGIs $25k-50k, 3.7% for AGIs $50k-75k, 4.3% for AGIs $75k-100k, 5.0% for AGIs $100k-200k, 7.6% for AGIs over 200k)
Net capital gain/loss in AGI: +$16,813 (reported on 29.1% of returns)
Here:
+$16,813
State:
+$12,740
(% of AGI for various income ranges: 0.2% for AGIs below $25k, 0.8% for AGIs $25k-50k, 1.5% for AGIs $50k-75k, 2.0% for AGIs $75k-100k, 3.1% for AGIs $100k-200k, 13.9% for AGIs over 200k)
Profit/loss from business: +$13,170 (reported on 21.4% of returns)
Here:
+$13,170
State:
+$10,311
(% of AGI for various income ranges: 10.1% for AGIs below $25k, 6.1% for AGIs $25k-50k, 4.0% for AGIs $50k-75k, 4.2% for AGIs $75k-100k, 3.9% for AGIs $100k-200k, 2.1% for AGIs over 200k)
Taxable individual retirement arrangement distribution: $23,656 (reported on 15.2% of returns)
28804:
$23,656
North Carolina:
$15,575
(% of AGI for various income ranges: 3.7% for AGIs below $25k, 3.8% for AGIs $25k-50k, 4.5% for AGIs $50k-75k, 5.4% for AGIs $75k-100k, 6.7% for AGIs $100k-200k, 4.4% for AGIs over 200k)
Self-employment retirement plans: $15,655 (reported on 1.1% of returns)
28804:
$15,655
North Carolina:
$21,078
(% of AGI for various income ranges: 0.4% for AGIs $25k-50k, 0.3% for AGIs $100k-200k, 0.3% for AGIs over 200k)
Total itemized deductions: $29,642 (21% of AGI, reported on 40.7% of returns)
Here:
$29,642
State:
$23,438
Here:
21.5% of AGI
State:
21.5% of AGI
(% of AGI for various income ranges: 16.2% for AGIs below $25k, 13.9% for AGIs $25k-50k, 17.3% for AGIs $50k-75k, 18.8% for AGIs $75k-100k, 18.5% for AGIs $100k-200k, 15.4% for AGIs over 200k)
Charity contributions: $6,476 (reported on 35.0% of returns)
Here:
$6,476
State:
$4,687
(% of AGI for various income ranges: 1.1% for AGIs below $25k, 1.5% for AGIs $25k-50k, 2.2% for AGIs $50k-75k, 2.4% for AGIs $75k-100k, 3.2% for AGIs $100k-200k, 4.2% for AGIs over 200k)
Taxes paid: $11,658 (reported on 40.5% of returns)
28804:
$11,658
State:
$8,823
(% of AGI for various income ranges: 3.5% for AGIs below $25k, 3.5% for AGIs $25k-50k, 5.3% for AGIs $50k-75k, 6.4% for AGIs $75k-100k, 7.7% for AGIs $100k-200k, 7.4% for AGIs over 200k)
Earned income credit: $1,670 (reported on 13.7% of returns)
Here:
$1,670
State:
$2,376
(% of AGI for various income ranges: 3.8% for AGIs below $25k, 0.6% for AGIs $25k-50k)
Percentage of individuals using paid preparers for their 2012 taxes: 53.0%
Here:
53%
State:
53%
(% for various income ranges: 45.2% for AGIs below $25k, 47.7% for AGIs $25k-50k, 58.2% for AGIs $50k-75k, 62.5% for AGIs $75k-100k, 63.6% for AGIs $100k-200k, 80.7% for AGIs over 200k)
Averages for the 2004 tax year for zip code 28804, filed in 2005:
Average Adjusted Gross Income (AGI) in 2004: $58,462 (Individual Income Tax Returns)
Here:
$58,462
State:
$45,376
Salary/wage: $45,196 (reported on 75.6% of returns)
Here:
$45,196
State:
$39,442
(% of AGI for various income ranges: 190.4% for AGIs below $10k, 71.2% for AGIs $10k-25k, 71.3% for AGIs $25k-50k, 64.5% for AGIs $50k-75k, 59.1% for AGIs $75k-100k, 50.2% for AGIs over 100k)
Taxable interest for individuals: $2,337 (reported on 54.5% of returns)
This zip code:
$2,337
North Carolina:
$1,515
(% of AGI for various income ranges: 17.6% for AGIs below $10k, 2.7% for AGIs $10k-25k, 2.2% for AGIs $25k-50k, 2.2% for AGIs $50k-75k, 2.8% for AGIs $75k-100k, 1.7% for AGIs over 100k)
Taxable dividends: $7,030 (reported on 38.4% of returns)
Here:
$7,030
State:
$4,016
(% of AGI for various income ranges: 20.2% for AGIs below $10k, 3.4% for AGIs $10k-25k, 3.1% for AGIs $25k-50k, 3.4% for AGIs $50k-75k, 3.9% for AGIs $75k-100k, 5.3% for AGIs over 100k)
Net capital gain/loss: +$17,914 (reported on 33.7% of returns)
Here:
+$17,914
State:
+$11,152
(% of AGI for various income ranges: -5.0% for AGIs below $10k, 0.9% for AGIs $10k-25k, 1.7% for AGIs $25k-50k, 2.2% for AGIs $50k-75k, 5.2% for AGIs $75k-100k, 16.9% for AGIs over 100k)
Profit/loss from business: +$14,267 (reported on 19.7% of returns)
Here:
+$14,267
State:
+$9,490
(% of AGI for various income ranges: 7.2% for AGIs below $10k, 6.5% for AGIs $10k-25k, 4.8% for AGIs $25k-50k, 3.8% for AGIs $50k-75k, 6.0% for AGIs $75k-100k, 4.6% for AGIs over 100k)
IRA payment deduction: $3,316 (reported on 3.5% of returns)
28804:
$3,316
North Carolina:
$2,967
(% of AGI for various income ranges: 1.0% for AGIs below $10k, 0.3% for AGIs $10k-25k, 0.3% for AGIs $25k-50k, 0.3% for AGIs $50k-75k, 0.3% for AGIs $75k-100k, 0.1% for AGIs over 100k)
Self-employed pension: $13,771 (reported on 1.7% of returns)
Here:
$13,771
North Carolina:
$14,754
(% of AGI for various income ranges: 0.2% for AGIs $10k-25k, 0.1% for AGIs $25k-50k, 0.1% for AGIs $50k-75k, 0.3% for AGIs $75k-100k, 0.6% for AGIs over 100k)
Total itemized deductions: $23,376 (21% of AGI, reported on 42.5% of returns)
Here:
$23,376
State:
$19,464
Here:
21.4% of AGI
State:
22.7% of AGI
(% of AGI for various income ranges: 40.6% for AGIs below $10k, 15.8% for AGIs $10k-25k, 17.2% for AGIs $25k-50k, 19.9% for AGIs $50k-75k, 20.0% for AGIs $75k-100k, 15.4% for AGIs over 100k)
Charity contributions deductions: $5,121 (4% of AGI, reported on 38.3% of returns)
Here:
$5,121
State:
$4,035
Here:
4.5% of AGI
State:
4.5% of AGI
(% of AGI for various income ranges: 3.2% for AGIs below $10k, 1.7% for AGIs $10k-25k, 2.3% for AGIs $25k-50k, 3.1% for AGIs $50k-75k, 3.7% for AGIs $75k-100k, 3.8% for AGIs over 100k)
Total tax: $10,798 (reported on 76.5% of returns)
28804:
$10,798
State:
$7,257
(% of AGI for various income ranges: 6.8% for AGIs below $10k, 4.5% for AGIs $10k-25k, 7.1% for AGIs $25k-50k, 9.1% for AGIs $50k-75k, 10.7% for AGIs $75k-100k, 19.1% for AGIs over 100k)
Earned income credit: $1,394 (reported on 11.3% of returns)
Here:
$1,394
State:
$1,851
Percentage of individuals using paid preparers for their 2004 taxes: 58.6%
Here:
59%
State:
62%
(% for various income ranges: 53.1% for AGIs below $10k, 54.6% for AGIs $10k-25k, 56.5% for AGIs $25k-50k, 61.4% for AGIs $50k-75k, 61.2% for AGIs $75k-100k, 74.7% for AGIs over 100k)
Likely homosexual households (counted as self-reported same-sex unmarried-partner households)
Lesbian couples: 0.3% of all households
Gay men: 1.1% of all households
Household received Food Stamps/SNAP in the past 12 months: 695 Household did not receive Food Stamps/SNAP in the past 12 months: 8,862
Women who had a birth in the past 12 months: 158 (163 now married, 0 unmarried) Women who did not have a birth in the past 12 months: 5,209 (1,712 now married, 3,485 unmarried)
Housing units in zip code 28804 with a mortgage: 3,733 (374 second mortgage, 364 both second mortgage and home equity loan) Houses without a mortgage: 216
Median monthly owner costs for units with a mortgage: $1,942 Median monthly owner costs for units without a mortgage: $628
Residents with income below the poverty level in 2022:
This zip code:
10.1%
Whole state:
12.8%
Residents with income below 50% of the poverty level in 2022:
This zip code:
5.7%
Whole state:
6.8%
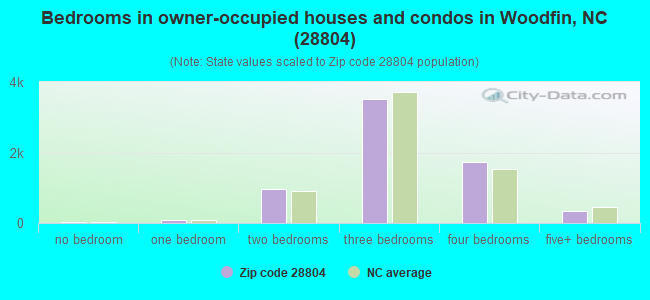
Median number of rooms in houses and condos:
Here:
6.8
State:
6.4
Median number of rooms in apartments:
Here:
4.2
State:
4.4
Notable locations in this zip code not listed on our city pages
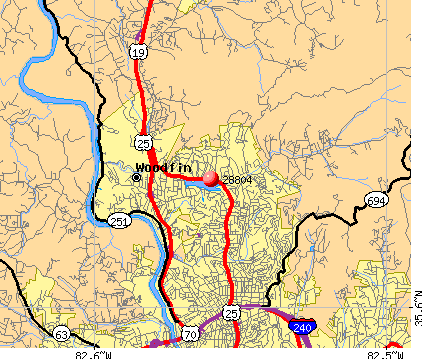
Notable locations in zip code 28804: Country Club of Asheville (A), Grace Plaza (B), Beaver Lake Golf Course (C), Craggy Prison (D). Display/hide their locations on the map
Churches in zip code 28804 include: Alexander Chapel (A), Beaverdam Church (B), Victory Church (C), New Hope Church (D), New Liberty Church (E), Pine Burr Park Church (F), Pleasant Hill Church (G), Asbury Memorial Church (H), Riverview Church (I). Display/hide their locations on the map
Streams, rivers, and creeks: Smith Creek (A), Blue Branch (B), Beaverdam Creek (C), Wagner Branch (D), Spooks Branch (E), Rice Branch (F), Gill Branch (G). Display/hide their locations on the map
2,402 married couples with children.
910 single-parent households (216 men, 694 women).
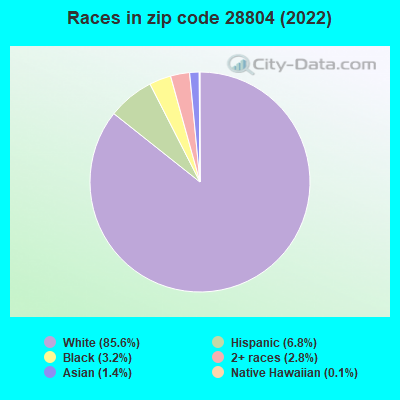
92.7% of residents of 28804 zip code speak English at home.
4.8% of residents speak Spanish at home (68% very well, 16% well, 12% not well, 4% not at all).
2.0% of residents speak other Indo-European language at home (89% very well, 8% well, 3% not well).
0.5% of residents speak Asian or Pacific Island language at home (23% very well, 68% well, 9% not well).
0.1% of residents speak other language at home (100% very well).
Foreign born population: 1,666 (6.6%) (53.4% of them are naturalized citizens)
This zip code:
6.6%
Whole state:
8.6%
22%Singapore
14%Honduras
11%Romania
5%El Salvador
5%France
5%Chile
4%Sweden
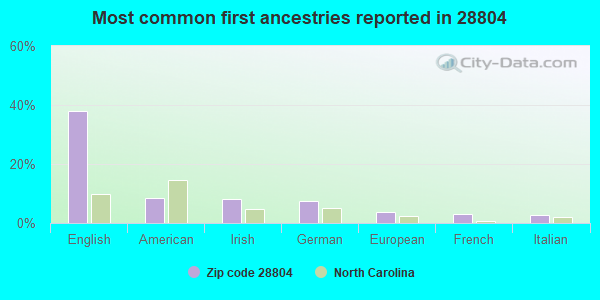
38%English
9%American
8%Irish
7%German
4%European
3%French
3%Italian
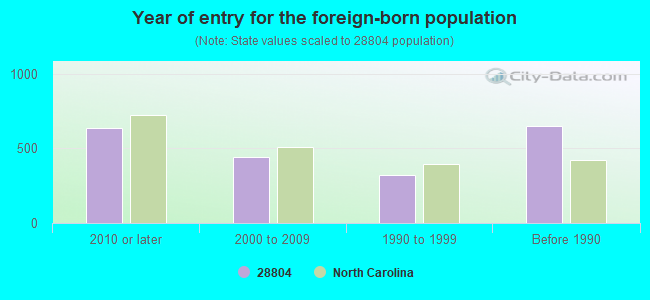
Year of entry for the foreign-born population
6332010 or later
4412000 to 2009
3231990 to 1999
648Before 1990
Facilities with environmental interests located in this zip code:
BUNCOMBE COUNTY LANDFILL (HIGHWAY 251 in ASHEVILLE, NC)
STATE MASTER (North Carolina facility info) - UNDERGROUND STORAGE TANK PROGRAM CRITERIA AND HAZARDOUS AIR POLLUTANT INVENTORY (Inventory of air pollution sources) National Pollutant Discharge Elimination System NON-MAJOR (Tracking pollutant discharge elimination systems) - permit Business SIC classification: REFUSE SYSTEMS; NONCLASSIFIABLE ESTABLISHMENTS Alternative names: BUNCOMBE CO-SANITARY LANDFILL
AUSTIN POWDER COMPANY (450 GOLDVIEW ROAD in ASHEVILLE, NC)
Conditionally Exempt Small Quantity Generators, less than 100 kg/month of hazardous waste (Resource Conservation and Recovery Act (tracking hazardous waste)) - notification (Resource Conservation and Recovery Act (tracking hazardous waste)) Organizations: JOHN HOLLAND (CONTACT/OWNER)
Alternative names: AUSTIN POWER COMPANY
ASHEVILLE METRO SEWERAGE DISTRICT (NC HWY 191 N AT WOODFIN in ASHEVILLE, NC)
(Resource Conservation and Recovery Act (tracking hazardous waste)) Organizations: METROPOLITAN SEWERAGE DISTRICT OF BUN CO (CONTACT/OWNER)
CITY OF ASHEVILLE TRAFFIC ENG (300 MERRIMON AVE in ASHEVILLE, NC)
(Resource Conservation and Recovery Act (tracking hazardous waste))
BUNCOMBE COUNTY SCHOOL BUS GARAGE (74 WASHINGTON AVE in ASHEVILLE, NC)
Conditionally Exempt Small Quantity Generators, less than 100 kg/month of hazardous waste (Resource Conservation and Recovery Act (tracking hazardous waste)) - notification Organizations: BUNCOMBE CO. BD. EDUC. (CONTACT/OWNER)
Housing units lacking complete plumbing facilities: 3.9% Housing units lacking complete kitchen facilities: 3.6%
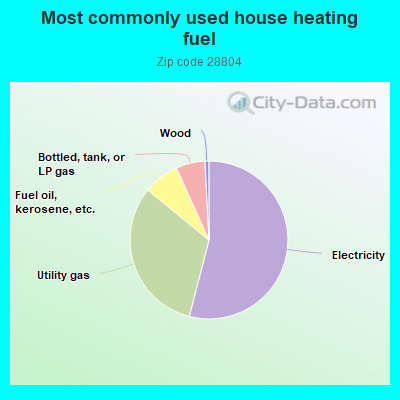
53.6%Electricity
31.6%Utility gas
7.3%Fuel oil, kerosene, etc.
5.9%Bottled, tank, or LP gas
0.8%Wood
Population in 1990: 16,709. Population change in the 1990s: +2,598 (+15.5%).
Place of birth for U.S.-born residents:
This state: 10,651
Northeast: 3,030
Midwest: 2,464
South: 6,004
West: 1,178
55% of the 28804 zip code residents lived in the same house 5 years ago. Out of people who lived in different houses, 45% lived in this county. Out of people who lived in different counties, 50% lived in North Carolina.
86% of the 28804 zip code residents lived in the same house 1 year ago. Out of people who lived in different houses, 39% moved from this county. Out of people who lived in different houses, 26% moved from different county within same state. Out of people who lived in different houses, 31% moved from different state. Out of people who lived in different houses, 3% moved from abroad.
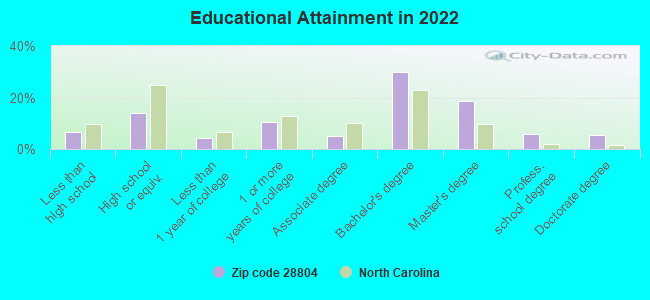
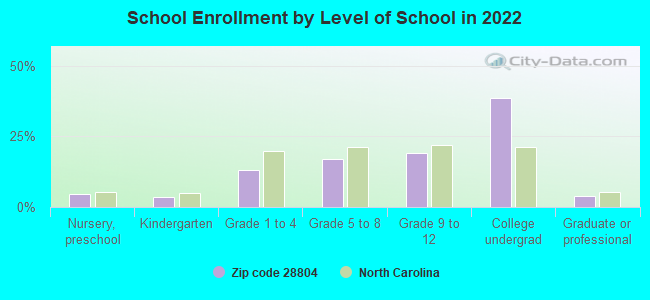
Private vs. public school enrollment:
Students in private schools in grades 1 to 8 (elementary and middle school): 367
Here:
21.9%
North Carolina:
13.8%
Students in private schools in grades 9 to 12 (high school): 136
Here:
12.7%
North Carolina:
11.9%
Students in private undergraduate colleges: 391
Here:
18.4%
North Carolina:
19.3%
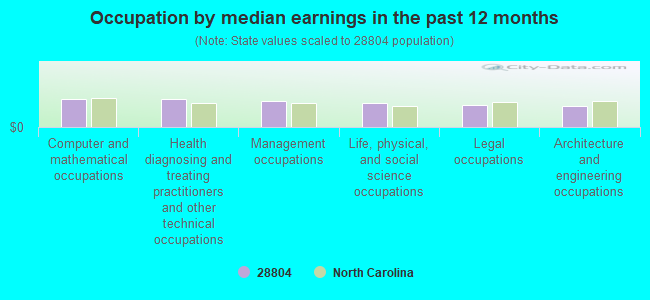
Occupation by median earnings in the past 12 months ($)
96,528Computer and mathematical occupations
95,302Health diagnosing and treating practitioners and other technical occupations
88,326Management occupations
82,447Life, physical, and social science occupations
75,915Legal occupations
73,547Architecture and engineering occupations
Companies with federal contracts located in this zip code (ASHEVILLE, NC):
MILLS MANUFACTURING CORPORATIO (22 MILLS PLACE; small business) : $75,390,709 in 142 contractsfrom 1999 to 2006
Contracts for Parachutes; Aerial Pick Up, Delivery, Recovery Systems; and Cargo Tie Down Equipment, Ammunition, over 125 mm, Ammunition, 75 mm through 125 mm, Specialized Flight Clothing and Accessories by Army, Defense Logistics Agency, Department of Defense, Navy, and others Signed by year:2000: $3,073,078; 2001: $13,167,550; 2002: $7,257,037; 2003: $35,408,361; 2004: $2,106,457; 2005: $4,768,264; 2006: $5,522,562.
Biggest contracts:
$5,855,600 with Army for Parachutes; Aerial Pick Up, Delivery, Recovery Systems; and Cargo Tie Down Equipment. Signed on 2003-08-14. Completion date: 2007-08-31.
$5,472,910, same as above.Signed on 2006-04-20. Completion date: 2011-04-30.
$5,097,548, same as above.Signed on 2003-03-26. Completion date: 2007-08-30.
$4,996,057, same as above.Signed on 2003-12-11. Completion date: 2006-06-30.
MILLS MANUFACTURING CORPORATIO (22 MILLS PLACE; small business) : $1,045,261 in 10 contractsfrom 2000 to 2005
Contracts for Parachutes; Aerial Pick Up, Delivery, Recovery Systems; and Cargo Tie Down Equipment, Fiber Rope, Cordage, and Twine, Technical Representation Services -- Aircraft Components and Accessories by Army, Defense Logistics Agency, Air Force Signed by year:2000: $480,705; 2001: $386,980; 2002: $28,288; 2003: $0; 2004: $0; 2005: $149,288; 2006: $0.
Biggest contracts:
$338,800 with Army for Parachutes; Aerial Pick Up, Delivery, Recovery Systems; and Cargo Tie Down Equipment. Signed on 2000-09-15. Completion date: 2002-01-10.
$287,560 with Defense Logistics Agency for Fiber Rope, Cordage, and Twine. Signed on 2001-07-24. Completion date: 2002-01-05.
$129,600 with Army for Parachutes; Aerial Pick Up, Delivery, Recovery Systems; and Cargo Tie Down Equipment. Signed on 2005-07-14. Completion date: 2005-08-30.
$99,420 with Defense Logistics Agency for Fiber Rope, Cordage, and Twine. Signed on 2001-04-04. Completion date: 2001-07-10.
KCB CONSTRUCTION COMPANY, INC (325 AIKEN RD; small business) : $617,660 in 3 contractsfrom 2002 to 2003
$611,000 with Army for Construction of Structures and Facilities -- Other Industrial Buildings. Taking place in GA. Signed on 2002-11-07. Completion date: 2002-12-30.
$4,560, same as above.Signed on 2003-09-10. Completion date: 2003-09-15.
$2,100, same as above.Signed on 2003-05-21. Completion date: 2002-12-30.
PALMER INSTRUMENTS, INC (234 OLD WEAVERVILLE ROAD; small business) : $362,393 in 16 contractsfrom 2004 to 2006
Contracts for Pressure, Temperature, and Humidity Measuring and Controlling Instruments by National Oceanic and Atmospheric Administration/Under Secretary for Oceans and Atmosphere, Defense Logistics Agency Signed by year:2000: $0; 2001: $0; 2002: $0; 2003: $0; 2004: $140,708; 2005: $172,926; 2006: $48,759.
Biggest contracts:
$47,100 with National Oceanic and Atmospheric Administration/Under Secretary for Oceans and Atmosphere for Pressure, Temperature, and Humidity Measuring and Controlling Instruments. Signed on 2005-03-22. Completion date: 2005-05-31.
$37,824 with Defense Logistics Agency for Pressure, Temperature, and Humidity Measuring and Controlling Instruments. Signed on 2004-12-30. Completion date: 2005-04-11.
$29,990, same as above.Signed on 2004-02-18. Completion date: 2004-05-30.
$27,542, same as above.Signed on 2004-06-22. Completion date: 2004-10-02.
REVCO TECHNOLOGIES INC, A UNIT (275 AIKEN ROAD; small business) : $220,954 in 11 contractsfrom 2000 to 2003
Contracts for Medical and Surgical Instruments, Equipment, and Supplies, Refrigeration Equipment, Laboratory Equipment and Supplies by Department of Veterans Affairs, Army, Navy Signed by year:2000: $140,450; 2001: $0; 2002: $50,351; 2003: $30,153; 2004: $0; 2005: $0; 2006: $0.
Biggest contracts:
$84,000 with Department of Veterans Affairs for Medical and Surgical Instruments, Equipment, and Supplies. Taking place in NY. Signed on 2000-07-15. Completion date: 2000-11-15.
$30,345 with Army for Refrigeration Equipment. Signed on 2002-09-16. Completion date: 2002-09-27.
$29,770 with Army for Medical and Surgical Instruments, Equipment, and Supplies. Taking place in NY. Signed on 2000-09-23. Completion date: 2000-11-30.
$26,680, same as above.Signed on 2000-09-16. Completion date: 2000-09-30.
REVCO TECHNOLOGIES INC, A UNIT (275 AIKEN ROAD) : $189,588 in 8 contractsfrom 2000 to 2002
Contracts for Laboratory Equipment and Supplies, Refrigeration Equipment, Kitchen Equipment and Appliances by Public Buildings Service, Army, Navy Signed by year:2000: $81,000; 2001: $0; 2002: $108,588; 2003: $0; 2004: $0; 2005: $0; 2006: $0.
Biggest contracts:
$111,000 with Public Buildings Service for Laboratory Equipment and Supplies. Taking place in GA. Signed on 2000-08-15. Completion date: 2000-09-15.
$31,615 with Army for Refrigeration Equipment. Signed on 2002-03-25. Completion date: 2002-04-30.
$29,568 with Navy for Laboratory Equipment and Supplies. Signed on 2002-09-30. Completion date: 2002-10-30.
$28,257 with Army for Laboratory Equipment and Supplies. Signed on 2002-08-16. Completion date: 2002-09-27.
KEITH A BEARLEY (177 MACON AVE; small business) : $70,910 in 2 contractsin 2006
$41,404 with Navy for Other Professional Services. Taking place in VA. Signed on 2006-03-15. Completion date: 2006-06-30.
$29,506, same as above.Signed on 2006-06-13. Completion date: 2006-06-30.
PRECISION CLEANING SERVICE INC (1125 RIVERSIDE DR; small business)
$19,140 with Navy for Custodial Janitorial Services. Signed on 2005-12-22. Completion date: 2006-12-21.
GROVE PARK INN RESORT SPA, THE (290 MACON AVE) : $15,320 in 5 contractsin 2005
Contracts for Food Services, , Education Services by Army, Drug Enforcement Administration Signed by year:2000: $0; 2001: $0; 2002: $0; 2003: $0; 2004: $0; 2005: $15,320; 2006: $0.
Biggest contracts:
$5,444 with Army for Food Services. Signed on 2005-07-22. Completion date: 2005-08-01.
$4,860 with Drug Enforcement Administration for . Taking place in GA. Signed on 2005-06-30. Completion date: 2005-08-19.
$3,411 with Drug Enforcement Administration for Education Services. Taking place in GA. Signed on 2005-06-30. Completion date: 2005-08-18.
$1,005 with Drug Enforcement Administration for . Taking place in GA. Signed on 2005-06-30. Completion date: 2005-08-19.
ALAN RICHEY (2000 RIVERSIDE DRIVE BOX 2; small business) : -$6,250 in 2 contractsin 2000
$0 with Navy for Maintenance, Repair or Alteration of Real Property -- Other Non-Building Facilities. Taking place in FL. Signed on 2000-03-16. Completion date: 1999-02-19.
-$6,250, same as above.Signed on 2000-03-16. Completion date: 1999-02-19.
Top industries in this zip code by the number of employees in 2005:
2002 - 2018 National Fire Incident Reporting System (NFIRS) incidents
Based on the data from the years 2002 - 2018 the average number of fires per year is 55. The highest number of reported fires - 106 took place in 2014, and the least - 13 in 2003. The data has a rising trend.
When looking into fire subcategories, the most reports belonged to: Structure Fires (55.0%), and Outside Fires (30.4%).
Fire incident types reported to NFIRS in Zip Code 28804


 Nearest zip codes: 28801, 28805, 28806, 28701, 28787, 28803.


 Based on the data from the years 2002 - 2018 the average number of fires per year is 55. The highest number of reported fires - 106 took place in 2014, and the least - 13 in 2003. The data has a rising trend.
 When looking into fire subcategories, the most reports belonged to: Structure Fires (55.0%), and Outside Fires (30.4%).