Estimated zip code population in 2022: 13,792 Zip code population in 2010: 15,019 Zip code population in 2000: 13,580
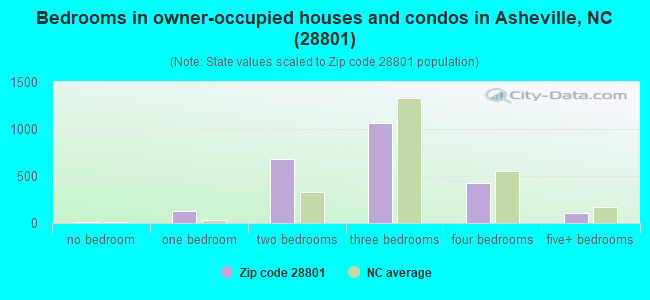
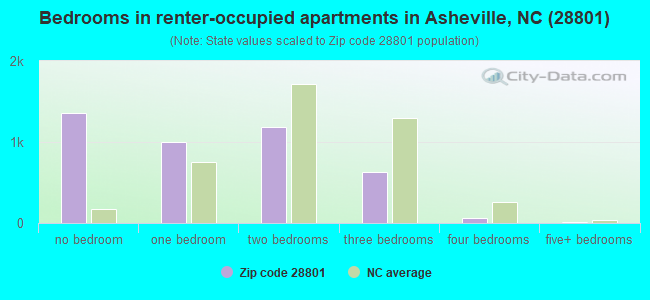
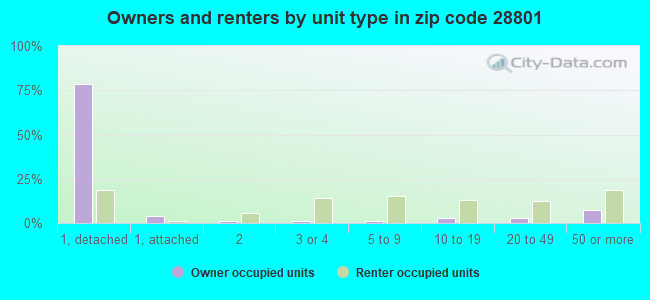
Houses and condos: 8,747 Renter-occupied apartments: 4,172
% of renters here:
63%
State:
33%
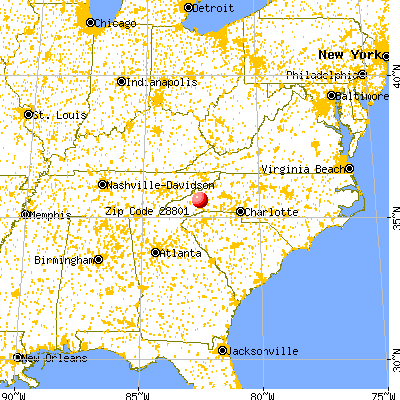
March 2022 cost of living index in zip code 28801: 97.2 (near average, U.S. average is 100)
Land area: 5.1 sq. mi. Water area: 0.1 sq. mi.
Population density: 2,714 people per square mile
(average).
OSM Map
General Map
Google Map
MSN Map
OSM Map
General Map
Google Map
MSN Map
OSM Map
General Map
Google Map
MSN Map
OSM Map
General Map
Google Map
MSN Map
Please wait while loading the map...
Real estate property taxes paid for housing units in 2022:
This zip code:
0.7% ($3,638)
North Carolina:
0.6% ($1,769)
Median real estate property taxes paid for housing units with mortgages in 2022: $3,453 (0.6%) Median real estate property taxes paid for housing units with no mortgage in 2022: $3,817 (0.7%)
Averages for the 2020 tax year for zip code 28801, filed in 2021:
Average Adjusted Gross Income (AGI) in 2020: $69,952 (Individual Income Tax Returns)
Here:
$69,952
State:
$70,020
Salary/wage: $49,518 (reported on 80.0% of returns)
Here:
$49,518
State:
$58,387
(% of AGI for various income ranges: 1147.1% for AGIs below $25k, 3790.9% for AGIs $25k-50k, 6965.3% for AGIs $50k-75k, 10490.9% for AGIs $75k-100k, 17887.7% for AGIs $100k-200k, 81694.2% for AGIs over 200k)
Taxable interest for individuals: $2,900 (reported on 32.2% of returns)
This zip code:
$2,900
North Carolina:
$1,479
(% of AGI for various income ranges: 12.8% for AGIs below $25k, 22.4% for AGIs $25k-50k, 94.3% for AGIs $50k-75k, 79.6% for AGIs $75k-100k, 342.6% for AGIs $100k-200k, 3750.8% for AGIs over 200k)
Ordinary dividends: $14,244 (reported on 23.3% of returns)
Here:
$14,244
State:
$7,888
(% of AGI for various income ranges: 40.0% for AGIs below $25k, 78.8% for AGIs $25k-50k, 269.6% for AGIs $50k-75k, 540.9% for AGIs $75k-100k, 1350.3% for AGIs $100k-200k, 12828.3% for AGIs over 200k)
Net capital gain/loss in AGI: +$35,621 (reported on 22.5% of returns)
Here:
+$35,621
State:
+$23,652
(% of AGI for various income ranges: 17.5% for AGIs below $25k, 81.8% for AGIs $25k-50k, 361.0% for AGIs $50k-75k, 852.2% for AGIs $75k-100k, 2014.2% for AGIs $100k-200k, 38839.2% for AGIs over 200k)
Profit/loss from business: +$15,875 (reported on 21.5% of returns)
Here:
+$15,875
State:
+$11,710
(% of AGI for various income ranges: 173.8% for AGIs below $25k, 239.1% for AGIs $25k-50k, 523.3% for AGIs $50k-75k, 652.2% for AGIs $75k-100k, 1859.4% for AGIs $100k-200k, 6628.3% for AGIs over 200k)
Taxable individual retirement arrangement distribution: $24,197 (reported on 8.3% of returns)
28801:
$24,197
North Carolina:
$20,247
(% of AGI for various income ranges: 30.0% for AGIs below $25k, 78.4% for AGIs $25k-50k, 244.1% for AGIs $50k-75k, 677.4% for AGIs $75k-100k, 1383.5% for AGIs $100k-200k, 4807.5% for AGIs over 200k)
Self-employed (Keogh) retirement plans: $17,362 (reported on 1.1% of returns)
28801:
$17,362
North Carolina:
$26,749
(% of AGI for various income ranges: 17.9% for AGIs $25k-50k, 123.5% for AGIs $100k-200k, 637.5% for AGIs over 200k)
Total itemized deductions: $36,286 (reported on 9.0% of returns)
Here:
$36,286
State:
$34,549
(% of AGI for various income ranges: 38.5% for AGIs below $25k, 120.7% for AGIs $25k-50k, 519.4% for AGIs $50k-75k, 826.1% for AGIs $75k-100k, 1798.1% for AGIs $100k-200k, 9255.0% for AGIs over 200k)
Charity contributions: $14,174 (reported on 7.4% of returns)
Here:
$14,174
State:
$13,360
(% of AGI for various income ranges: 22.8% for AGIs $25k-50k, 72.2% for AGIs $50k-75k, 152.6% for AGIs $75k-100k, 505.8% for AGIs $100k-200k, 4227.5% for AGIs over 200k)
Taxes paid: $7,973 (reported on 8.8% of returns)
28801:
$7,973
State:
$7,586
(% of AGI for various income ranges: 6.4% for AGIs below $25k, 23.2% for AGIs $25k-50k, 109.2% for AGIs $50k-75k, 252.2% for AGIs $75k-100k, 485.5% for AGIs $100k-200k, 1693.3% for AGIs over 200k)
Earned income credit: $1,596 (reported on 18.7% of returns)
Here:
$1,596
State:
$2,337
(% of AGI for various income ranges: 77.8% for AGIs below $25k, 36.4% for AGIs $25k-50k)
Percentage of individuals using paid preparers for their 2020 taxes: 93.0%
Here:
93%
State:
93%
(% for various income ranges: 92.6% for AGIs below $25k, 92.6% for AGIs $25k-50k, 93.8% for AGIs $50k-75k, 92.9% for AGIs $75k-100k, 94.1% for AGIs $100k-200k, 93.6% for AGIs over 200k)
Averages for the 2012 tax year for zip code 28801, filed in 2013:
Average Adjusted Gross Income (AGI) in 2012: $46,182 (Individual Income Tax Returns)
Here:
$46,182
State:
$54,937
Salary/wage: $34,782 (reported on 82.7% of returns)
Here:
$34,782
State:
$46,336
(% of AGI for various income ranges: 79.2% for AGIs below $25k, 78.8% for AGIs $25k-50k, 71.2% for AGIs $50k-75k, 66.9% for AGIs $75k-100k, 60.8% for AGIs $100k-200k, 41.7% for AGIs over 200k)
Taxable interest for individuals: $2,180 (reported on 29.9% of returns)
This zip code:
$2,180
North Carolina:
$1,298
(% of AGI for various income ranges: 0.7% for AGIs below $25k, 0.7% for AGIs $25k-50k, 0.9% for AGIs $50k-75k, 1.3% for AGIs $75k-100k, 1.2% for AGIs $100k-200k, 2.5% for AGIs over 200k)
Ordinary dividends: $7,811 (reported on 19.2% of returns)
Here:
$7,811
State:
$6,213
(% of AGI for various income ranges: 1.6% for AGIs below $25k, 1.9% for AGIs $25k-50k, 3.1% for AGIs $50k-75k, 4.4% for AGIs $75k-100k, 3.7% for AGIs $100k-200k, 4.2% for AGIs over 200k)
Net capital gain/loss in AGI: +$19,381 (reported on 16.8% of returns)
Here:
+$19,381
State:
+$12,740
(% of AGI for various income ranges: 0.6% for AGIs below $25k, 0.9% for AGIs $25k-50k, 2.2% for AGIs $50k-75k, 3.3% for AGIs $75k-100k, 4.9% for AGIs $100k-200k, 17.6% for AGIs over 200k)
Profit/loss from business: +$13,318 (reported on 20.4% of returns)
Here:
+$13,318
State:
+$10,311
(% of AGI for various income ranges: 9.7% for AGIs below $25k, 4.9% for AGIs $25k-50k, 6.2% for AGIs $50k-75k, 6.6% for AGIs $75k-100k, 8.6% for AGIs $100k-200k, 2.8% for AGIs over 200k)
Taxable individual retirement arrangement distribution: $20,124 (reported on 7.0% of returns)
28801:
$20,124
North Carolina:
$15,575
(% of AGI for various income ranges: 1.5% for AGIs below $25k, 1.6% for AGIs $25k-50k, 4.2% for AGIs $50k-75k, 4.0% for AGIs $75k-100k, 5.1% for AGIs $100k-200k, 2.8% for AGIs over 200k)
Self-employment retirement plans: $14,400 (reported on 0.8% of returns)
28801:
$14,400
North Carolina:
$21,078
Total itemized deductions: $23,633 (20% of AGI, reported on 25.9% of returns)
Here:
$23,633
State:
$23,438
Here:
20.4% of AGI
State:
21.5% of AGI
(% of AGI for various income ranges: 8.1% for AGIs below $25k, 11.8% for AGIs $25k-50k, 16.6% for AGIs $50k-75k, 18.2% for AGIs $75k-100k, 17.1% for AGIs $100k-200k, 11.5% for AGIs over 200k)
Charity contributions: $3,641 (reported on 21.2% of returns)
Here:
$3,641
State:
$4,687
(% of AGI for various income ranges: 0.8% for AGIs below $25k, 1.4% for AGIs $25k-50k, 2.0% for AGIs $50k-75k, 2.4% for AGIs $75k-100k, 2.4% for AGIs $100k-200k, 1.5% for AGIs over 200k)
Taxes paid: $9,423 (reported on 25.5% of returns)
28801:
$9,423
State:
$8,823
(% of AGI for various income ranges: 1.3% for AGIs below $25k, 2.9% for AGIs $25k-50k, 5.2% for AGIs $50k-75k, 6.4% for AGIs $75k-100k, 7.3% for AGIs $100k-200k, 6.7% for AGIs over 200k)
Earned income credit: $1,643 (reported on 24.8% of returns)
Here:
$1,643
State:
$2,376
(% of AGI for various income ranges: 5.4% for AGIs below $25k, 0.6% for AGIs $25k-50k)
Percentage of individuals using paid preparers for their 2012 taxes: 43.3%
Here:
43%
State:
53%
(% for various income ranges: 37.8% for AGIs below $25k, 39.0% for AGIs $25k-50k, 52.9% for AGIs $50k-75k, 61.8% for AGIs $75k-100k, 65.8% for AGIs $100k-200k, 77.8% for AGIs over 200k)
Averages for the 2004 tax year for zip code 28801, filed in 2005:
Average Adjusted Gross Income (AGI) in 2004: $31,230 (Individual Income Tax Returns)
Here:
$31,230
State:
$45,376
Salary/wage: $25,668 (reported on 84.8% of returns)
Here:
$25,668
State:
$39,442
(% of AGI for various income ranges: 108.4% for AGIs below $10k, 84.3% for AGIs $10k-25k, 81.0% for AGIs $25k-50k, 72.8% for AGIs $50k-75k, 72.8% for AGIs $75k-100k, 48.0% for AGIs over 100k)
Taxable interest for individuals: $2,157 (reported on 31.3% of returns)
This zip code:
$2,157
North Carolina:
$1,515
(% of AGI for various income ranges: 2.8% for AGIs below $10k, 1.0% for AGIs $10k-25k, 1.3% for AGIs $25k-50k, 1.3% for AGIs $50k-75k, 1.8% for AGIs $75k-100k, 3.7% for AGIs over 100k)
Taxable dividends: $4,826 (reported on 18.6% of returns)
Here:
$4,826
State:
$4,016
(% of AGI for various income ranges: 2.6% for AGIs below $10k, 1.0% for AGIs $10k-25k, 1.6% for AGIs $25k-50k, 2.7% for AGIs $50k-75k, 2.4% for AGIs $75k-100k, 5.0% for AGIs over 100k)
Net capital gain/loss: +$12,215 (reported on 15.6% of returns)
Here:
+$12,215
State:
+$11,152
(% of AGI for various income ranges: -0.8% for AGIs below $10k, 0.6% for AGIs $10k-25k, 1.3% for AGIs $25k-50k, 2.8% for AGIs $50k-75k, 4.6% for AGIs $75k-100k, 14.6% for AGIs over 100k)
Profit/loss from business: +$11,270 (reported on 16.8% of returns)
Here:
+$11,270
State:
+$9,490
(% of AGI for various income ranges: 7.9% for AGIs below $10k, 4.9% for AGIs $10k-25k, 4.5% for AGIs $25k-50k, 7.1% for AGIs $50k-75k, 6.6% for AGIs $75k-100k, 7.1% for AGIs over 100k)
IRA payment deduction: $2,443 (reported on 2.4% of returns)
28801:
$2,443
North Carolina:
$2,967
(% of AGI for various income ranges: 0.3% for AGIs below $10k, 0.2% for AGIs $10k-25k, 0.2% for AGIs $25k-50k, 0.2% for AGIs $50k-75k, 0.3% for AGIs $75k-100k, 0.1% for AGIs over 100k)
Self-employed pension: $10,535 (reported on 0.8% of returns)
Here:
$10,535
North Carolina:
$14,754
Total itemized deductions: $19,008 (24% of AGI, reported on 23.6% of returns)
Here:
$19,008
State:
$19,464
Here:
24.1% of AGI
State:
22.7% of AGI
(% of AGI for various income ranges: 15.3% for AGIs below $10k, 8.3% for AGIs $10k-25k, 13.4% for AGIs $25k-50k, 18.7% for AGIs $50k-75k, 20.4% for AGIs $75k-100k, 15.3% for AGIs over 100k)
Charity contributions deductions: $3,579 (4% of AGI, reported on 20.1% of returns)
Here:
$3,579
State:
$4,035
Here:
4.2% of AGI
State:
4.5% of AGI
(% of AGI for various income ranges: 0.8% for AGIs below $10k, 1.0% for AGIs $10k-25k, 2.0% for AGIs $25k-50k, 2.7% for AGIs $50k-75k, 3.3% for AGIs $75k-100k, 3.0% for AGIs over 100k)
Total tax: $5,558 (reported on 65.4% of returns)
28801:
$5,558
State:
$7,257
(% of AGI for various income ranges: 2.7% for AGIs below $10k, 4.4% for AGIs $10k-25k, 7.8% for AGIs $25k-50k, 10.4% for AGIs $50k-75k, 11.0% for AGIs $75k-100k, 19.8% for AGIs over 100k)
Earned income credit: $1,423 (reported on 28.2% of returns)
Here:
$1,423
State:
$1,851
Percentage of individuals using paid preparers for their 2004 taxes: 52.4%
Here:
52%
State:
62%
(% for various income ranges: 48.3% for AGIs below $10k, 50.7% for AGIs $10k-25k, 50.6% for AGIs $25k-50k, 62.4% for AGIs $50k-75k, 61.3% for AGIs $75k-100k, 82.8% for AGIs over 100k)
Likely homosexual households (counted as self-reported same-sex unmarried-partner households)
Lesbian couples: 0.0% of all households
Gay men: 0.5% of all households
Household received Food Stamps/SNAP in the past 12 months: 1,310 Household did not receive Food Stamps/SNAP in the past 12 months: 5,366
Women who had a birth in the past 12 months: 55 (29 now married, 24 unmarried) Women who did not have a birth in the past 12 months: 3,282 (722 now married, 2,545 unmarried)
Housing units in zip code 28801 with a mortgage: 1,513 (149 second mortgage, 137 both second mortgage and home equity loan) Houses without a mortgage: 72
Median monthly owner costs for units with a mortgage: $1,814 Median monthly owner costs for units without a mortgage: $661
Residents with income below the poverty level in 2022:
This zip code:
21.8%
Whole state:
12.8%
Residents with income below 50% of the poverty level in 2022:
This zip code:
12.8%
Whole state:
6.8%
Median number of rooms in houses and condos:
Here:
6.3
State:
6.4
Median number of rooms in apartments:
Here:
3.2
State:
4.4
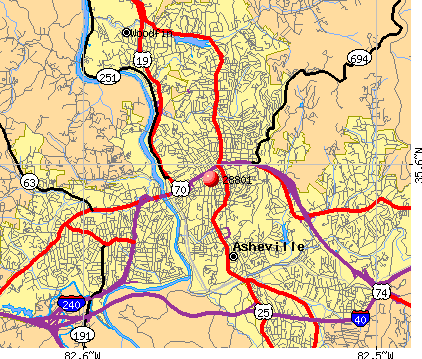
Notable locations in this zip code not listed on our city pages
Parks in zip code 28801 include: Memorial Stadium (1), Walton Street Park (2), Murry Hill Park (3), Patton Avenue Park (4), Montford Park (5), Weaver Park (6), Aston Park (7). Display/hide their locations on the map
Tourist attractions (not listed on the city page) : Carolina Coin Amusement CO Inc (Amusement & Theme Parks; Video Games), Carter Student Travel (29 North Market Street), Chappell Carter Enterprises LLC (29 North Market Street), Asheville Area Chamber of Commerce (151 Haywood Street).
733 married couples with children.
556 single-parent households (168 men, 388 women).
95.9% of residents of 28801 zip code speak English at home.
2.3% of residents speak Spanish at home (78% very well, 13% well, 9% not well).
1.0% of residents speak other Indo-European language at home (94% very well, 6% well).
0.4% of residents speak Asian or Pacific Island language at home (35% very well, 31% well, 33% not well).
0.1% of residents speak other language at home (70% very well, 30% well).
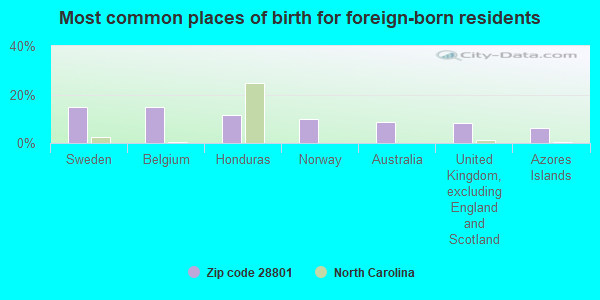
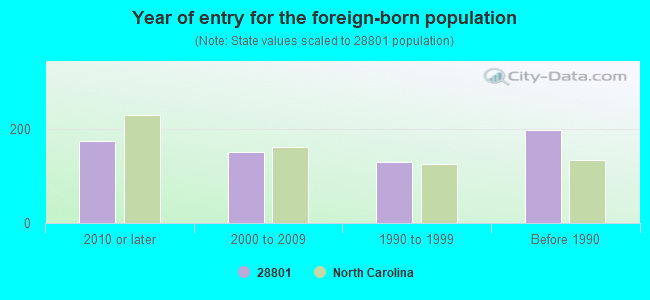
Foreign born population: 506 (3.7%) (45.9% of them are naturalized citizens)
Major facilities with environmental interests located in this zip code:
ASHEVILLE HIGH SCHOOL (419 MCDOWELL ST in ASHEVILLE, NC)
STATE MASTER (North Carolina facility info) - UNDERGROUND STORAGE TANK PROGRAM (National Center for Education Statistics) - STATE ID-302 Conditionally Exempt Small Quantity Generators, less than 100 kg/month of hazardous waste (Resource Conservation and Recovery Act (tracking hazardous waste)) Business SIC classification: NONCLASSIFIABLE ESTABLISHMENTS Organizations: MIKE DAVIS (CONTACT/OPERATOR)
, ASHEVILLE CITY BOARD OF EDUCATION (CONTACT/OWNER)
, ASHEVILLE CITY SCHOOLS (SCHOOL DISTRICT)
DICKSON ELEMENTARY (125 HILL STREET in ASHEVILLE, NC)
STATE MASTER (North Carolina facility info) - UNDERGROUND STORAGE TANK PROGRAM (National Center for Education Statistics) - STATE ID-306 Business SIC classification: NONCLASSIFIABLE ESTABLISHMENTS Organizations: ASHEVILLE CITY SCHOOLS (SCHOOL DISTRICT)
ASHEVILLE CITY-TRANSIT CENTER (360 W HAYWOOD ST in ASHEVILLE, NC)
STATE MASTER (North Carolina facility info) - UNDERGROUND STORAGE TANK PROGRAM National Pollutant Discharge Elimination System NON-MAJOR (Tracking pollutant discharge elimination systems) - permit Small Quantity Generators, between 100 kg and 1000 kg of hazardous waste/month (Resource Conservation and Recovery Act (tracking hazardous waste)) Business SIC classification: LOCAL AND SUBURBAN TRANSIT; NONCLASSIFIABLE ESTABLISHMENTS Organizations: ASHEVILLE TRANSIT SYSTEM (CONTACT/OPERATOR)
, ASHEVILLE TRANSIT (CONTACT/OWNER)
Alternative names: ASHEVILLE TRANSIT, ASHEVILLE TRANSIT AUTHORITY
ANDY OXY CO (27 HERITAGE DR in ASHEVILLE, NC)
STATE MASTER (North Carolina facility info) - UNDERGROUND STORAGE TANK PROGRAM (Resource Conservation and Recovery Act (tracking hazardous waste)) Business SIC classification: NONCLASSIFIABLE ESTABLISHMENTS Organizations: JAMES ANDERSON (CONTACT/OWNER)
BILTMORE PRESS INC (205 COLLEGE ST in ASHEVILLE, NC)
STATE MASTER (North Carolina facility info) - UNDERGROUND STORAGE TANK PROGRAM (Resource Conservation and Recovery Act (tracking hazardous waste)) Business SIC classification: NONCLASSIFIABLE ESTABLISHMENTS Organizations: ROBERT WILLIAMS (CONTACT/OWNER)
BILTMORE COMPANY FISH HATC (LONG VALLEY LAKE DAM in BILTMORE ESTATE, NC)
STATE MASTER (North Carolina facility info) - -66AN2CF0003TFWA489NT0A08P4, WASTEWATER FACILITY National Pollutant Discharge Elimination System NON-MAJOR (Tracking pollutant discharge elimination systems) - permit Business SIC classification: ANIMAL SPECIALTIES Alternative names: BILTMORE COMPANY FISH HATCHER, BILTMORE EST BILTMORE CO FISH
ASHEVILLE CLEANERS AND DYERS. I (230 MERRIMAN AVENUE in ASHEVILLE, NC)
STATE MASTER (North Carolina facility info) - UNDERGROUND STORAGE TANK PROGRAM Small Quantity Generators, between 100 kg and 1000 kg of hazardous waste/month (Resource Conservation and Recovery Act (tracking hazardous waste)) - notification Business SIC classification: NONCLASSIFIABLE ESTABLISHMENTS Organizations: ASHEVILLE CLEANERS AND DYERS INC (CONTACT/OWNER)
Alternative names: ASHEVILLE CLEANERS & DYERS INC
ACCELERATED LEARNING CENTER (90 MONTFORD AVENUE in ASHEVILLE, NC)
(National Center for Education Statistics) - STATE ID-301 Organizations: ASHEVILLE CITY SCHOOLS (SCHOOL DISTRICT)
ASHEVILLE MIDDLE (197 S FRENCH BROAD AVE in ASHEVILLE, NC)
(National Center for Education Statistics) - STATE ID-356 Organizations: ASHEVILLE CITY SCHOOLS (SCHOOL DISTRICT)
CLAXTON ELEMENTARY (241 MERRIMON AVE in ASHEVILLE, NC)
(National Center for Education Statistics) - STATE ID-312 Organizations: ASHEVILLE CITY SCHOOLS (SCHOOL DISTRICT)
ASHEVILLE CITY SCHOOLS (16 S BILTMORE AVE in ASHEVILLE, NC)
(Resource Conservation and Recovery Act (tracking hazardous waste)) Organizations: KEN SWAIN (CONTACT/OPERATOR)
, ASHEVILLE CITY BOARD OF EDUCATION (CONTACT/OWNER)
AAMCO TRANSMISSIONS (40 MCCORMICK PLACE in ASHEVILLE, NC)
CARQUEST AUTO PARTS-SRONCE (100 S LEXINGTON AVE in ASHEVILLE, NC)
(Resource Conservation and Recovery Act (tracking hazardous waste)) Organizations: GENERAL PARTS INC (CONTACT/OWNER)
Housing units lacking complete plumbing facilities: 1.5% Housing units lacking complete kitchen facilities: 3.1%
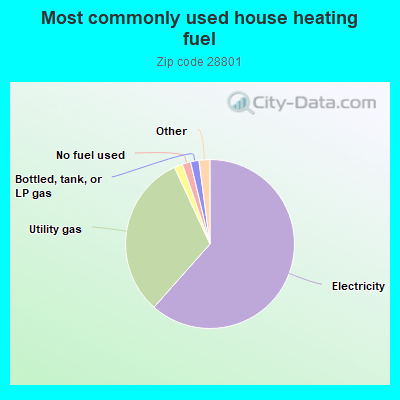
61.6%Electricity
31.6%Utility gas
1.6%Fuel oil, kerosene, etc.
1.6%No fuel used
1.6%Bottled, tank, or LP gas
0.7%Solar energy
0.7%Wood
0.6%Other fuel
Population in 1990: 13,316. Population change in the 1990s: +264 (+2.0%).
Place of birth for U.S.-born residents:
This state: 6,324
Northeast: 1,964
Midwest: 1,401
South: 2,863
West: 615
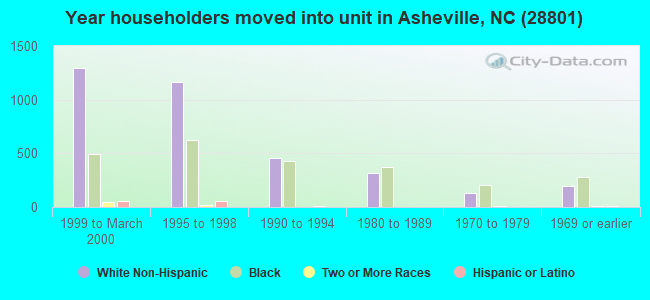
45% of the 28801 zip code residents lived in the same house 5 years ago. Out of people who lived in different houses, 49% lived in this county. Out of people who lived in different counties, 50% lived in North Carolina.
81% of the 28801 zip code residents lived in the same house 1 year ago. Out of people who lived in different houses, 37% moved from this county. Out of people who lived in different houses, 28% moved from different county within same state. Out of people who lived in different houses, 31% moved from different state. Out of people who lived in different houses, 1% moved from abroad.
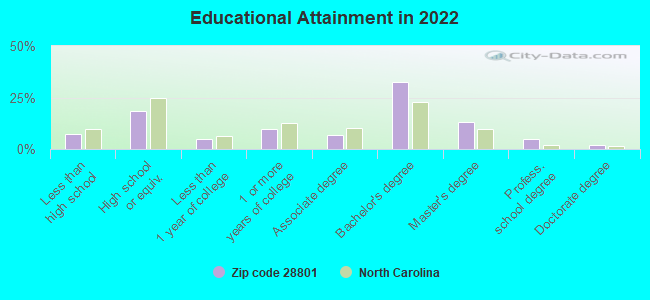
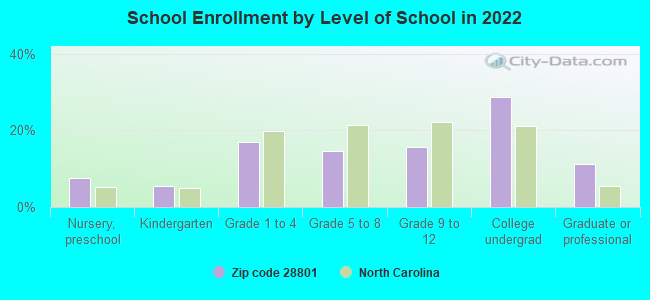
Private vs. public school enrollment:
Students in private schools in grades 1 to 8 (elementary and middle school): 103
Here:
15.1%
North Carolina:
13.8%
Students in private schools in grades 9 to 12 (high school): 34
Here:
10.0%
North Carolina:
11.9%
Students in private undergraduate colleges: 21
Here:
3.4%
North Carolina:
19.3%
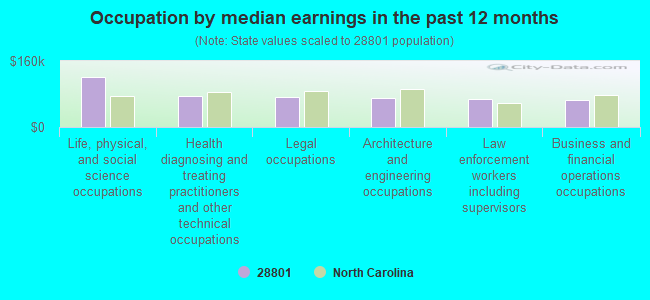
Occupation by median earnings in the past 12 months ($)
122,372Life, physical, and social science occupations
74,581Health diagnosing and treating practitioners and other technical occupations
73,887Legal occupations
70,313Architecture and engineering occupations
66,975Law enforcement workers including supervisors
66,580Business and financial operations occupations
Companies with federal contracts located in this zip code (ASHEVILLE, NC):
NEW LIGHT PRODUCTIONS INC A (20 BATTERY PARK AVE; small business) : $43,854 in 2 contractsin 2002
$30,755 with Army for Video Recording and Reproducing Equipment. Signed on 2002-09-12. Completion date: 2002-10-11.
$13,099 with Department of Defense for Radio and Television Communication Equipment, Except Airborne. Signed on 2002-09-20. Completion date: 2002-11-22.
YOUNG MEN'S CHRISTIAN ASSOCIAT (53 ASHELAND AVE STE 105; small business)
$39,216 with Air Force for Recreational Services. Signed on 2006-01-03. Completion date: 2007-01-02.
KELLER CONSULTING, INC. (265 CHARLOTTE STREET; small business)
$34,998 with Army for Technical Assistance. Signed on 2000-03-20. Completion date: 2001-03-30.
P V C INC (1 PAGE AVE STE 215) : $9,011 in 6 contractsfrom 2004 to 2005
Contracts for Lodging - Hotel/Motel, Lease or Rental of Facilities -- Conference Space and Facilities by Army, U.S. Army Corps of Engineers - civil program financing only Signed by year:2000: $0; 2001: $0; 2002: $0; 2003: $0; 2004: -$4,600; 2005: $13,611; 2006: $0.
Biggest contracts:
$13,465 with Army for Lodging - Hotel/Motel. Signed on 2005-11-16. Completion date: 2005-11-20.
$146, same as above.Signed on 2005-11-17. Completion date: 2005-11-20.
$0 with Army for Lease or Rental of Facilities -- Conference Space and Facilities. Signed on 2004-04-23. Completion date: 2003-05-09.
$0 with U.S. Army Corps of Engineers - civil program financing only for Lease or Rental of Facilities -- Conference Space and Facilities. Signed on 2004-04-23. Completion date: 2003-05-09.
NESBITT ASHVILLE VENTURE LLC (1 THOMAS WOLFE PLAZA; small business)
$8,800 with Army for Lodging - Hotel/Motel. Signed on 2005-01-19. Completion date: 2005-01-19.
ASHEVILLE TEACCH CENTER (46 HAYWOOD STREET, SUITE 4) : $7,845 in 2 contractsin 2003
$6,550 with Army for Educational Services. Taking place in KY. Signed on 2003-01-14. Completion date: 2003-01-15.
$1,295, same as above.Signed on 2003-04-23. Completion date: 2003-01-15.
STEVEN R LOVE, PH D (46 HAYWOOD STREET, SUITE 4; small business)
$5,044 with Army for Education Services. Taking place in KY. Signed on 2004-02-06. Completion date: 2004-02-05.
Top industries in this zip code by the number of employees in 2005:
Health Care and Social Assistance: Offices of Physicians (except Mental Health Specialists) (250-499 employees: 1 establishment, 100-249 employees: 2 establishments, 50-99 employees: 5 establishments, 20-49 employees: 22 establishments, 10-19 employees: 11 establishments, 5-9 employees: 19 establishments, 1-4 employees: 32 establishments)
Health Care and Social Assistance: General Medical and Surgical Hospitals (over 1000: 1)
Administrative and Support and Waste Management and Remediation Services: All Other Travel Arrangement and Reservation Services (500-999: 1)
Health Care and Social Assistance: Nursing Care Facilities (100-249: 4, 50-99: 1)
Administrative and Support and Waste Management and Remediation Services: Temporary Help Services (100-249: 1, 50-99: 4, 20-49: 3, 10-19: 3, 5-9: 1, 1-4: 5)
Other Services (except Public Administration): Civic and Social Organizations (250-499: 1, 10-19: 1, 5-9: 5, 1-4: 5)
People in group quarters in 2010:
722 people in hospitals with patients who have no usual home elsewhere
446 people in local jails and other municipal confinement facilities
260 people in nursing facilities/skilled-nursing facilities
186 people in emergency and transitional shelters (with sleeping facilities) for people experiencing homelessness
121 people in other noninstitutional facilities
46 people in group homes intended for adults
9 people in residential treatment centers for adults
5 people in residential treatment centers for juveniles (non-correctional)
People in group quarters in 2000:
457 people in local jails and other confinement facilities (including police lockups)
418 people in other noninstitutional group quarters
186 people in nursing homes
91 people in other group homes
90 people in other types of correctional institutions
56 people in homes or halfway houses for drug/alcohol abuse
48 people in orthopedic wards and institutions for the physically handicapped
12 people in hospitals/wards and hospices for chronically ill
12 people in hospices or homes for chronically ill
11 people in homes for the mentally retarded
6 people in hospitals or wards for drug/alcohol abuse
6 people in unknown juvenile institutions
5 people in religious group quarters
Fatal accident statistics in 2014:
Fatal accident count: 5
Vehicles involved in fatal accidents: 7
Fatal accidents caused by drunken drivers: 4
Fatalities: 5
Persons involved in fatal accidents: 8
Pedestrians involved in fatal accidents: 1
Fatal accident statistics in 2013:
Fatal accident count: 1
Vehicles involved in fatal accidents: 1
Fatal accidents caused by drunken drivers: 1
Fatalities: 1
Persons involved in fatal accidents: 1
Pedestrians involved in fatal accidents: 0
Home Mortgage Disclosure Act Aggregated Statistics For Year 2009 (Based on 9 full and 6 partial tracts)
A) FHA, FSA/RHS & VA Home Purchase Loans
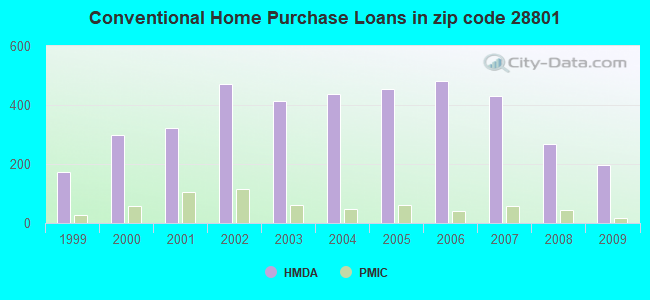
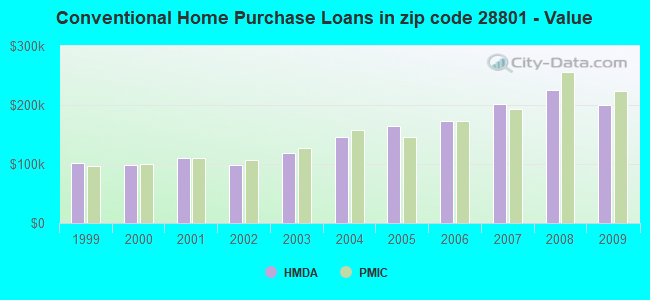
B) Conventional Home Purchase Loans
C) Refinancings
D) Home Improvement Loans
E) Loans on Dwellings For 5+ Families
F) Non-occupant Loans on < 5 Family Dwellings (A B C & D)
Number
Average Value
Number
Average Value
Number
Average Value
Number
Average Value
Number
Average Value
Number
Average Value
LOANS ORIGINATED
19
$203,360
195
$200,740
444
$204,448
12
$76,790
13
$319,858
146
$210,006
APPLICATIONS APPROVED, NOT ACCEPTED
0
$0
7
$246,080
25
$228,102
3
$120,417
1
$326,000
9
$185,623
APPLICATIONS DENIED
3
$224,980
26
$231,523
174
$198,737
15
$105,031
1
$348,000
39
$213,249
APPLICATIONS WITHDRAWN
7
$212,506
33
$225,366
110
$183,389
9
$114,943
0
$0
41
$171,652
FILES CLOSED FOR INCOMPLETENESS
4
$196,955
6
$144,533
21
$164,861
0
$0
0
$0
6
$169,020
Aggregated Statistics For Year 2008 (Based on 9 full and 6 partial tracts)
A) FHA, FSA/RHS & VA Home Purchase Loans
B) Conventional Home Purchase Loans
C) Refinancings
D) Home Improvement Loans
E) Loans on Dwellings For 5+ Families
F) Non-occupant Loans on < 5 Family Dwellings (A B C & D)
G) Loans On Manufactured Home Dwelling (A B C & D)
Number
Average Value
Number
Average Value
Number
Average Value
Number
Average Value
Number
Average Value
Number
Average Value
Number
Average Value
LOANS ORIGINATED
8
$149,135
268
$224,583
347
$188,075
17
$161,475
8
$285,936
195
$207,869
0
$0
APPLICATIONS APPROVED, NOT ACCEPTED
1
$30,000
36
$208,123
33
$185,753
2
$38,670
2
$585,880
17
$235,422
3
$48,453
APPLICATIONS DENIED
1
$226,900
63
$207,028
162
$180,247
34
$87,128
0
$0
57
$186,905
5
$97,838
APPLICATIONS WITHDRAWN
1
$156,000
54
$220,187
87
$161,940
8
$124,035
0
$0
37
$182,419
0
$0
FILES CLOSED FOR INCOMPLETENESS
0
$0
14
$347,181
19
$152,161
0
$0
0
$0
10
$305,221
0
$0
Aggregated Statistics For Year 2007 (Based on 9 full and 6 partial tracts)
A) FHA, FSA/RHS & VA Home Purchase Loans
B) Conventional Home Purchase Loans
C) Refinancings
D) Home Improvement Loans
E) Loans on Dwellings For 5+ Families
F) Non-occupant Loans on < 5 Family Dwellings (A B C & D)
G) Loans On Manufactured Home Dwelling (A B C & D)
Number
Average Value
Number
Average Value
Number
Average Value
Number
Average Value
Number
Average Value
Number
Average Value
Number
Average Value
LOANS ORIGINATED
0
$0
430
$202,160
412
$174,042
34
$89,856
10
$475,112
250
$200,985
2
$178,860
APPLICATIONS APPROVED, NOT ACCEPTED
0
$0
50
$253,686
72
$153,203
14
$75,439
0
$0
32
$208,090
3
$56,853
APPLICATIONS DENIED
0
$0
67
$236,960
228
$231,903
9
$77,009
2
$348,150
90
$265,164
1
$105,450
APPLICATIONS WITHDRAWN
2
$134,385
46
$258,073
80
$192,001
5
$244,708
0
$0
24
$268,299
0
$0
FILES CLOSED FOR INCOMPLETENESS
0
$0
7
$270,664
22
$205,038
2
$137,300
1
$476,160
5
$370,218
0
$0
Aggregated Statistics For Year 2006 (Based on 9 full and 6 partial tracts)
A) FHA, FSA/RHS & VA Home Purchase Loans
B) Conventional Home Purchase Loans
C) Refinancings
D) Home Improvement Loans
E) Loans on Dwellings For 5+ Families
F) Non-occupant Loans on < 5 Family Dwellings (A B C & D)
G) Loans On Manufactured Home Dwelling (A B C & D)
Number
Average Value
Number
Average Value
Number
Average Value
Number
Average Value
Number
Average Value
Number
Average Value
Number
Average Value
LOANS ORIGINATED
0
$0
481
$173,240
409
$169,656
39
$74,162
8
$2,445,412
295
$172,819
13
$44,524
APPLICATIONS APPROVED, NOT ACCEPTED
2
$45,745
61
$167,917
73
$133,170
0
$0
0
$0
32
$156,260
12
$35,549
APPLICATIONS DENIED
6
$39,475
102
$133,311
161
$146,167
25
$33,535
1
$700,000
43
$142,014
39
$50,250
APPLICATIONS WITHDRAWN
2
$125,165
59
$202,318
78
$161,610
2
$24,170
0
$0
28
$174,850
1
$101,330
FILES CLOSED FOR INCOMPLETENESS
0
$0
12
$185,032
26
$143,802
4
$56,545
0
$0
8
$155,948
0
$0
Aggregated Statistics For Year 2005 (Based on 9 full and 6 partial tracts)
A) FHA, FSA/RHS & VA Home Purchase Loans
B) Conventional Home Purchase Loans
C) Refinancings
D) Home Improvement Loans
E) Loans on Dwellings For 5+ Families
F) Non-occupant Loans on < 5 Family Dwellings (A B C & D)
G) Loans On Manufactured Home Dwelling (A B C & D)
Number
Average Value
Number
Average Value
Number
Average Value
Number
Average Value
Number
Average Value
Number
Average Value
Number
Average Value
LOANS ORIGINATED
3
$99,000
454
$163,602
474
$138,620
43
$113,989
3
$248,170
249
$163,711
7
$93,626
APPLICATIONS APPROVED, NOT ACCEPTED
0
$0
50
$148,069
96
$122,922
11
$50,475
0
$0
33
$156,688
2
$50,630
APPLICATIONS DENIED
2
$34,810
123
$138,386
212
$134,511
28
$64,332
0
$0
38
$153,164
40
$45,117
APPLICATIONS WITHDRAWN
1
$183,620
79
$172,739
130
$145,555
10
$150,721
0
$0
36
$162,246
0
$0
FILES CLOSED FOR INCOMPLETENESS
0
$0
21
$152,680
37
$152,268
0
$0
0
$0
2
$120,490
2
$76,495
Aggregated Statistics For Year 2004 (Based on 9 full and 6 partial tracts)
A) FHA, FSA/RHS & VA Home Purchase Loans
B) Conventional Home Purchase Loans
C) Refinancings
D) Home Improvement Loans
E) Loans on Dwellings For 5+ Families
F) Non-occupant Loans on < 5 Family Dwellings (A B C & D)
G) Loans On Manufactured Home Dwelling (A B C & D)
Number
Average Value
Number
Average Value
Number
Average Value
Number
Average Value
Number
Average Value
Number
Average Value
Number
Average Value
LOANS ORIGINATED
5
$134,892
437
$145,552
425
$130,436
38
$83,138
7
$372,469
235
$137,938
2
$287,500
APPLICATIONS APPROVED, NOT ACCEPTED
2
$122,585
47
$107,763
87
$118,368
8
$25,600
0
$0
16
$100,429
15
$38,055
APPLICATIONS DENIED
4
$61,292
95
$116,659
190
$128,118
33
$56,784
1
$345,150
32
$138,587
23
$33,894
APPLICATIONS WITHDRAWN
0
$0
64
$152,009
107
$135,774
3
$71,707
0
$0
33
$150,382
1
$100,000
FILES CLOSED FOR INCOMPLETENESS
0
$0
6
$149,193
24
$101,403
3
$28,080
0
$0
4
$96,875
0
$0
Aggregated Statistics For Year 2003 (Based on 9 full and 6 partial tracts)
A) FHA, FSA/RHS & VA Home Purchase Loans
B) Conventional Home Purchase Loans
C) Refinancings
D) Home Improvement Loans
E) Loans on Dwellings For 5+ Families
F) Non-occupant Loans on < 5 Family Dwellings (A B C & D)
Number
Average Value
Number
Average Value
Number
Average Value
Number
Average Value
Number
Average Value
Number
Average Value
LOANS ORIGINATED
19
$102,014
414
$118,363
811
$115,219
12
$19,782
9
$372,627
257
$116,765
APPLICATIONS APPROVED, NOT ACCEPTED
5
$32,970
154
$54,403
106
$95,010
6
$22,542
0
$0
29
$93,403
APPLICATIONS DENIED
12
$44,140
308
$53,784
229
$94,888
31
$27,523
1
$345,150
34
$92,268
APPLICATIONS WITHDRAWN
4
$80,908
47
$110,119
131
$119,486
2
$32,365
2
$392,280
31
$117,212
FILES CLOSED FOR INCOMPLETENESS
0
$0
9
$229,059
56
$144,638
0
$0
0
$0
4
$230,708
Aggregated Statistics For Year 2002 (Based on 9 full and 6 partial tracts)
A) FHA, FSA/RHS & VA Home Purchase Loans
B) Conventional Home Purchase Loans
C) Refinancings
D) Home Improvement Loans
E) Loans on Dwellings For 5+ Families
F) Non-occupant Loans on < 5 Family Dwellings (A B C & D)
Number
Average Value
Number
Average Value
Number
Average Value
Number
Average Value
Number
Average Value
Number
Average Value
LOANS ORIGINATED
13
$53,928
470
$98,376
575
$119,027
15
$39,261
3
$191,670
231
$113,676
APPLICATIONS APPROVED, NOT ACCEPTED
0
$0
160
$45,837
114
$99,473
7
$36,256
0
$0
20
$94,284
APPLICATIONS DENIED
8
$51,082
272
$52,563
216
$88,100
23
$45,749
1
$184,530
27
$82,023
APPLICATIONS WITHDRAWN
0
$0
49
$103,345
102
$106,424
4
$59,308
0
$0
28
$91,036
FILES CLOSED FOR INCOMPLETENESS
2
$50,995
7
$69,860
44
$100,036
0
$0
0
$0
8
$65,794
Aggregated Statistics For Year 2001 (Based on 9 full and 6 partial tracts)
A) FHA, FSA/RHS & VA Home Purchase Loans
B) Conventional Home Purchase Loans
C) Refinancings
D) Home Improvement Loans
E) Loans on Dwellings For 5+ Families
F) Non-occupant Loans on < 5 Family Dwellings (A B C & D)
Number
Average Value
Number
Average Value
Number
Average Value
Number
Average Value
Number
Average Value
Number
Average Value
LOANS ORIGINATED
10
$95,772
321
$110,919
493
$105,807
35
$31,456
3
$1,583,617
184
$105,656
APPLICATIONS APPROVED, NOT ACCEPTED
0
$0
58
$58,058
81
$103,589
5
$42,482
0
$0
23
$105,206
APPLICATIONS DENIED
2
$26,785
132
$62,880
231
$87,717
17
$28,118
1
$345,150
40
$99,579
APPLICATIONS WITHDRAWN
0
$0
33
$109,097
95
$84,101
15
$47,594
1
$262,310
15
$62,975
FILES CLOSED FOR INCOMPLETENESS
0
$0
7
$144,261
15
$72,025
0
$0
0
$0
4
$45,185
Aggregated Statistics For Year 2000 (Based on 9 full and 6 partial tracts)
A) FHA, FSA/RHS & VA Home Purchase Loans
B) Conventional Home Purchase Loans
C) Refinancings
D) Home Improvement Loans
E) Loans on Dwellings For 5+ Families
F) Non-occupant Loans on < 5 Family Dwellings (A B C & D)
Number
Average Value
Number
Average Value
Number
Average Value
Number
Average Value
Number
Average Value
Number
Average Value
LOANS ORIGINATED
13
$115,538
297
$97,703
253
$91,710
33
$34,140
2
$668,515
109
$101,023
APPLICATIONS APPROVED, NOT ACCEPTED
12
$35,834
72
$54,188
93
$80,956
8
$34,219
0
$0
21
$78,435
APPLICATIONS DENIED
10
$45,733
245
$52,456
200
$76,693
27
$23,830
1
$491,490
42
$73,466
APPLICATIONS WITHDRAWN
0
$0
33
$92,669
126
$72,286
10
$63,452
1
$93,910
17
$92,171
FILES CLOSED FOR INCOMPLETENESS
0
$0
9
$92,439
22
$69,526
0
$0
0
$0
1
$214,000
Aggregated Statistics For Year 1999 (Based on 5 full and 3 partial tracts)
A) FHA, FSA/RHS & VA Home Purchase Loans
B) Conventional Home Purchase Loans
C) Refinancings
D) Home Improvement Loans
E) Loans on Dwellings For 5+ Families
F) Non-occupant Loans on < 5 Family Dwellings (A B C & D)
2002 - 2018 National Fire Incident Reporting System (NFIRS) incidents
Based on the data from the years 2002 - 2018 the average number of fires per year is 135. The highest number of reported fires - 216 took place in 2007, and the least - 7 in 2013. The data has a rising trend.
When looking into fire subcategories, the most reports belonged to: Structure Fires (61.9%), and Outside Fires (27.3%).
Fire incident types reported to NFIRS in Zip Code 28801


 Nearest zip codes: 28804, 28806, 28803, 28805, 28701, 28704.


 Based on the data from the years 2002 - 2018 the average number of fires per year is 135. The highest number of reported fires - 216 took place in 2007, and the least - 7 in 2013. The data has a rising trend.
 When looking into fire subcategories, the most reports belonged to: Structure Fires (61.9%), and Outside Fires (27.3%).