Estimated zip code population in 2022: 22,888 Zip code population in 2010: 18,821 Zip code population in 2000: 14,782
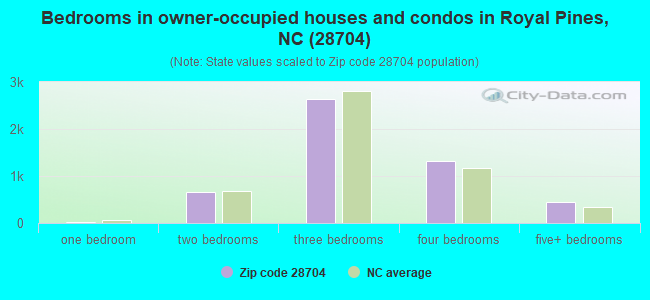
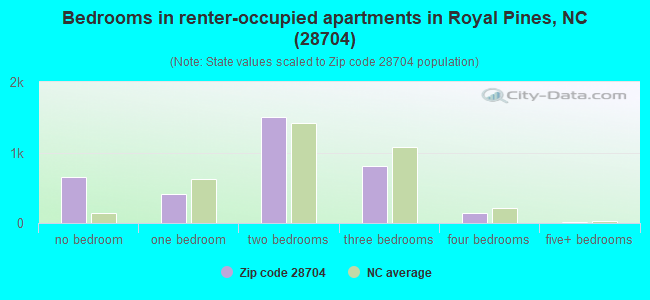
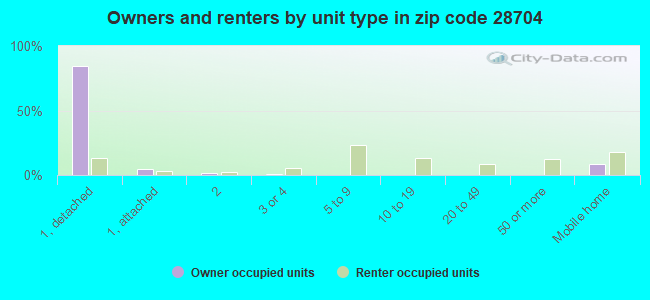
Houses and condos: 11,432 Renter-occupied apartments: 3,507
% of renters here:
41%
State:
33%
March 2022 cost of living index in zip code 28704: 92.1 (less than average, U.S. average is 100)
Land area: 32.9 sq. mi. Water area: 0.7 sq. mi.
Population density: 695 people per square mile
(low).
OSM Map
General Map
Google Map
MSN Map
OSM Map
General Map
Google Map
MSN Map
OSM Map
General Map
Google Map
MSN Map
OSM Map
General Map
Google Map
MSN Map
Please wait while loading the map...
Real estate property taxes paid for housing units in 2022:
This zip code:
0.5% ($2,016)
North Carolina:
0.6% ($1,769)
Median real estate property taxes paid for housing units with mortgages in 2022: $2,233 (0.5%) Median real estate property taxes paid for housing units with no mortgage in 2022: $1,464 (0.4%)
Estimated median house/condo value in 2022: $387,632
28704:
$387,632
North Carolina:
$280,600
According to our research of North Carolina and other state lists, there were 20 registered sex offenders living in 28704 zip code as of April 27, 2024. The ratio of all residents to sex offenders in zip code 28704 is 1,016 to 1. The ratio of registered sex offenders to all residents in this zip code is lower than the state average.
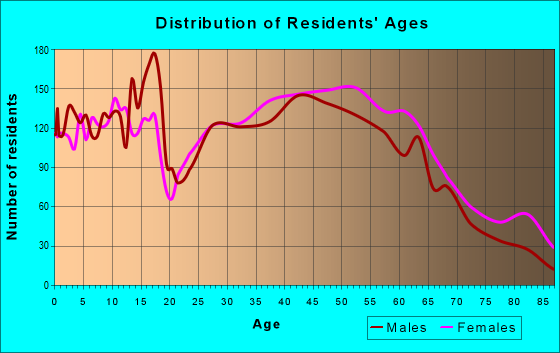
Median resident age:
This zip code:
40.1 years
North Carolina median age:
39.2 years
Average household size:
This zip code:
2.6 people
North Carolina:
2.4 people
Averages for the 2020 tax year for zip code 28704, filed in 2021:
Average Adjusted Gross Income (AGI) in 2020: $69,805 (Individual Income Tax Returns)
Here:
$69,805
State:
$70,020
Salary/wage: $54,489 (reported on 81.9% of returns)
Here:
$54,489
State:
$58,387
(% of AGI for various income ranges: 1232.0% for AGIs below $25k, 3745.5% for AGIs $25k-50k, 7071.7% for AGIs $50k-75k, 10425.6% for AGIs $75k-100k, 17945.2% for AGIs $100k-200k, 84952.1% for AGIs over 200k)
Taxable interest for individuals: $2,082 (reported on 30.3% of returns)
This zip code:
$2,082
North Carolina:
$1,479
(% of AGI for various income ranges: 12.5% for AGIs below $25k, 20.4% for AGIs $25k-50k, 40.3% for AGIs $50k-75k, 85.5% for AGIs $75k-100k, 155.6% for AGIs $100k-200k, 3245.0% for AGIs over 200k)
Ordinary dividends: $10,297 (reported on 19.9% of returns)
Here:
$10,297
State:
$7,888
(% of AGI for various income ranges: 29.1% for AGIs below $25k, 42.9% for AGIs $25k-50k, 130.6% for AGIs $50k-75k, 253.1% for AGIs $75k-100k, 628.8% for AGIs $100k-200k, 10598.6% for AGIs over 200k)
Net capital gain/loss in AGI: +$24,210 (reported on 18.6% of returns)
Here:
+$24,210
State:
+$23,652
(% of AGI for various income ranges: 11.2% for AGIs below $25k, 34.1% for AGIs $25k-50k, 95.0% for AGIs $50k-75k, 193.8% for AGIs $75k-100k, 777.7% for AGIs $100k-200k, 32260.7% for AGIs over 200k)
Profit/loss from business: +$17,483 (reported on 18.1% of returns)
Here:
+$17,483
State:
+$11,710
(% of AGI for various income ranges: 176.9% for AGIs below $25k, 252.1% for AGIs $25k-50k, 378.4% for AGIs $50k-75k, 498.8% for AGIs $75k-100k, 785.0% for AGIs $100k-200k, 9572.1% for AGIs over 200k)
Taxable individual retirement arrangement distribution: $22,096 (reported on 9.1% of returns)
28704:
$22,096
North Carolina:
$20,247
(% of AGI for various income ranges: 47.4% for AGIs below $25k, 102.7% for AGIs $25k-50k, 266.0% for AGIs $50k-75k, 419.7% for AGIs $75k-100k, 1004.5% for AGIs $100k-200k, 4761.4% for AGIs over 200k)
Self-employed (Keogh) retirement plans: $26,783 (reported on 0.5% of returns)
28704:
$26,783
North Carolina:
$26,749
(% of AGI for various income ranges: 67.8% for AGIs $75k-100k, 837.9% for AGIs over 200k)
Total itemized deductions: $34,498 (reported on 8.4% of returns)
Here:
$34,498
State:
$34,549
(% of AGI for various income ranges: 54.4% for AGIs below $25k, 91.9% for AGIs $25k-50k, 284.7% for AGIs $50k-75k, 462.8% for AGIs $75k-100k, 1314.2% for AGIs $100k-200k, 10314.3% for AGIs over 200k)
Charity contributions: $12,507 (reported on 7.0% of returns)
Here:
$12,507
State:
$13,360
(% of AGI for various income ranges: 4.3% for AGIs below $25k, 15.0% for AGIs $25k-50k, 39.7% for AGIs $50k-75k, 93.3% for AGIs $75k-100k, 349.3% for AGIs $100k-200k, 4477.9% for AGIs over 200k)
Taxes paid: $7,269 (reported on 8.4% of returns)
28704:
$7,269
State:
$7,586
(% of AGI for various income ranges: 5.4% for AGIs below $25k, 14.7% for AGIs $25k-50k, 49.7% for AGIs $50k-75k, 105.6% for AGIs $75k-100k, 336.1% for AGIs $100k-200k, 2070.7% for AGIs over 200k)
Earned income credit: $2,047 (reported on 14.5% of returns)
Here:
$2,047
State:
$2,337
(% of AGI for various income ranges: 80.8% for AGIs below $25k, 55.1% for AGIs $25k-50k, 0.9% for AGIs $50k-75k)
Percentage of individuals using paid preparers for their 2020 taxes: 93.1%
Here:
93%
State:
93%
(% for various income ranges: 91.7% for AGIs below $25k, 93.2% for AGIs $25k-50k, 93.7% for AGIs $50k-75k, 92.6% for AGIs $75k-100k, 94.9% for AGIs $100k-200k, 95.0% for AGIs over 200k)
Averages for the 2012 tax year for zip code 28704, filed in 2013:
Average Adjusted Gross Income (AGI) in 2012: $55,045 (Individual Income Tax Returns)
Here:
$55,045
State:
$54,937
Salary/wage: $47,233 (reported on 84.5% of returns)
Here:
$47,233
State:
$46,336
(% of AGI for various income ranges: 77.8% for AGIs below $25k, 80.0% for AGIs $25k-50k, 75.7% for AGIs $50k-75k, 73.4% for AGIs $75k-100k, 74.5% for AGIs $100k-200k, 60.4% for AGIs over 200k)
Taxable interest for individuals: $1,162 (reported on 34.5% of returns)
This zip code:
$1,162
North Carolina:
$1,298
(% of AGI for various income ranges: 1.1% for AGIs below $25k, 0.6% for AGIs $25k-50k, 0.7% for AGIs $50k-75k, 0.9% for AGIs $75k-100k, 0.7% for AGIs $100k-200k, 0.7% for AGIs over 200k)
Ordinary dividends: $5,656 (reported on 19.7% of returns)
Here:
$5,656
State:
$6,213
(% of AGI for various income ranges: 1.7% for AGIs below $25k, 1.2% for AGIs $25k-50k, 2.0% for AGIs $50k-75k, 1.7% for AGIs $75k-100k, 1.9% for AGIs $100k-200k, 3.1% for AGIs over 200k)
Net capital gain/loss in AGI: +$7,073 (reported on 16.5% of returns)
Here:
+$7,073
State:
+$12,740
(% of AGI for various income ranges: 0.2% for AGIs $25k-50k, 0.7% for AGIs $50k-75k, 1.5% for AGIs $75k-100k, 1.9% for AGIs $100k-200k, 6.0% for AGIs over 200k)
Profit/loss from business: +$13,019 (reported on 15.6% of returns)
Here:
+$13,019
State:
+$10,311
(% of AGI for various income ranges: 7.7% for AGIs below $25k, 2.8% for AGIs $25k-50k, 2.9% for AGIs $50k-75k, 3.1% for AGIs $75k-100k, 3.6% for AGIs $100k-200k, 3.6% for AGIs over 200k)
Taxable individual retirement arrangement distribution: $16,944 (reported on 10.7% of returns)
28704:
$16,944
North Carolina:
$15,575
(% of AGI for various income ranges: 3.0% for AGIs below $25k, 2.4% for AGIs $25k-50k, 3.1% for AGIs $50k-75k, 3.6% for AGIs $75k-100k, 3.5% for AGIs $100k-200k, 3.8% for AGIs over 200k)
Self-employment retirement plans: $13,780 (reported on 0.5% of returns)
28704:
$13,780
North Carolina:
$21,078
Total itemized deductions: $23,345 (22% of AGI, reported on 32.8% of returns)
Here:
$23,345
State:
$23,438
Here:
21.8% of AGI
State:
21.5% of AGI
(% of AGI for various income ranges: 9.2% for AGIs below $25k, 9.9% for AGIs $25k-50k, 14.0% for AGIs $50k-75k, 15.7% for AGIs $75k-100k, 16.6% for AGIs $100k-200k, 15.0% for AGIs over 200k)
Charity contributions: $4,211 (reported on 27.4% of returns)
Here:
$4,211
State:
$4,687
(% of AGI for various income ranges: 0.8% for AGIs below $25k, 1.2% for AGIs $25k-50k, 2.0% for AGIs $50k-75k, 2.4% for AGIs $75k-100k, 2.7% for AGIs $100k-200k, 2.4% for AGIs over 200k)
Taxes paid: $8,239 (reported on 32.7% of returns)
28704:
$8,239
State:
$8,823
(% of AGI for various income ranges: 1.4% for AGIs below $25k, 2.1% for AGIs $25k-50k, 3.9% for AGIs $50k-75k, 5.0% for AGIs $75k-100k, 6.4% for AGIs $100k-200k, 7.5% for AGIs over 200k)
Earned income credit: $2,217 (reported on 16.7% of returns)
Here:
$2,217
State:
$2,376
(% of AGI for various income ranges: 5.6% for AGIs below $25k, 0.9% for AGIs $25k-50k)
Percentage of individuals using paid preparers for their 2012 taxes: 51.5%
Here:
51%
State:
53%
(% for various income ranges: 51.0% for AGIs below $25k, 48.3% for AGIs $25k-50k, 49.6% for AGIs $50k-75k, 52.6% for AGIs $75k-100k, 55.4% for AGIs $100k-200k, 75.9% for AGIs over 200k)
Averages for the 2004 tax year for zip code 28704, filed in 2005:
Average Adjusted Gross Income (AGI) in 2004: $46,748 (Individual Income Tax Returns)
Here:
$46,748
State:
$45,376
Salary/wage: $41,830 (reported on 84.5% of returns)
Here:
$41,830
State:
$39,442
(% of AGI for various income ranges: 125.8% for AGIs below $10k, 78.5% for AGIs $10k-25k, 79.4% for AGIs $25k-50k, 79.2% for AGIs $50k-75k, 78.4% for AGIs $75k-100k, 68.4% for AGIs over 100k)
Taxable interest for individuals: $1,437 (reported on 44.1% of returns)
This zip code:
$1,437
North Carolina:
$1,515
(% of AGI for various income ranges: 7.3% for AGIs below $10k, 2.0% for AGIs $10k-25k, 1.4% for AGIs $25k-50k, 1.1% for AGIs $50k-75k, 1.0% for AGIs $75k-100k, 1.2% for AGIs over 100k)
Taxable dividends: $3,154 (reported on 24.9% of returns)
Here:
$3,154
State:
$4,016
(% of AGI for various income ranges: 6.9% for AGIs below $10k, 1.7% for AGIs $10k-25k, 1.4% for AGIs $25k-50k, 1.5% for AGIs $50k-75k, 1.4% for AGIs $75k-100k, 1.9% for AGIs over 100k)
Net capital gain/loss: +$10,116 (reported on 20.2% of returns)
Here:
+$10,116
State:
+$11,152
(% of AGI for various income ranges: -1.2% for AGIs below $10k, 0.1% for AGIs $10k-25k, 0.6% for AGIs $25k-50k, 1.1% for AGIs $50k-75k, 2.3% for AGIs $75k-100k, 10.0% for AGIs over 100k)
Profit/loss from business: +$11,370 (reported on 16.4% of returns)
Here:
+$11,370
State:
+$9,490
(% of AGI for various income ranges: 5.3% for AGIs below $10k, 5.1% for AGIs $10k-25k, 3.7% for AGIs $25k-50k, 3.5% for AGIs $50k-75k, 3.6% for AGIs $75k-100k, 4.2% for AGIs over 100k)
IRA payment deduction: $2,881 (reported on 3.0% of returns)
28704:
$2,881
North Carolina:
$2,967
(% of AGI for various income ranges: 0.2% for AGIs $10k-25k, 0.3% for AGIs $25k-50k, 0.2% for AGIs $50k-75k, 0.2% for AGIs $75k-100k, 0.1% for AGIs over 100k)
Self-employed pension: $12,650 (reported on 0.7% of returns)
Here:
$12,650
North Carolina:
$14,754
Total itemized deductions: $19,110 (23% of AGI, reported on 39.3% of returns)
Here:
$19,110
State:
$19,464
Here:
23.4% of AGI
State:
22.7% of AGI
(% of AGI for various income ranges: 21.9% for AGIs below $10k, 10.9% for AGIs $10k-25k, 13.6% for AGIs $25k-50k, 17.4% for AGIs $50k-75k, 18.3% for AGIs $75k-100k, 16.9% for AGIs over 100k)
Charity contributions deductions: $3,611 (4% of AGI, reported on 34.3% of returns)
Here:
$3,611
State:
$4,035
Here:
4.2% of AGI
State:
4.5% of AGI
(% of AGI for various income ranges: 1.4% for AGIs below $10k, 1.4% for AGIs $10k-25k, 2.1% for AGIs $25k-50k, 2.7% for AGIs $50k-75k, 2.9% for AGIs $75k-100k, 3.2% for AGIs over 100k)
Total tax: $6,799 (reported on 76.7% of returns)
28704:
$6,799
State:
$7,257
(% of AGI for various income ranges: 4.1% for AGIs below $10k, 4.2% for AGIs $10k-25k, 7.1% for AGIs $25k-50k, 8.9% for AGIs $50k-75k, 10.0% for AGIs $75k-100k, 16.8% for AGIs over 100k)
Earned income credit: $1,726 (reported on 14.0% of returns)
Here:
$1,726
State:
$1,851
Percentage of individuals using paid preparers for their 2004 taxes: 55.3%
Here:
55%
State:
62%
(% for various income ranges: 46.6% for AGIs below $10k, 56.5% for AGIs $10k-25k, 56.1% for AGIs $25k-50k, 56.4% for AGIs $50k-75k, 56.6% for AGIs $75k-100k, 64.1% for AGIs over 100k)
Likely homosexual households (counted as self-reported same-sex unmarried-partner households)
Lesbian couples: 0.4% of all households
Gay men: 0.1% of all households
Household received Food Stamps/SNAP in the past 12 months: 690 Household did not receive Food Stamps/SNAP in the past 12 months: 7,857
Women who had a birth in the past 12 months: 269 (177 now married, 92 unmarried) Women who did not have a birth in the past 12 months: 5,172 (1,854 now married, 3,310 unmarried)
Housing units in zip code 28704 with a mortgage: 3,473 (217 second mortgage, 201 both second mortgage and home equity loan) Houses without a mortgage: 61
Median monthly owner costs for units with a mortgage: $1,656 Median monthly owner costs for units without a mortgage: $435
Residents with income below the poverty level in 2022:
This zip code:
6.4%
Whole state:
12.8%
Residents with income below 50% of the poverty level in 2022:
This zip code:
5.5%
Whole state:
6.8%
Median number of rooms in houses and condos:
Here:
6.7
State:
6.4
Median number of rooms in apartments:
Here:
4.2
State:
4.4
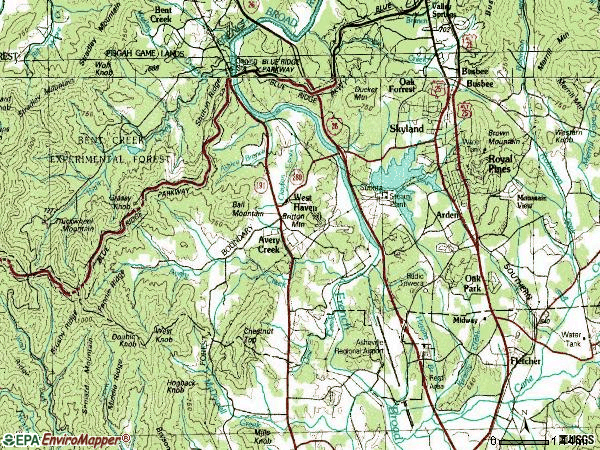
Notable locations in this zip code not listed on our city pages
Notable locations in zip code 28704: Brookwood Golf Club (A), Camp Clark-Kennedy (B), Asheville Steam Plant (C), Lake Powhatan Campground (D), Lutheridge Camp (E), Fletcher Plaza (F). Display/hide their locations on the map
Churches in zip code 28704 include: Oak Grove Church (A), Nativity Church (B), Mount Zion Church (C), Mount Carmel Church (D), Lutheridge Chapel (E), Saint Barnabas Church (F). Display/hide their locations on the map
Reservoirs: Lake Coma (A), Lake Julian (B), Lake Powhatan (C), Capps Lake (D), Dubose Lake (E), Morgan Lake (F), Roberts Lake (G). Display/hide their locations on the map
Streams, rivers, and creeks: Ducker Creek (A), Orton Branch (B), Clayton Creek (C), Boyd Branch (D), Beaten Branch (E), Newman Branch (F), Bad Fork (G), Avery Creek (H), Ashley Branch (I). Display/hide their locations on the map
In group quarters: 190 (-1 institutionalized population)
Size of family households: 2,694 2-persons, 1,493 3-persons, 703 4-persons, 598 5-persons, 70 6-persons, 20 7-or-more-persons
Size of nonfamily households: 2,499 1-person, 431 2-persons, 82 3-persons
3,038 married couples with children.
1,401 single-parent households (258 men, 1,143 women).
83.3% of residents of 28704 zip code speak English at home.
10.1% of residents speak Spanish at home (35% very well, 20% well, 30% not well, 14% not at all).
4.6% of residents speak other Indo-European language at home (24% very well, 33% well, 33% not well, 10% not at all).
2.6% of residents speak Asian or Pacific Island language at home (83% very well, 17% well).
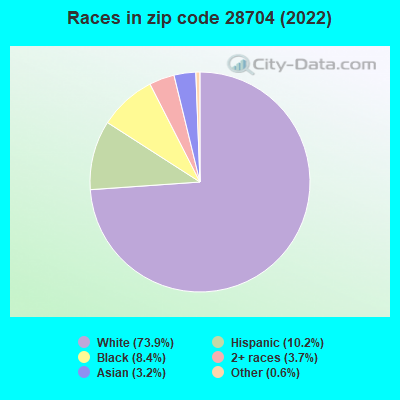
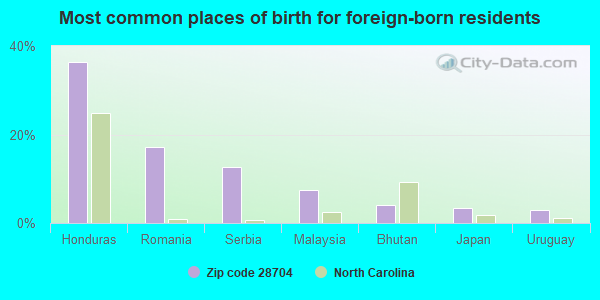
Foreign born population: 2,742 (12.0%) (25.6% of them are naturalized citizens)
This zip code:
12.0%
Whole state:
8.6%
36%Honduras
17%Romania
13%Serbia
8%Malaysia
4%Bhutan
3%Japan
3%Uruguay
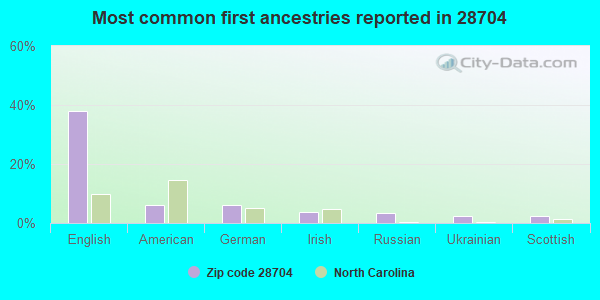
38%English
6%American
6%German
4%Irish
3%Russian
2%Ukrainian
2%Scottish
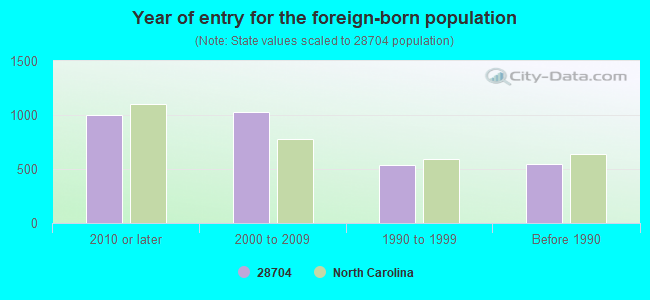
Year of entry for the foreign-born population
1,0012010 or later
1,0272000 to 2009
5361990 to 1999
548Before 1990
Major facilities with environmental interests located in this zip code:
BLUE RIDGE PLATING COMPANY INCORPORATED (171 GLENN BRIDGE RD in ARDEN, NC)
SUPERFUND NPL (Superfund database) STATE MASTER (North Carolina facility info) - UNDERGROUND STORAGE TANK PROGRAM HAZARDOUS WASTE BIENNIAL REPORTER (Resource Conservation and Recovery Act (tracking hazardous waste)) Large Quantity Generators, more that 1000 kg of hazardous waste/month (Resource Conservation and Recovery Act (tracking hazardous waste)) TSD (Resource Conservation and Recovery Act (tracking hazardous waste)) Business SIC classification: NONCLASSIFIABLE ESTABLISHMENTS Organizations: KENNETH E. SCHMIDT (CONTACT/OPERATOR)
, CAROLYN BENFIELD (CONTACT/OWNER)
ARVINMERITOR INCORPORATED (90 CHRIST SCHOOL ROAD in ARDEN, NC)
STATE MASTER (North Carolina facility info) - -115DA4YG00M29W84AX3Y89W8XT, WASTEWATER FACILITY National Pollutant Discharge Elimination System NON-MAJOR (Tracking pollutant discharge elimination systems) - permit Business SIC classification: MOTOR VEHICLE PARTS AND ACCESSORIES
ATLAS PRECISION PLASTICS INC (FAIR OAKS ROAD in ARDEN, NC)
STATE MASTER (North Carolina facility info) - -115DA4YG00M29W84AY3V82WCR5, WASTEWATER FACILITY National Pollutant Discharge Elimination System NON-MAJOR (Tracking pollutant discharge elimination systems) - permit Business SIC classification: PLASTICS PRODUCTS
AVERY'S CREEK ELEMENTARY (15 PARK SOUTH BLVD in ARDEN, NC)
(National Center for Education Statistics) - STATE ID-410 Organizations: BUNCOMBE COUNTY SCHOOLS (SCHOOL DISTRICT)
ARDEN SERVICES INCORPORATED (22 OLD SHOALS RD. in ARDEN, NC)
(Resource Conservation and Recovery Act (tracking hazardous waste)) TRI REPORTER (Tracking of toxic chemicals releasing facilities) Business SIC classification: SECONDARY SMELTING AND REFINING OF NONFERROUS METALS Organizations: TIM DOVER (CONTACT/OWNER)
ASHEVILLE INDUSTRIES (GLEN BRIDGE ROAD US 25 in ARDEN, NC)
CARQUEST AUTO PARTS (2391 HENDERSONVILLE HWY in ARDEN, NC)
(Resource Conservation and Recovery Act (tracking hazardous waste)) Organizations: GENERAL PARTS INC (CONTACT/OWNER)
A & M TOOL INC (20 LOOP RD in ARDEN, NC)
Conditionally Exempt Small Quantity Generators, less than 100 kg/month of hazardous waste (Resource Conservation and Recovery Act (tracking hazardous waste)) - notification Organizations: FRED MILLAR (CONTACT/OWNER)
, JAMES AWALD (CONTACT/OWNER)
CRITERIA AND HAZARDOUS AIR POLLUTANT INVENTORY (Inventory of air pollution sources) Conditionally Exempt Small Quantity Generators, less than 100 kg/month of hazardous waste (Resource Conservation and Recovery Act (tracking hazardous waste)) - notification Business SIC classification: PLASTICS PRODUCTS Organizations: ALLIANCE TOOL CORP (CONTACT/OWNER)
ASC CONSTRUCTION EQUIPMENT (400 AIRPORT RD in ARDEN, NC)
Conditionally Exempt Small Quantity Generators, less than 100 kg/month of hazardous waste (Resource Conservation and Recovery Act (tracking hazardous waste)) Organizations: ROCKWOOD ROAD LLC (CONTACT/OWNER)
Alternative names: L B SMITH INC
ASHEVILLE DC (1788 BREVARD RD in ARDEN, NC)
National Pollutant Discharge Elimination System NON-MAJOR (Tracking pollutant discharge elimination systems) - permit Business SIC classification: LOCAL AND SUBURBAN TRANSIT Alternative names: ROLLING FRITO LAY SALES LP ASH
ASSOCIATED SPRING ARDEN PLANT (100 UNDERWOOD RD. in ARDEN, NC)
Conditionally Exempt Small Quantity Generators, less than 100 kg/month of hazardous waste (Resource Conservation and Recovery Act (tracking hazardous waste)) - notification TRI REPORTER (Tracking of toxic chemicals releasing facilities) Business SIC classification: WIRE SPRINGS Organizations: BARNES GROUP (CONTACT/OWNER)
Alternative names: ASSOCIATED SPRING BARNES ARDEN
Housing units lacking complete plumbing facilities: 1.0% Housing units lacking complete kitchen facilities: 4.3%
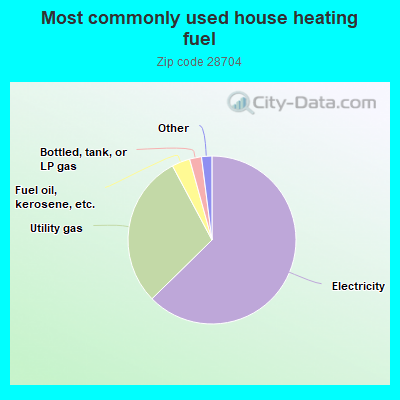
62.8%Electricity
29.6%Utility gas
3.5%Fuel oil, kerosene, etc.
2.3%Bottled, tank, or LP gas
0.8%No fuel used
0.6%Wood
Population in 1990: 11,386. Population change in the 1990s: +3,396 (+29.8%).
Place of birth for U.S.-born residents:
This state: 10,921
Northeast: 2,443
Midwest: 1,817
South: 3,583
West: 1,069
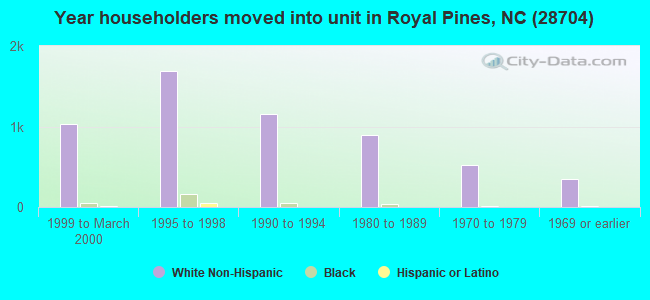
54% of the 28704 zip code residents lived in the same house 5 years ago. Out of people who lived in different houses, 47% lived in this county. Out of people who lived in different counties, 50% lived in North Carolina.
90% of the 28704 zip code residents lived in the same house 1 year ago. Out of people who lived in different houses, 21% moved from this county. Out of people who lived in different houses, 19% moved from different county within same state. Out of people who lived in different houses, 54% moved from different state. Out of people who lived in different houses, 13% moved from abroad.
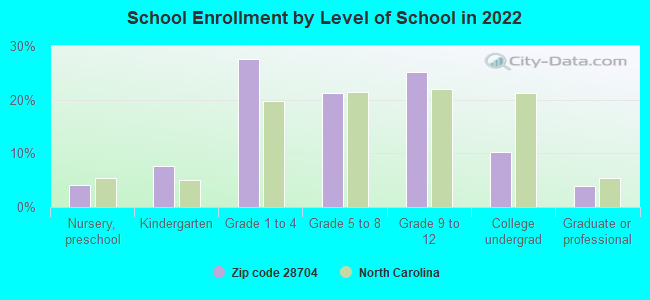
Private vs. public school enrollment:
Students in private schools in grades 1 to 8 (elementary and middle school): 247
Here:
10.9%
North Carolina:
13.8%
Students in private schools in grades 9 to 12 (high school): 104
Here:
9.0%
North Carolina:
11.9%
Students in private undergraduate colleges: 190
Here:
39.4%
North Carolina:
19.3%
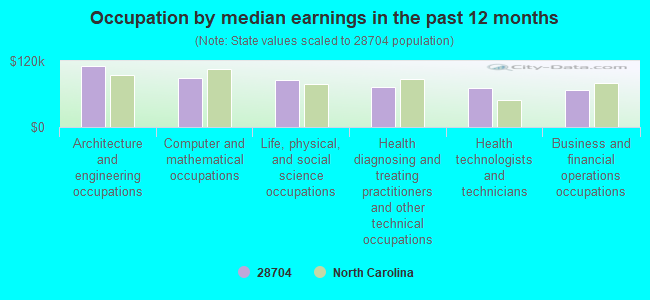
Occupation by median earnings in the past 12 months ($)
110,310Architecture and engineering occupations
88,823Computer and mathematical occupations
85,213Life, physical, and social science occupations
72,046Health diagnosing and treating practitioners and other technical occupations
70,355Health technologists and technicians
67,410Business and financial operations occupations
Companies with federal contracts located in this zip code:
BORGWARNER TURBO SYSTEMS (1849 BREVARD RD in ARDEN, NC; small business) : $476,550 in 10 contractsfrom 2002 to 2005
Contracts for Turbosuperchargers and components, Bearings, Mounted, Miscellaneous Engine Accessories, Nonaircraft, Motor Vehicle Maintenance and Repair Shop Specialized Equipment by Army, Defense Logistics Agency, EPA Signed by year:2000: $0; 2001: $0; 2002: $457,550; 2003: $0; 2004: $3,000; 2005: $16,000; 2006: $0.
Biggest contracts:
$191,950 with Army for Turbosuperchargers and components. Taking place in IN. Signed on 2002-04-17. Completion date: 2002-11-29.
$99,550, same as above.Signed on 2002-05-08. Completion date: 2002-10-28.
$71,500, same as above.Signed on 2002-05-08. Completion date: 2002-10-28.
$51,150, same as above.Signed on 2002-05-02. Completion date: 2002-06-14.
RAMSEY GROUP INC (32 OLD SHOALS RD in ARDEN, NC; small business)
$11,844 with Navy for Miscellaneous Prefabricated Structures. Taking place in VA. Signed on 2005-07-28. Completion date: 2005-08-17.
Top industries in this zip code by the number of employees in 2005:
2002 - 2018 National Fire Incident Reporting System (NFIRS) incidents
Based on the data from the years 2002 - 2018 the average number of fire incidents per year is 63. The highest number of fire incidents - 117 took place in 2006, and the least - 8 in 2003. The data has an increasing trend.
When looking into fire subcategories, the most reports belonged to: Structure Fires (53.0%), and Outside Fires (33.0%).
Fire incident types reported to NFIRS in Zip Code 28704


 Nearest zip codes: 28759, 28803, 28742, 28806, 28791, 28732.


 Based on the data from the years 2002 - 2018 the average number of fire incidents per year is 63. The highest number of fire incidents - 117 took place in 2006, and the least - 8 in 2003. The data has an increasing trend.
 When looking into fire subcategories, the most reports belonged to: Structure Fires (53.0%), and Outside Fires (33.0%).