Estimated zip code population in 2022: 29,434 Zip code population in 2010: 28,135 Zip code population in 2000: 24,863
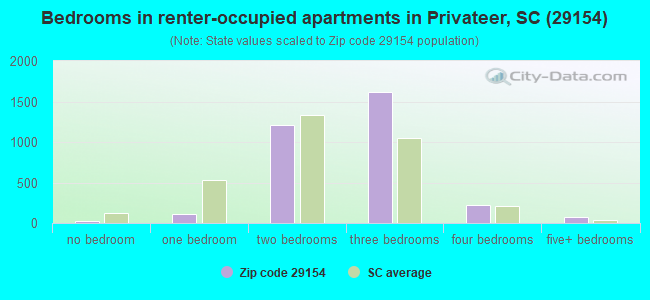
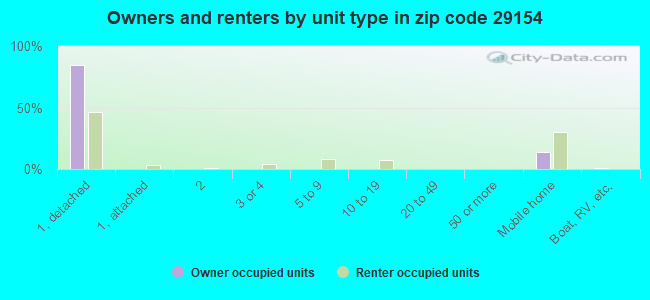
Houses and condos: 13,158 Renter-occupied apartments: 3,295
% of renters here:
27%
State:
28%
March 2022 cost of living index in zip code 29154: 83.1 (low, U.S. average is 100)
Land area: 79.4 sq. mi. Water area: 0.9 sq. mi.
Population density: 371 people per square mile
(very low).
OSM Map
General Map
Google Map
MSN Map
OSM Map
General Map
Google Map
MSN Map
OSM Map
General Map
Google Map
MSN Map
OSM Map
General Map
Google Map
MSN Map
Please wait while loading the map...
Real estate property taxes paid for housing units in 2022:
This zip code:
0.5% ($992)
South Carolina:
0.5% ($1,185)
Median real estate property taxes paid for housing units with mortgages in 2022: $1,179 (0.6%) Median real estate property taxes paid for housing units with no mortgage in 2022: $732 (0.5%)
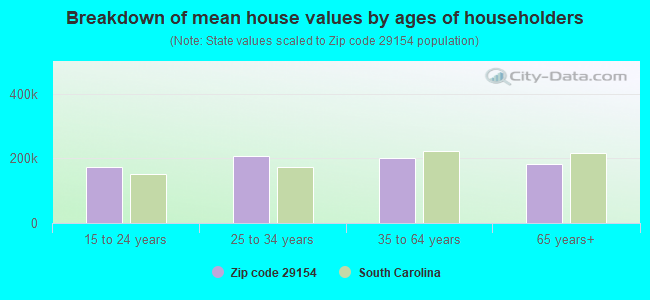
Estimated median house/condo value in 2022: $194,895
29154:
$194,895
South Carolina:
$254,600
According to our research of South Carolina and other state lists, there were 10 registered sex offenders living in 29154 zip code as of April 27, 2024. The ratio of all residents to sex offenders in zip code 29154 is 2,924 to 1. The ratio of registered sex offenders to all residents in this zip code is lower than the state average.
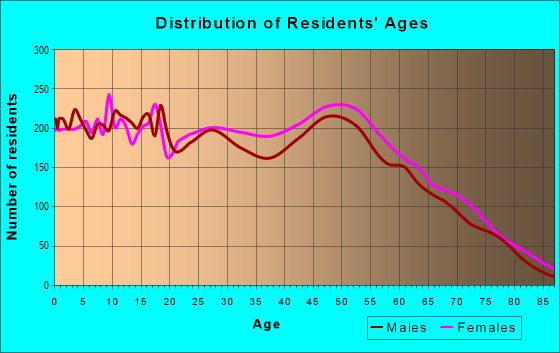
Median resident age:
This zip code:
36.7 years
South Carolina median age:
40.5 years
Average household size:
This zip code:
2.4 people
South Carolina:
2.4 people
Averages for the 2020 tax year for zip code 29154, filed in 2021:
Average Adjusted Gross Income (AGI) in 2020: $47,740 (Individual Income Tax Returns)
Here:
$47,740
State:
$65,754
Salary/wage: $42,917 (reported on 83.4% of returns)
Here:
$42,917
State:
$52,566
(% of AGI for various income ranges: 1228.7% for AGIs below $25k, 3752.8% for AGIs $25k-50k, 6816.1% for AGIs $50k-75k, 9589.4% for AGIs $75k-100k, 19027.4% for AGIs $100k-200k, 75967.5% for AGIs over 200k)
Taxable interest for individuals: $820 (reported on 20.9% of returns)
This zip code:
$820
South Carolina:
$1,749
(% of AGI for various income ranges: 8.0% for AGIs below $25k, 10.8% for AGIs $25k-50k, 28.3% for AGIs $50k-75k, 35.4% for AGIs $75k-100k, 84.1% for AGIs $100k-200k, 1175.0% for AGIs over 200k)
Ordinary dividends: $3,099 (reported on 10.4% of returns)
Here:
$3,099
State:
$8,783
(% of AGI for various income ranges: 7.6% for AGIs below $25k, 12.3% for AGIs $25k-50k, 50.7% for AGIs $50k-75k, 78.5% for AGIs $75k-100k, 161.2% for AGIs $100k-200k, 3422.5% for AGIs over 200k)
Net capital gain/loss in AGI: +$6,434 (reported on 9.2% of returns)
Here:
+$6,434
State:
+$24,194
(% of AGI for various income ranges: 2.5% for AGIs below $25k, 8.6% for AGIs $25k-50k, 46.5% for AGIs $50k-75k, 91.8% for AGIs $75k-100k, 299.1% for AGIs $100k-200k, 11117.5% for AGIs over 200k)
Profit/loss from business: +$4,913 (reported on 15.4% of returns)
Here:
+$4,913
State:
+$11,253
(% of AGI for various income ranges: 93.0% for AGIs below $25k, 42.0% for AGIs $25k-50k, 48.5% for AGIs $50k-75k, 136.3% for AGIs $75k-100k, 371.9% for AGIs $100k-200k, 2675.0% for AGIs over 200k)
Taxable individual retirement arrangement distribution: $14,140 (reported on 6.2% of returns)
29154:
$14,140
South Carolina:
$21,604
(% of AGI for various income ranges: 36.0% for AGIs below $25k, 69.8% for AGIs $25k-50k, 128.4% for AGIs $50k-75k, 303.5% for AGIs $75k-100k, 470.1% for AGIs $100k-200k, 2632.5% for AGIs over 200k)
Total itemized deductions: $29,350 (reported on 4.7% of returns)
Here:
$29,350
State:
$35,199
(% of AGI for various income ranges: 21.8% for AGIs below $25k, 86.7% for AGIs $25k-50k, 266.7% for AGIs $50k-75k, 328.8% for AGIs $75k-100k, 871.8% for AGIs $100k-200k, 8812.5% for AGIs over 200k)
Charity contributions: $11,902 (reported on 4.0% of returns)
Here:
$11,902
State:
$14,319
(% of AGI for various income ranges: 3.6% for AGIs below $25k, 16.9% for AGIs $25k-50k, 71.1% for AGIs $50k-75k, 116.1% for AGIs $75k-100k, 326.3% for AGIs $100k-200k, 4632.5% for AGIs over 200k)
Taxes paid: $6,120 (reported on 4.7% of returns)
29154:
$6,120
State:
$7,486
(% of AGI for various income ranges: 1.9% for AGIs below $25k, 12.5% for AGIs $25k-50k, 50.3% for AGIs $50k-75k, 76.2% for AGIs $75k-100k, 227.6% for AGIs $100k-200k, 1635.0% for AGIs over 200k)
Earned income credit: $2,529 (reported on 23.9% of returns)
Here:
$2,529
State:
$2,397
(% of AGI for various income ranges: 134.4% for AGIs below $25k, 89.9% for AGIs $25k-50k, 2.1% for AGIs $50k-75k)
Percentage of individuals using paid preparers for their 2020 taxes: 93.8%
Here:
94%
State:
93%
(% for various income ranges: 93.3% for AGIs below $25k, 94.3% for AGIs $25k-50k, 92.9% for AGIs $50k-75k, 94.4% for AGIs $75k-100k, 94.7% for AGIs $100k-200k, 100.0% for AGIs over 200k)
Averages for the 2012 tax year for zip code 29154, filed in 2013:
Average Adjusted Gross Income (AGI) in 2012: $41,354 (Individual Income Tax Returns)
Here:
$41,354
State:
$51,133
Salary/wage: $37,455 (reported on 85.6% of returns)
Here:
$37,455
State:
$42,173
(% of AGI for various income ranges: 79.1% for AGIs below $25k, 81.0% for AGIs $25k-50k, 78.7% for AGIs $50k-75k, 77.1% for AGIs $75k-100k, 75.9% for AGIs $100k-200k, 59.2% for AGIs over 200k)
Taxable interest for individuals: $718 (reported on 26.4% of returns)
This zip code:
$718
South Carolina:
$1,468
(% of AGI for various income ranges: 0.6% for AGIs below $25k, 0.4% for AGIs $25k-50k, 0.4% for AGIs $50k-75k, 0.3% for AGIs $75k-100k, 0.4% for AGIs $100k-200k, 0.8% for AGIs over 200k)
Ordinary dividends: $2,749 (reported on 11.7% of returns)
Here:
$2,749
State:
$6,511
(% of AGI for various income ranges: 0.6% for AGIs below $25k, 0.6% for AGIs $25k-50k, 0.5% for AGIs $50k-75k, 0.4% for AGIs $75k-100k, 1.1% for AGIs $100k-200k, 3.7% for AGIs over 200k)
Net capital gain/loss in AGI: +$2,894 (reported on 8.0% of returns)
Here:
+$2,894
State:
+$13,061
(% of AGI for various income ranges: 0.2% for AGIs $50k-75k, 0.6% for AGIs $75k-100k, 0.8% for AGIs $100k-200k, 4.8% for AGIs over 200k)
Profit/loss from business: +$5,695 (reported on 13.9% of returns)
Here:
+$5,695
State:
+$10,167
(% of AGI for various income ranges: 6.6% for AGIs below $25k, 1.5% for AGIs $25k-50k, 1.0% for AGIs $50k-75k, 0.8% for AGIs $75k-100k, 1.6% for AGIs $100k-200k)
Taxable individual retirement arrangement distribution: $9,844 (reported on 6.8% of returns)
29154:
$9,844
South Carolina:
$17,019
(% of AGI for various income ranges: 1.5% for AGIs below $25k, 1.4% for AGIs $25k-50k, 1.6% for AGIs $50k-75k, 1.7% for AGIs $75k-100k, 2.4% for AGIs $100k-200k)
Total itemized deductions: $18,515 (25% of AGI, reported on 26.8% of returns)
Here:
$18,515
State:
$22,890
Here:
24.8% of AGI
State:
21.4% of AGI
(% of AGI for various income ranges: 5.8% for AGIs below $25k, 10.6% for AGIs $25k-50k, 12.8% for AGIs $50k-75k, 13.5% for AGIs $75k-100k, 14.8% for AGIs $100k-200k, 16.1% for AGIs over 200k)
Charity contributions: $4,642 (reported on 22.3% of returns)
Here:
$4,642
State:
$5,169
(% of AGI for various income ranges: 0.9% for AGIs below $25k, 2.0% for AGIs $25k-50k, 2.6% for AGIs $50k-75k, 2.8% for AGIs $75k-100k, 3.5% for AGIs $100k-200k, 4.0% for AGIs over 200k)
Taxes paid: $5,422 (reported on 26.6% of returns)
29154:
$5,422
State:
$7,644
(% of AGI for various income ranges: 0.9% for AGIs below $25k, 2.1% for AGIs $25k-50k, 3.3% for AGIs $50k-75k, 4.2% for AGIs $75k-100k, 5.7% for AGIs $100k-200k, 7.1% for AGIs over 200k)
Earned income credit: $2,477 (reported on 26.9% of returns)
Here:
$2,477
State:
$2,418
(% of AGI for various income ranges: 9.2% for AGIs below $25k, 1.4% for AGIs $25k-50k)
Percentage of individuals using paid preparers for their 2012 taxes: 53.2%
Here:
53%
State:
57%
(% for various income ranges: 53.0% for AGIs below $25k, 53.0% for AGIs $25k-50k, 53.6% for AGIs $50k-75k, 52.9% for AGIs $75k-100k, 53.8% for AGIs $100k-200k, 71.4% for AGIs over 200k)
Averages for the 2004 tax year for zip code 29154, filed in 2005:
Average Adjusted Gross Income (AGI) in 2004: $36,038 (Individual Income Tax Returns)
Here:
$36,038
State:
$41,965
Salary/wage: $33,087 (reported on 89.1% of returns)
Here:
$33,087
State:
$35,695
(% of AGI for various income ranges: 90.5% for AGIs below $10k, 81.6% for AGIs $10k-25k, 85.1% for AGIs $25k-50k, 82.7% for AGIs $50k-75k, 83.8% for AGIs $75k-100k, 69.7% for AGIs over 100k)
Taxable interest for individuals: $740 (reported on 36.3% of returns)
This zip code:
$740
South Carolina:
$1,623
(% of AGI for various income ranges: 1.8% for AGIs below $10k, 0.8% for AGIs $10k-25k, 0.7% for AGIs $25k-50k, 0.5% for AGIs $50k-75k, 0.6% for AGIs $75k-100k, 1.2% for AGIs over 100k)
Taxable dividends: $1,383 (reported on 14.9% of returns)
Here:
$1,383
State:
$3,999
(% of AGI for various income ranges: 1.2% for AGIs below $10k, 0.5% for AGIs $10k-25k, 0.3% for AGIs $25k-50k, 0.4% for AGIs $50k-75k, 0.5% for AGIs $75k-100k, 1.5% for AGIs over 100k)
Net capital gain/loss: +$4,013 (reported on 9.9% of returns)
Here:
+$4,013
State:
+$13,100
(% of AGI for various income ranges: -0.7% for AGIs below $10k, 0.1% for AGIs $10k-25k, 0.2% for AGIs $25k-50k, 0.3% for AGIs $50k-75k, 0.8% for AGIs $75k-100k, 6.2% for AGIs over 100k)
Profit/loss from business: +$6,061 (reported on 13.5% of returns)
Here:
+$6,061
State:
+$9,144
(% of AGI for various income ranges: 8.0% for AGIs below $10k, 4.9% for AGIs $10k-25k, 1.9% for AGIs $25k-50k, 1.2% for AGIs $50k-75k, 1.1% for AGIs $75k-100k, 2.8% for AGIs over 100k)
IRA payment deduction: $2,744 (reported on 2.5% of returns)
29154:
$2,744
South Carolina:
$2,972
(% of AGI for various income ranges: 0.1% for AGIs $10k-25k, 0.3% for AGIs $25k-50k, 0.2% for AGIs $50k-75k, 0.1% for AGIs $75k-100k, 0.2% for AGIs over 100k)
Self-employed pension: $6,741 (reported on 0.2% of returns)
Here:
$6,741
South Carolina:
$15,117
Total itemized deductions: $15,500 (25% of AGI, reported on 29.3% of returns)
Here:
$15,500
State:
$19,039
Here:
24.6% of AGI
State:
22.8% of AGI
(% of AGI for various income ranges: 4.5% for AGIs below $10k, 6.7% for AGIs $10k-25k, 12.3% for AGIs $25k-50k, 13.5% for AGIs $50k-75k, 15.3% for AGIs $75k-100k, 15.8% for AGIs over 100k)
Charity contributions deductions: $3,601 (6% of AGI, reported on 26.5% of returns)
Here:
$3,601
State:
$4,305
Here:
5.6% of AGI
State:
5.0% of AGI
(% of AGI for various income ranges: 0.4% for AGIs below $10k, 1.2% for AGIs $10k-25k, 2.4% for AGIs $25k-50k, 2.7% for AGIs $50k-75k, 3.1% for AGIs $75k-100k, 4.4% for AGIs over 100k)
Total tax: $4,071 (reported on 70.5% of returns)
29154:
$4,071
State:
$6,497
(% of AGI for various income ranges: 2.4% for AGIs below $10k, 3.4% for AGIs $10k-25k, 5.7% for AGIs $25k-50k, 7.9% for AGIs $50k-75k, 9.7% for AGIs $75k-100k, 16.0% for AGIs over 100k)
Earned income credit: $1,905 (reported on 23.9% of returns)
Here:
$1,905
State:
$1,882
Percentage of individuals using paid preparers for their 2004 taxes: 63.4%
Here:
63%
State:
66%
(% for various income ranges: 58.8% for AGIs below $10k, 68.0% for AGIs $10k-25k, 64.4% for AGIs $25k-50k, 60.7% for AGIs $50k-75k, 59.5% for AGIs $75k-100k, 63.5% for AGIs over 100k)
Likely homosexual households (counted as self-reported same-sex unmarried-partner households)
Lesbian couples: 0.0% of all households
Gay men: 0.1% of all households
Household received Food Stamps/SNAP in the past 12 months: 1,371 Household did not receive Food Stamps/SNAP in the past 12 months: 10,680
Women who had a birth in the past 12 months: 809 (482 now married, 323 unmarried) Women who did not have a birth in the past 12 months: 6,092 (2,928 now married, 3,177 unmarried)
Housing units in zip code 29154 with a mortgage: 5,096 (301 second mortgage, 254 both second mortgage and home equity loan) Houses without a mortgage: 72
Median monthly owner costs for units with a mortgage: $1,259 Median monthly owner costs for units without a mortgage: $365
Residents with income below the poverty level in 2022:
This zip code:
9.2%
Whole state:
14.0%
Residents with income below 50% of the poverty level in 2022:
This zip code:
4.6%
Whole state:
7.3%
Median number of rooms in houses and condos:
Here:
6.4
State:
6.4
Median number of rooms in apartments:
Here:
4.9
State:
4.5
Notable locations in this zip code not listed on our city pages
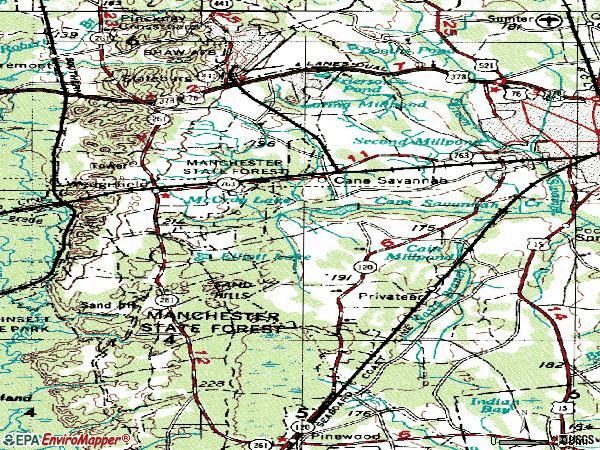
Notable locations in zip code 29154: Sunset Country Club (A), Borough Plantation (B), Cain Mills Club (C), Oakland Plantation (D), Sunset Country Club (E), The Ruins (F), Dundell Gardens (G), Cane Savannah Raceway (H), Gamecock Raceway (I), City of Sumter Fire Department Station 3 (J), Sumter County Rural Fire Department Bethel (K), Sumter County Rural Fire Department Cherryvale (L). Display/hide their locations on the map
Churches in zip code 29154 include: Saint Lukes Church (A), Mount Zion Church (B), Enon Church (C), Church of the Holy Cross (D), Beulah Church (E), Allen Chapel (F), Wayman Chapel (G), Sumter Calvary Church (H), Bethel Church (I). Display/hide their locations on the map
Cemeteries: Pitts Cemetery (1), Gadson Cemetery (2), Saint Lukes Cemetery (3), Smith Cemetery (4), Loring Cemetery (5), Hillside Memorial Park (6), Miller Cemetery (7). Display/hide their locations on the map
Reservoirs and swamps: Lake Cherryvale (A), Mikell Pond (B), Gillespie Pond (C), Oakland Pond (D), Stubbs Pond (E), Cain Millpond (F), Cain Pond (G), Booths Pond (H). Display/hide their locations on the map
Streams, rivers, and creeks: Suicide Branch (A), Red Oak Branch (B), Noyts Branch (C), Nasty Branch (D), Bush Branch (E), Hatchet Camp Branch (F), Brunson Swamp (G), Frisco Branch (H). Display/hide their locations on the map
In group quarters: 147 (-1 institutionalized population)
Size of family households: 3,655 2-persons, 2,459 3-persons, 1,378 4-persons, 388 5-persons, 113 6-persons, 23 7-or-more-persons
Size of nonfamily households: 3,506 1-person, 454 2-persons, 32 3-persons
3,870 married couples with children.
2,100 single-parent households (591 men, 1,509 women).
96.2% of residents of 29154 zip code speak English at home.
1.7% of residents speak Spanish at home (95% very well, 5% well).
0.8% of residents speak other Indo-European language at home (100% very well).
1.0% of residents speak Asian or Pacific Island language at home (95% very well, 5% well).
0.3% of residents speak other language at home (100% very well).
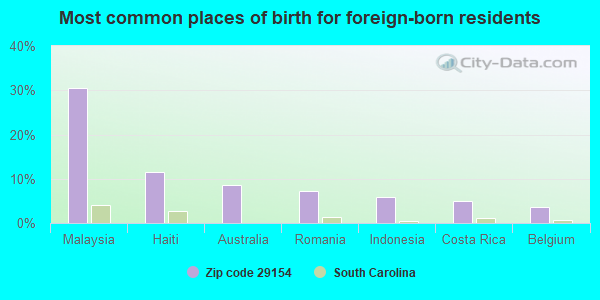
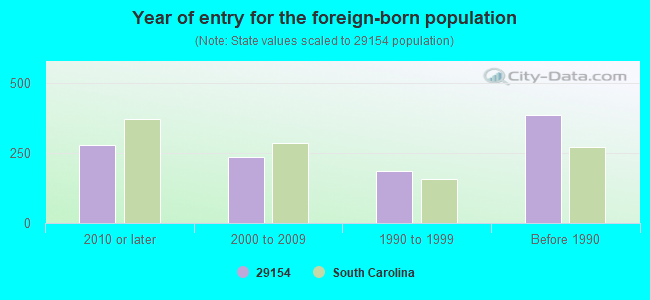
Foreign born population: 702 (2.4%) (89.5% of them are naturalized citizens)
Facilities with environmental interests located in this zip code:
CUTLER HAMMER INCORPORATED (11 CORPORATE CIRCLE in SUMTER, SC)
AIR MINOR (AIRS/AFS) National Pollutant Discharge Elimination System NON-MAJOR (Tracking pollutant discharge elimination systems) - permit (Resource Conservation and Recovery Act (tracking hazardous waste)) Conditionally Exempt Small Quantity Generators, less than 100 kg/month of hazardous waste (Resource Conservation and Recovery Act (tracking hazardous waste)) - notification STATE MASTER (South Carolina database) - TRI REPORTER, HAZARDOUS WASTE PROGRAM, AIR PROGRAM, STATE MASTER (South Carolina database) - HAZARDOUS WASTE PROGRAM TRI REPORTER (Tracking of toxic chemicals releasing facilities) Business SIC classification: SWITCHGEAR AND SWITCHBOARD APPARATUS; ELECTRONIC COILS, TRANSFORMERS, AND OTHER INDUCTORS Alternative names: CUTLER HAMMER INC , CUTLER HAMMER INCORPORATED DEACTIVATED, CUTLER HAMMER - SUMTER, EATON ELECTRICAL
BOSCH BRAKING SYSTEMS (1 CORPORATE WAY in SUMTER, SC)
AIR MINOR (AIRS/AFS) CRITERIA AND HAZARDOUS AIR POLLUTANT INVENTORY (Inventory of air pollution sources) National Pollutant Discharge Elimination System NON-MAJOR (Tracking pollutant discharge elimination systems) - permit AIR MAJOR ("Best Available" air pollution technologies tracking) Conditionally Exempt Small Quantity Generators, less than 100 kg/month of hazardous waste (Resource Conservation and Recovery Act (tracking hazardous waste)) HAZARDOUS WASTE BIENNIAL REPORTER (Resource Conservation and Recovery Act (tracking hazardous waste)) Small Quantity Generators, between 100 kg and 1000 kg of hazardous waste/month (Resource Conservation and Recovery Act (tracking hazardous waste)) - notification STATE MASTER (South Carolina database) - AIR MAJOR, AIR PROGRAM, ASBESTOS ABATEMENT PROGRAM, LABORATORY CERTIFICATION, TRI REPORTER, HAZARDOUS WASTE PROGRAM STATE MASTER (South Carolina database) - HAZARDOUS WASTE PROGRAM TRI REPORTER (Tracking of toxic chemicals releasing facilities) Business SIC classification: MOTOR VEHICLE PARTS AND ACCESSORIES Organizations: ROBERT BOSCH CORP (CONTACT/OWNER)
Alternative names: ASHLAND INC C/O BOSCH BRAKING, BOSCH BRAKING SYSTEMS SUMTER, BOSCH, ROBERT:BRAKING SYSTEMS, ROBERT BOSCH CORP, ROBERT BOSCH CORP. AUTOMOTIVE CHASSIS DIV.
AIRFORCE 1 EXXON (4756 BROAD STREET EXT in SUMTER, SC)
Conditionally Exempt Small Quantity Generators, less than 100 kg/month of hazardous waste (Resource Conservation and Recovery Act (tracking hazardous waste)) - notification STATE MASTER (South Carolina database) - HAZARDOUS WASTE PROGRAM STATE MASTER (South Carolina database) - UNDERGROUND STORAGE TANK PROGRAM Organizations: EXXON MOBIL CORP (CONTACT/OWNER)
Alternative names: EXXON LOCATION 4 3087, EXXON RAS 43087, H WAYNE BAILEY
ENERSYS INCORPORATED (1990 CORPORATE WAY in SUMTER, SC)
AIR MINOR (AIRS/AFS) Conditionally Exempt Small Quantity Generators, less than 100 kg/month of hazardous waste (Resource Conservation and Recovery Act (tracking hazardous waste)) - notification HAZARDOUS WASTE BIENNIAL REPORTER (Resource Conservation and Recovery Act (tracking hazardous waste)) STATE MASTER (South Carolina database) - HAZARDOUS WASTE PROGRAM, AIR PROGRAM, STATE MASTER (South Carolina database) - LABORATORY CERTIFICATION Business SIC classification: SHEET METALWORK; MISCELLANEOUS STRUCTURAL METALWORK Organizations: YUASA INC (CONTACT/OWNER)
Alternative names: ENERSYS:SUMTER, SUMTER METAL PRODUCTS INC, YUASA SUMTER METALS PRODUCTS
G & K TANK SERVICES INCORPORATED (5070 BROAD STREET EXT in SUMTER, SC)
AIR SYNTHETIC MINOR (AIRS/AFS) CRITERIA AND HAZARDOUS AIR POLLUTANT INVENTORY (Inventory of air pollution sources) National Pollutant Discharge Elimination System NON-MAJOR (Tracking pollutant discharge elimination systems) - permit Small Quantity Generators, between 100 kg and 1000 kg of hazardous waste/month (Resource Conservation and Recovery Act (tracking hazardous waste)) USED OIL PROGRAM (Resource Conservation and Recovery Act (tracking hazardous waste)) STATE MASTER (South Carolina database) - AIR MAJOR, AIR PROGRAM, REFUSE DISPOSAL, National Pollutant Discharge Elimination System Permit, HAZARDOUS WASTE PROGRAM, OIL CONTROL Business SIC classification: CONSTRUCTION SAND AND GRAVEL; PESTICIDES AND AGRICULTURAL CHEMICALS Organizations: G&K TANK SERVICE INC (CONTACT/OPERATOR)
, GLASSCOCK TRUCKING/G&K TANK SV (CONTACT/OWNER)
Alternative names: GLASSCOCK TRUCKING/G&K TANK SV
FURMAN HIGH SCHOOL (3400 BETHEL CHURCH RD in SUMTER, SC)
Conditionally Exempt Small Quantity Generators, less than 100 kg/month of hazardous waste (Resource Conservation and Recovery Act (tracking hazardous waste)) - notification STATE MASTER (South Carolina database) - HAZARDOUS WASTE PROGRAM STATE MASTER (South Carolina database) - DRINKING WATER SYSTEM Organizations: SUMTER COUNTY SCHOOL DIST TWO (CONTACT/OWNER)
Alternative names: FURMAN SCHOOL
CAROLINA MOBILE COURT WWTF (OFF SC 441 NEAR JUNX OF US 76 in SUMTER, SC)
National Pollutant Discharge Elimination System NON-MAJOR (Tracking pollutant discharge elimination systems) - permit STATE MASTER (South Carolina database) - National Pollutant Discharge Elimination System Permit Business SIC classification: OPERATORS OF RESIDENTIAL MOBILE HOME SITES
CHERRYVALE ELEMENTARY SCHOOL (1420 FURMAN DR in SUMTER, SC)
(National Center for Education Statistics) - STATE ID-4302008 Organizations: SUMTER COUNTY SCHOOL DISTRICT 02 (SCHOOL DISTRICT)
FURMAN MIDDLE SCHOOL (3400 BETHEL CHURCH RD in SUMTER, SC)
(National Center for Education Statistics) - STATE ID-4302003 Organizations: SUMTER COUNTY SCHOOL DISTRICT 02 (SCHOOL DISTRICT)
BURGESS CENTER:#2 (HWY 378 (NEAR SHAW AFB) in SUMTER, SC)
AIR MINOR (AIRS/AFS) Business SIC classification: CONCRETE BLOCK AND BRICK
ASSOCIATES REALTY, INC. (3219 BROAD ST. EXT. in SUMTER, SC)
ENFORCEMENT/COMPLIANCE ACTIVITY (Integrated Compliance Information System)
Housing units lacking complete kitchen facilities: 1.0%
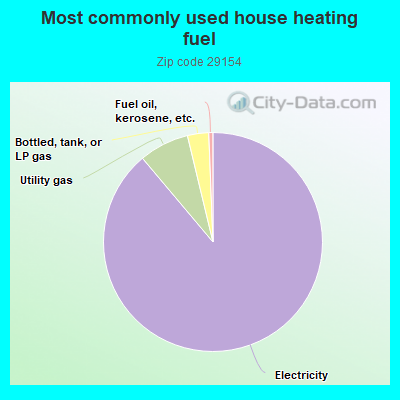
87.8%Electricity
7.3%Utility gas
3.1%Bottled, tank, or LP gas
0.6%Fuel oil, kerosene, etc.
Population in 1990: 24,816. Population change in the 1990s: +47 (+0.2%).
Place of birth for U.S.-born residents:
This state: 17,449
Northeast: 2,772
Midwest: 2,136
South: 4,359
West: 1,565
57% of the 29154 zip code residents lived in the same house 5 years ago. Out of people who lived in different houses, 57% lived in this county. Out of people who lived in different counties, 50% lived in South Carolina.
90% of the 29154 zip code residents lived in the same house 1 year ago. Out of people who lived in different houses, 39% moved from this county. Out of people who lived in different houses, 16% moved from different county within same state. Out of people who lived in different houses, 40% moved from different state. Out of people who lived in different houses, 6% moved from abroad.
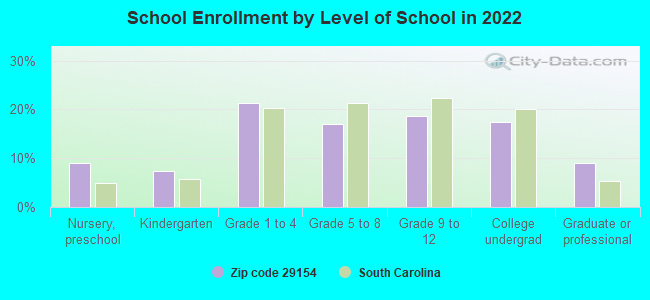
Private vs. public school enrollment:
Students in private schools in grades 1 to 8 (elementary and middle school): 577
Here:
23.8%
South Carolina:
14.4%
Students in private schools in grades 9 to 12 (high school): 212
Here:
18.4%
South Carolina:
11.1%
Students in private undergraduate colleges: 258
Here:
24.0%
South Carolina:
21.9%
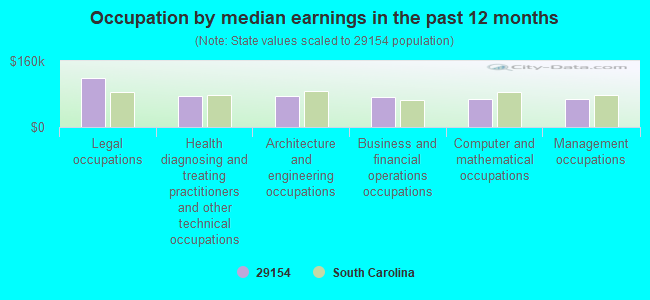
Occupation by median earnings in the past 12 months ($)
119,136Legal occupations
76,301Health diagnosing and treating practitioners and other technical occupations
74,696Architecture and engineering occupations
72,456Business and financial operations occupations
67,700Computer and mathematical occupations
66,745Management occupations
Companies with biggest federal contracts located in this zip code (SUMTER, SC):
GENESIS CENTER, THE (2200B PEACH ORCHARD RD) : $6,436,157 in 39 contractsfrom 1999 to 2006
Contracts for Custodial Janitorial Services, Mailing and Distribution Services, Landscaping/Groundskeeping Services, Library Services by Air Force, Offices, Boards and Divisions (includes Attorney General, Deputy Attorney General, etc.) Signed by year:2000: $577,914; 2001: $1,152,207; 2002: $1,160,286; 2003: $1,045,845; 2004: $852,495; 2005: $392,795; 2006: $535,021.
Biggest contracts:
$691,065 with Air Force for Custodial Janitorial Services. Signed on 2004-10-01. Completion date: 2005-09-30.
$664,361, same as above.Signed on 2003-10-01. Completion date: 2004-09-30.
$612,725, same as above.Signed on 2002-10-01. Completion date: 2002-09-30.
$573,313, same as above.Signed on 2001-10-10. Completion date: 2002-09-30.
JACKSON ENTERPRISES OF SUMTER, (5070 BROAD STREET EXT; small business) : $1,534,514 in 119 contractsfrom 1999 to 2006
Contracts for Hazardous Substance Removal, Cleanup, and Disposal Services and Operational Support, Other Housekeeping Services, Facilities Operations Support Services, Other Environmental Services, Studies, and Analytical Support, and moreby Army, Air Force, Navy Signed by year:2000: $42,189; 2001: $154,201; 2002: $284,313; 2003: $329,928; 2004: $337,187; 2005: $284,912; 2006: $33,084.
Biggest contracts:
$74,813 with Army for Hazardous Substance Removal, Cleanup, and Disposal Services and Operational Support. Taking place in NC. Signed on 2002-06-07. Completion date: 2002-12-16.
$42,189 with Air Force for Other Housekeeping Services. Signed on 2000-10-12. Completion date: 2000-10-01.
$42,189, same as above.Signed on 2001-10-01. Completion date: 2002-09-30.
$41,728 with Navy for Other Housekeeping Services. Taking place in NC. Signed on 2003-03-13. Completion date: 2003-04-30.
M & M CARPETS INC (1285 PEACH ORCHARD RD; small business) : $454,964 in 25 contractsfrom 2001 to 2006
Contracts for Floor Coverings, Carpet Laying and Cleaning, Other Housekeeping Services, Household Furnishings, and moreby Air Force Signed by year:2000: $0; 2001: $184,997; 2002: $38,366; 2003: $58,902; 2004: $83,079; 2005: $73,815; 2006: $15,805.
Biggest contracts:
$99,999 with Air Force for Floor Coverings. Signed on 2001-09-29. Completion date: 2001-09-29.
$54,999, same as above.Signed on 2001-09-28. Completion date: 2002-03-30.
$43,965, same as above.Signed on 2004-09-30. Completion date: 2004-10-27.
$38,366, same as above.Signed on 2002-09-28. Completion date: 2002-11-04.
GLASSCOCK COMPANY, INC (5378 BROAD STREET EXTENSIO; small business) : $69,168 in 6 contractsfrom 2004 to 2006
Contracts for Miscellaneous Construction Materials, Mineral Construction Materials, Bulk by Army, Air Force Signed by year:2000: $0; 2001: $0; 2002: $0; 2003: $0; 2004: $5,745; 2005: $15,993; 2006: $47,430.
Biggest contracts:
$39,525 with Army for Miscellaneous Construction Materials. Signed on 2006-05-02. Completion date: 2006-06-01.
$15,993, same as above.Signed on 2005-04-28. Completion date: 2005-05-27.
$7,905, same as above.Signed on 2006-06-08. Completion date: 2006-06-01.
$5,745 with Air Force for Mineral Construction Materials, Bulk. Signed on 2004-03-25. Completion date: 2004-05-01.
JOHN L WEST (1180 BRIAR BEND ST; small business) : $62,240 in 3 contractsfrom 2004 to 2005
$33,800 with Air Force for Personal Services Contracts. Signed on 2005-09-23. Completion date: 2006-09-30.
$24,440 with Air Force for Educational Services. Signed on 2004-10-01. Completion date: 2005-09-30.
$4,000 with Air Force for Installation of Equipment -- Fiber Optics Materials, Components, Assemblies, and Accessories. Signed on 2004-05-21. Completion date: 2004-06-05.
BAKER, KYRA L (5501 EDGEHILL RD, STE 106D; small business)
$20,384 with Air Force for Educational Services. Signed on 2004-10-01. Completion date: 2005-09-30.
TRADITIONAL REMODELING & MAKEO (1714 HIALEAH PARKWAY; small business) : $16,701 in 3 contractsfrom 2004 to 2006
$7,845 with Air Force for Maintenance, Repair or Alteration of Real Property -- Family Housing Facilities. Signed on 2006-02-08. Completion date: 2006-02-18.
$6,084, same as above.Signed on 2005-06-22. Completion date: 2005-06-24.
$2,772, same as above.Signed on 2004-09-09. Completion date: 2004-10-09.
JEFFORDS CARPET & TILE (810 BROAD ST SUITE 4; small business)
$13,484 with Air Force for Floor Coverings. Signed on 2003-09-30. Completion date: 2003-11-14.
ARREDONDO, MARY (665 COACHMAN DR APT H; small business)
$9,600 with Air Force for Chaplain Services. Signed on 2005-10-01. Completion date: 2007-09-30.
VENTICINQUE, EDWARD (1248 FURMAN DR; small business)
$9,600 with Air Force for Chaplain Services. Signed on 2005-10-01. Completion date: 2007-09-30.
Top industries in this zip code by the number of employees in 2005:
Health Care and Social Assistance: Vocational Rehabilitation Services (250-499 employees: 1 establishment)
Other Services (except Public Administration): Industrial Launderers (100-249: 1)
2005 - 2018 National Fire Incident Reporting System (NFIRS) incidents
According to the data from the years 2005 - 2018 the average number of fire incidents per year is 36. The highest number of reported fire incidents - 97 took place in 2017, and the least - 0 in 2007. The data has an increasing trend.
When looking into fire subcategories, the most incidents belonged to: Outside Fires (50.7%), and Structure Fires (35.5%).
Fire incident types reported to NFIRS in Zip Code 29154
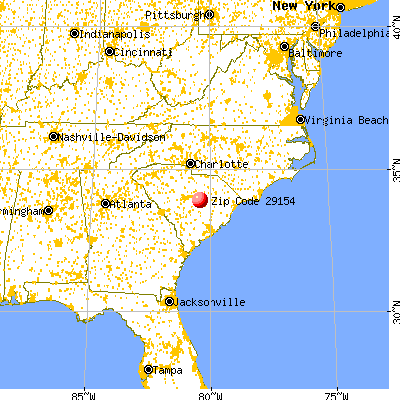


 Nearest zip codes: 29150, 29152, 29168, 29153, 29125, 29040.
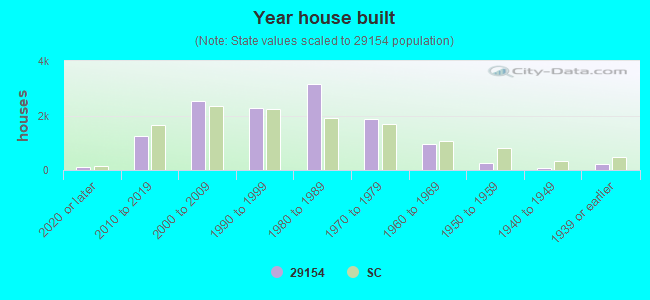


 According to the data from the years 2005 - 2018 the average number of fire incidents per year is 36. The highest number of reported fire incidents - 97 took place in 2017, and the least - 0 in 2007. The data has an increasing trend.
 When looking into fire subcategories, the most incidents belonged to: Outside Fires (50.7%), and Structure Fires (35.5%).