Estimated zip code population in 2022: 23,428 Zip code population in 2010: 21,834 Zip code population in 2000: 14,860
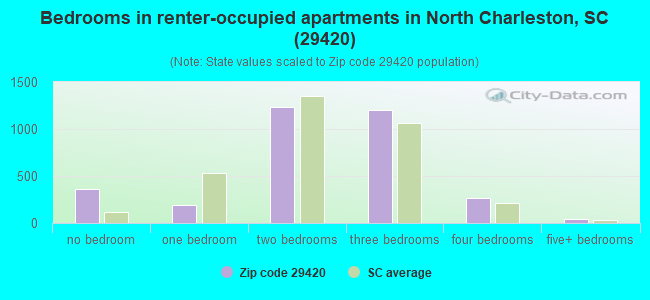
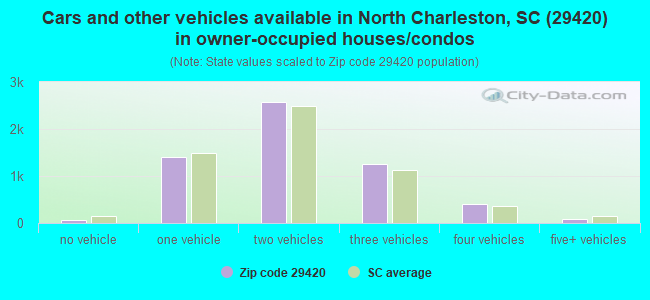
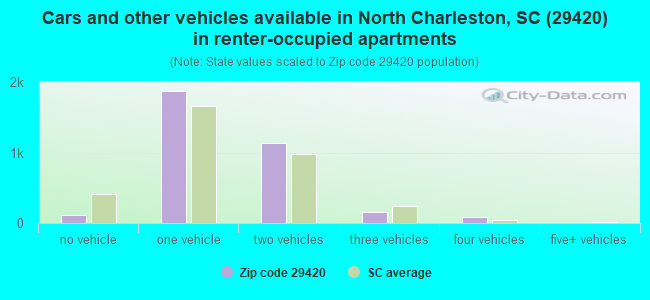
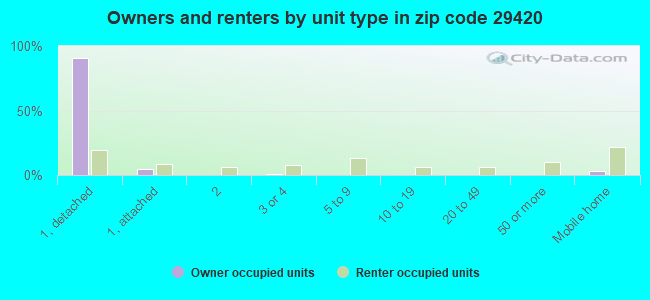
Houses and condos: 9,595 Renter-occupied apartments: 3,339
% of renters here:
37%
State:
28%
March 2022 cost of living index in zip code 29420: 92.7 (less than average, U.S. average is 100)
Land area: 11.2 sq. mi. Water area: 0.2 sq. mi.
Population density: 2,089 people per square mile
(low).
OSM Map
General Map
Google Map
MSN Map
OSM Map
General Map
Google Map
MSN Map
OSM Map
General Map
Google Map
MSN Map
OSM Map
General Map
Google Map
MSN Map
Please wait while loading the map...
Real estate property taxes paid for housing units in 2022:
This zip code:
0.6% ($1,888)
South Carolina:
0.5% ($1,185)
Median real estate property taxes paid for housing units with mortgages in 2022: $1,965 (0.6%) Median real estate property taxes paid for housing units with no mortgage in 2022: $1,477 (0.5%)
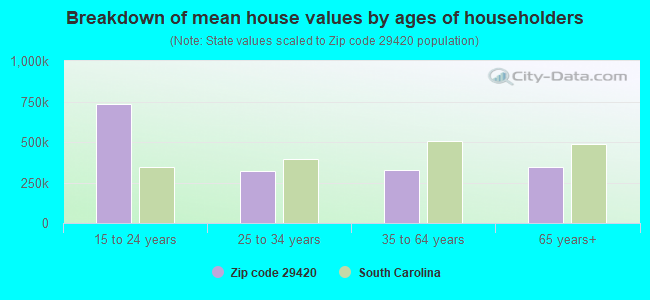
Estimated median house/condo value in 2022: $317,838
29420:
$317,838
South Carolina:
$254,600
According to our research of South Carolina and other state lists, there were 12 registered sex offenders living in 29420 zip code as of April 27, 2024. The ratio of all residents to sex offenders in zip code 29420 is 2,009 to 1. The ratio of registered sex offenders to all residents in this zip code is lower than the state average.
Median resident age:
This zip code:
36.7 years
South Carolina median age:
40.5 years
Average household size:
This zip code:
2.6 people
South Carolina:
2.4 people
Averages for the 2020 tax year for zip code 29420, filed in 2021:
Average Adjusted Gross Income (AGI) in 2020: $55,468 (Individual Income Tax Returns)
Here:
$55,468
State:
$65,754
Salary/wage: $48,134 (reported on 85.0% of returns)
Here:
$48,134
State:
$52,566
(% of AGI for various income ranges: 1257.6% for AGIs below $25k, 3819.9% for AGIs $25k-50k, 7145.9% for AGIs $50k-75k, 10380.4% for AGIs $75k-100k, 19458.3% for AGIs $100k-200k, 65840.0% for AGIs over 200k)
Taxable interest for individuals: $910 (reported on 17.4% of returns)
This zip code:
$910
South Carolina:
$1,749
(% of AGI for various income ranges: 5.9% for AGIs below $25k, 9.0% for AGIs $25k-50k, 13.0% for AGIs $50k-75k, 57.1% for AGIs $75k-100k, 92.9% for AGIs $100k-200k, 311.0% for AGIs over 200k)
Ordinary dividends: $3,999 (reported on 11.4% of returns)
Here:
$3,999
State:
$8,783
(% of AGI for various income ranges: 9.1% for AGIs below $25k, 13.9% for AGIs $25k-50k, 42.5% for AGIs $50k-75k, 57.3% for AGIs $75k-100k, 263.5% for AGIs $100k-200k, 1992.0% for AGIs over 200k)
Net capital gain/loss in AGI: +$8,592 (reported on 10.7% of returns)
Here:
+$8,592
State:
+$24,194
(% of AGI for various income ranges: 3.4% for AGIs below $25k, 13.7% for AGIs $25k-50k, 71.9% for AGIs $50k-75k, 119.5% for AGIs $75k-100k, 490.2% for AGIs $100k-200k, 5192.0% for AGIs over 200k)
Profit/loss from business: +$9,533 (reported on 17.3% of returns)
Here:
+$9,533
State:
+$11,253
(% of AGI for various income ranges: 149.1% for AGIs below $25k, 139.6% for AGIs $25k-50k, 220.1% for AGIs $50k-75k, 227.8% for AGIs $75k-100k, 494.9% for AGIs $100k-200k, 3688.0% for AGIs over 200k)
Taxable individual retirement arrangement distribution: $21,621 (reported on 5.7% of returns)
29420:
$21,621
South Carolina:
$21,604
(% of AGI for various income ranges: 19.1% for AGIs below $25k, 56.4% for AGIs $25k-50k, 117.1% for AGIs $50k-75k, 192.9% for AGIs $75k-100k, 757.1% for AGIs $100k-200k, 4447.0% for AGIs over 200k)
Self-employed (Keogh) retirement plans: $20,600 (reported on 0.2% of returns)
29420:
$20,600
South Carolina:
$25,038
(% of AGI for various income ranges: 63.4% for AGIs $100k-200k)
Total itemized deductions: $29,670 (reported on 8.4% of returns)
Here:
$29,670
State:
$35,199
(% of AGI for various income ranges: 27.5% for AGIs below $25k, 98.5% for AGIs $25k-50k, 401.8% for AGIs $50k-75k, 623.8% for AGIs $75k-100k, 1448.9% for AGIs $100k-200k, 7590.0% for AGIs over 200k)
Charity contributions: $10,913 (reported on 6.8% of returns)
Here:
$10,913
State:
$14,319
(% of AGI for various income ranges: 3.6% for AGIs below $25k, 16.4% for AGIs $25k-50k, 72.9% for AGIs $50k-75k, 145.3% for AGIs $75k-100k, 479.4% for AGIs $100k-200k, 3106.0% for AGIs over 200k)
Taxes paid: $7,249 (reported on 8.4% of returns)
29420:
$7,249
State:
$7,486
(% of AGI for various income ranges: 3.5% for AGIs below $25k, 20.4% for AGIs $25k-50k, 94.0% for AGIs $50k-75k, 173.1% for AGIs $75k-100k, 418.2% for AGIs $100k-200k, 1554.0% for AGIs over 200k)
Earned income credit: $2,505 (reported on 21.3% of returns)
Here:
$2,505
State:
$2,397
(% of AGI for various income ranges: 123.6% for AGIs below $25k, 89.9% for AGIs $25k-50k, 1.2% for AGIs $50k-75k)
Percentage of individuals using paid preparers for their 2020 taxes: 92.9%
Here:
93%
State:
93%
(% for various income ranges: 91.6% for AGIs below $25k, 93.8% for AGIs $25k-50k, 94.2% for AGIs $50k-75k, 92.0% for AGIs $75k-100k, 92.9% for AGIs $100k-200k, 97.1% for AGIs over 200k)
Averages for the 2012 tax year for zip code 29420, filed in 2013:
Average Adjusted Gross Income (AGI) in 2012: $48,622 (Individual Income Tax Returns)
Here:
$48,622
State:
$51,133
Salary/wage: $43,246 (reported on 88.2% of returns)
Here:
$43,246
State:
$42,173
(% of AGI for various income ranges: 82.3% for AGIs below $25k, 86.5% for AGIs $25k-50k, 81.5% for AGIs $50k-75k, 77.4% for AGIs $75k-100k, 78.7% for AGIs $100k-200k, 60.8% for AGIs over 200k)
Taxable interest for individuals: $703 (reported on 21.6% of returns)
This zip code:
$703
South Carolina:
$1,468
(% of AGI for various income ranges: 0.4% for AGIs below $25k, 0.2% for AGIs $25k-50k, 0.2% for AGIs $50k-75k, 0.3% for AGIs $75k-100k, 0.5% for AGIs $100k-200k, 0.3% for AGIs over 200k)
Ordinary dividends: $3,141 (reported on 11.8% of returns)
Here:
$3,141
State:
$6,511
(% of AGI for various income ranges: 0.5% for AGIs below $25k, 0.4% for AGIs $25k-50k, 0.2% for AGIs $50k-75k, 0.7% for AGIs $75k-100k, 0.8% for AGIs $100k-200k, 2.2% for AGIs over 200k)
Net capital gain/loss in AGI: +$4,879 (reported on 8.3% of returns)
Here:
+$4,879
State:
+$13,061
(% of AGI for various income ranges: 0.3% for AGIs $75k-100k, 0.7% for AGIs $100k-200k, 4.7% for AGIs over 200k)
Profit/loss from business: +$10,106 (reported on 14.5% of returns)
Here:
+$10,106
State:
+$10,167
(% of AGI for various income ranges: 8.3% for AGIs below $25k, 1.4% for AGIs $25k-50k, 1.0% for AGIs $50k-75k, 1.2% for AGIs $75k-100k, 2.1% for AGIs $100k-200k, 6.9% for AGIs over 200k)
Taxable individual retirement arrangement distribution: $15,916 (reported on 5.7% of returns)
29420:
$15,916
South Carolina:
$17,019
(% of AGI for various income ranges: 0.7% for AGIs below $25k, 1.0% for AGIs $25k-50k, 2.0% for AGIs $50k-75k, 2.0% for AGIs $75k-100k, 2.0% for AGIs $100k-200k, 3.5% for AGIs over 200k)
Total itemized deductions: $20,685 (23% of AGI, reported on 33.5% of returns)
Here:
$20,685
State:
$22,890
Here:
22.5% of AGI
State:
21.4% of AGI
(% of AGI for various income ranges: 6.6% for AGIs below $25k, 12.0% for AGIs $25k-50k, 14.6% for AGIs $50k-75k, 17.1% for AGIs $75k-100k, 17.8% for AGIs $100k-200k, 13.2% for AGIs over 200k)
Charity contributions: $3,914 (reported on 27.8% of returns)
Here:
$3,914
State:
$5,169
(% of AGI for various income ranges: 0.6% for AGIs below $25k, 1.7% for AGIs $25k-50k, 2.3% for AGIs $50k-75k, 2.7% for AGIs $75k-100k, 3.1% for AGIs $100k-200k, 2.0% for AGIs over 200k)
Taxes paid: $7,052 (reported on 33.3% of returns)
29420:
$7,052
State:
$7,644
(% of AGI for various income ranges: 1.2% for AGIs below $25k, 2.7% for AGIs $25k-50k, 4.1% for AGIs $50k-75k, 5.3% for AGIs $75k-100k, 7.0% for AGIs $100k-200k, 6.8% for AGIs over 200k)
Earned income credit: $2,612 (reported on 25.4% of returns)
Here:
$2,612
State:
$2,418
(% of AGI for various income ranges: 9.7% for AGIs below $25k, 1.4% for AGIs $25k-50k)
Percentage of individuals using paid preparers for their 2012 taxes: 51.4%
Here:
51%
State:
57%
(% for various income ranges: 50.5% for AGIs below $25k, 51.6% for AGIs $25k-50k, 51.2% for AGIs $50k-75k, 51.3% for AGIs $75k-100k, 51.5% for AGIs $100k-200k, 68.4% for AGIs over 200k)
Averages for the 2004 tax year for zip code 29420, filed in 2005:
Average Adjusted Gross Income (AGI) in 2004: $41,479 (Individual Income Tax Returns)
Here:
$41,479
State:
$41,965
Salary/wage: $37,923 (reported on 91.5% of returns)
Here:
$37,923
State:
$35,695
(% of AGI for various income ranges: 112.1% for AGIs below $10k, 86.7% for AGIs $10k-25k, 88.2% for AGIs $25k-50k, 84.7% for AGIs $50k-75k, 84.9% for AGIs $75k-100k, 75.8% for AGIs over 100k)
Taxable interest for individuals: $792 (reported on 32.4% of returns)
This zip code:
$792
South Carolina:
$1,623
(% of AGI for various income ranges: 0.9% for AGIs below $10k, 0.6% for AGIs $10k-25k, 0.5% for AGIs $25k-50k, 0.4% for AGIs $50k-75k, 0.5% for AGIs $75k-100k, 0.9% for AGIs over 100k)
Taxable dividends: $1,500 (reported on 14.4% of returns)
Here:
$1,500
State:
$3,999
(% of AGI for various income ranges: 0.9% for AGIs below $10k, 0.6% for AGIs $10k-25k, 0.3% for AGIs $25k-50k, 0.2% for AGIs $50k-75k, 0.7% for AGIs $75k-100k, 0.8% for AGIs over 100k)
Net capital gain/loss: +$6,855 (reported on 11.0% of returns)
Here:
+$6,855
State:
+$13,100
(% of AGI for various income ranges: -0.2% for AGIs below $10k, -0.1% for AGIs $10k-25k, 0.1% for AGIs $25k-50k, 0.6% for AGIs $50k-75k, 0.6% for AGIs $75k-100k, 5.5% for AGIs over 100k)
Profit/loss from business: +$7,880 (reported on 13.3% of returns)
Here:
+$7,880
State:
+$9,144
(% of AGI for various income ranges: 0.5% for AGIs below $10k, 3.6% for AGIs $10k-25k, 1.5% for AGIs $25k-50k, 1.6% for AGIs $50k-75k, 2.9% for AGIs $75k-100k, 3.4% for AGIs over 100k)
IRA payment deduction: $2,493 (reported on 2.1% of returns)
29420:
$2,493
South Carolina:
$2,972
(% of AGI for various income ranges: 0.1% for AGIs $10k-25k, 0.1% for AGIs $25k-50k, 0.2% for AGIs $50k-75k, 0.2% for AGIs $75k-100k, 0.1% for AGIs over 100k)
Self-employed pension: $10,682 (reported on 0.3% of returns)
Here:
$10,682
South Carolina:
$15,117
Total itemized deductions: $18,355 (25% of AGI, reported on 38.2% of returns)
Here:
$18,355
State:
$19,039
Here:
24.8% of AGI
State:
22.8% of AGI
(% of AGI for various income ranges: 9.2% for AGIs below $10k, 8.0% for AGIs $10k-25k, 15.7% for AGIs $25k-50k, 18.6% for AGIs $50k-75k, 20.9% for AGIs $75k-100k, 18.3% for AGIs over 100k)
Charity contributions deductions: $3,437 (5% of AGI, reported on 34.9% of returns)
Here:
$3,437
State:
$4,305
Here:
4.5% of AGI
State:
5.0% of AGI
(% of AGI for various income ranges: 1.0% for AGIs below $10k, 1.3% for AGIs $10k-25k, 2.7% for AGIs $25k-50k, 3.1% for AGIs $50k-75k, 3.3% for AGIs $75k-100k, 3.4% for AGIs over 100k)
Total tax: $5,528 (reported on 69.3% of returns)
29420:
$5,528
State:
$6,497
(% of AGI for various income ranges: 2.4% for AGIs below $10k, 3.3% for AGIs $10k-25k, 5.6% for AGIs $25k-50k, 7.9% for AGIs $50k-75k, 9.1% for AGIs $75k-100k, 15.6% for AGIs over 100k)
Earned income credit: $1,979 (reported on 22.9% of returns)
Here:
$1,979
State:
$1,882
Percentage of individuals using paid preparers for their 2004 taxes: 60.7%
Here:
61%
State:
66%
(% for various income ranges: 54.9% for AGIs below $10k, 67.9% for AGIs $10k-25k, 62.7% for AGIs $25k-50k, 57.8% for AGIs $50k-75k, 52.6% for AGIs $75k-100k, 58.1% for AGIs over 100k)
Household received Food Stamps/SNAP in the past 12 months: 1,062 Household did not receive Food Stamps/SNAP in the past 12 months: 8,107
Women who had a birth in the past 12 months: 328 (138 now married, 179 unmarried) Women who did not have a birth in the past 12 months: 6,125 (2,408 now married, 3,710 unmarried)
Housing units in zip code 29420 with a mortgage: 4,325 (224 second mortgage, 157 both second mortgage and home equity loan) Houses without a mortgage: 79
Median monthly owner costs for units with a mortgage: $1,522 Median monthly owner costs for units without a mortgage: $527
Residents with income below the poverty level in 2022:
This zip code:
12.9%
Whole state:
14.0%
Residents with income below 50% of the poverty level in 2022:
This zip code:
5.1%
Whole state:
7.3%
Median number of rooms in houses and condos:
Here:
6.9
State:
6.4
Median number of rooms in apartments:
Here:
4.5
State:
4.5
Notable locations in this zip code not listed on our city pages
Notable locations in zip code 29420: Camp Gregg (A), Colony North Industrial Park (B), Dorchester County Lower Dorchester Wastewater Treatment Facility (C), Ashley Industrial Park (D), Pepperhill Park Community Center (E), City of North Charleston Station 11 (F). Display/hide their locations on the map
Churches in zip code 29420 include: Sharing the Word Church of God and Christ Apostolic Church (A), Cathedral of Praise (B). Display/hide their locations on the map
2,746 married couples with children.
1,595 single-parent households (50 men, 1,545 women).
86.9% of residents of 29420 zip code speak English at home.
8.5% of residents speak Spanish at home (41% very well, 28% well, 29% not well, 2% not at all).
1.1% of residents speak other Indo-European language at home (70% very well, 2% well, 28% not well).
2.9% of residents speak Asian or Pacific Island language at home (69% very well, 27% well, 4% not well).
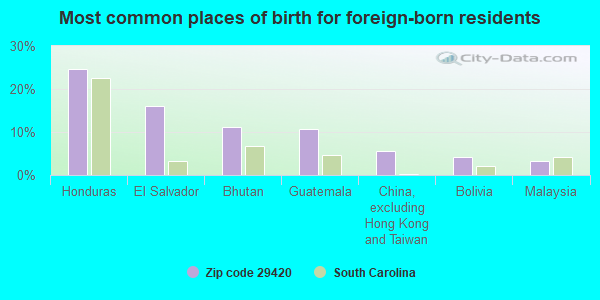
Foreign born population: 2,213 (9.4%) (26.8% of them are naturalized citizens)
Facilities with environmental interests located in this zip code:
AVEBE SOUTH CAROLINA (7680 SOUTHRAIL ROAD in NORTH CHARLESTON, SC)
AIR MINOR (AIRS/AFS) Large Quantity Generators, more that 1000 kg of hazardous waste/month (Resource Conservation and Recovery Act (tracking hazardous waste)) STATE MASTER (South Carolina database) - HAZARDOUS WASTE PROGRAM STATE MASTER (South Carolina database) - AIR PROGRAM, Business SIC classification: WET CORN MILLING; CHEMICALS AND CHEMICAL PREPARATIONS Business NAICS classification: WET CORN MILLING. Organizations: GORDON TIMMONS (CONTACT/OWNER)
Alternative names: AVEBE SOUTH CAROLINA 7680 SOUTH RAIL RD, AVEBE SOUTH CAROLINA INC - 7680 SOUTHRAIL RD PLT, VOTAINER CONSOLIDATION SERV
AVEBE SOUTH CAROLINA INCORPORATED (7675 SOUTHRAIL ROAD in NORTH CHARLESTON, SC)
AIR MINOR (AIRS/AFS) National Pollutant Discharge Elimination System NON-MAJOR (Tracking pollutant discharge elimination systems) - permit STATE MASTER (South Carolina database) - AIR PROGRAM, STATE MASTER (South Carolina database) - AIR PROGRAM, LABORATORY CERTIFICATION Business SIC classification: WET CORN MILLING; CHEMICALS AND CHEMICAL PREPARATIONS Alternative names: AVEBE SOUTH CAROLINA INC - 7675 SOUTHRAIL RD PLT, CAROLINA STARCHES
CAROLINA MACHINE FINISHING INCORPORATED (4696 FRANCHISE ST in NORTH CHARLESTON, SC)
AIR MINOR (AIRS/AFS) AIR SYNTHETIC MINOR (AIRS/AFS) CRITERIA AND HAZARDOUS AIR POLLUTANT INVENTORY (Inventory of air pollution sources) Small Quantity Generators, between 100 kg and 1000 kg of hazardous waste/month (Resource Conservation and Recovery Act (tracking hazardous waste)) - notification STATE MASTER (South Carolina database) - AIR MAJOR, AIR PROGRAM, HAZARDOUS WASTE PROGRAM Business SIC classification: MANUFACTURING INDUSTRIES Organizations: M. RICKMAN JACKSON (CONTACT/OWNER)
BP OIL COMPANY #24141 (8410 DORCHESTER ROAD in NORTH CHARLESTON, SC)
(Resource Conservation and Recovery Act (tracking hazardous waste)) STATE MASTER (South Carolina database) - UNDERGROUND STORAGE TANK PROGRAM Organizations: BP OIL-COMPANY OP (CONTACT/OWNER)
Alternative names: BP OIL CO 24141, BP OIL-SITE #24141
AIR MINOR (AIRS/AFS) STATE MASTER (South Carolina database) - AIR PROGRAM Business SIC classification: CONCRETE BLOCK AND BRICK; READY-MIXED CONCRETE Alternative names: ATLANTIC READY MIX INC
ALICE BIRNEY MIDDLE SCHOOL (7750 PINEHURST ST in CHARLESTON, SC)
(Geographic Names Information System) (National Center for Education Statistics) - STATE ID-1001030 Organizations: CHARLESTON COUNTY SCHOOL DISTRICT (SCHOOL DISTRICT)
FORT DORCHESTER ELEMENTARY (5100 WESTCOTT BLVD in N. CHARLESTON, SC)
(National Center for Education Statistics) - STATE ID-1802023 Organizations: DORCHESTER COUNTY SCHOOL DISTRICT 02 (SCHOOL DISTRICT)
FORT DORCHESTER HIGH (8500 LINCOLN BLVD. in N. CHARLESTON, SC)
(National Center for Education Statistics) - STATE ID-1802020 Organizations: DORCHESTER COUNTY SCHOOL DISTRICT 02 (SCHOOL DISTRICT)
ALLTEL (4920 APPIAN WAY in N. CHARLESTON, SC)
(Integrated Compliance Information System) - ICIS-HQ-2000-6004, FORMAL ENFORCEMENT ACTION
Housing units lacking complete kitchen facilities: 0.2%
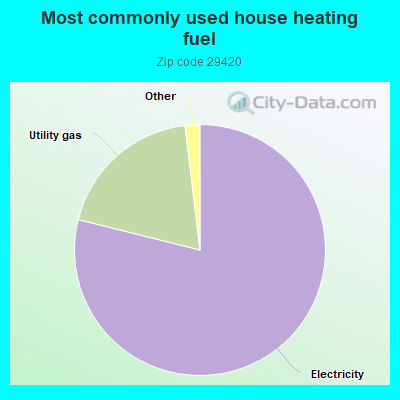
78.9%Electricity
19.2%Utility gas
0.8%No fuel used
0.8%Bottled, tank, or LP gas
Population in 1990: 11,598. Population change in the 1990s: +3,262 (+28.1%).
Place of birth for U.S.-born residents:
This state: 11,781
Northeast: 2,193
Midwest: 1,428
South: 4,323
West: 1,085
44% of the 29420 zip code residents lived in the same house 5 years ago. Out of people who lived in different houses, 31% lived in this county. Out of people who lived in different counties, 50% lived in South Carolina.
91% of the 29420 zip code residents lived in the same house 1 year ago. Out of people who lived in different houses, 27% moved from this county. Out of people who lived in different houses, 57% moved from different county within same state. Out of people who lived in different houses, 15% moved from different state. Out of people who lived in different houses, 2% moved from abroad.
Private vs. public school enrollment:
Students in private schools in grades 1 to 8 (elementary and middle school): 52
Here:
2.2%
South Carolina:
14.4%
Students in private schools in grades 9 to 12 (high school): 72
Here:
4.6%
South Carolina:
11.1%
Students in private undergraduate colleges: 169
Here:
19.6%
South Carolina:
21.9%
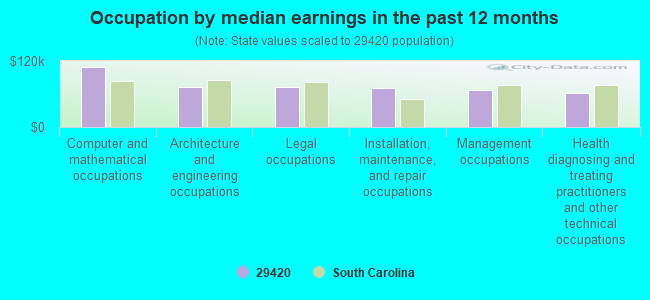
Occupation by median earnings in the past 12 months ($)
108,680Computer and mathematical occupations
73,596Architecture and engineering occupations
73,552Legal occupations
70,651Installation, maintenance, and repair occupations
66,680Management occupations
61,898Health diagnosing and treating practitioners and other technical occupations
Companies with biggest federal contracts located in this zip code:
GREAT AMERICAN BUS OF CHARLEST (7615 SOUTHRAIL RD in CHARLESTON, SC; small business) : $555,860 in 9 contractsfrom 1999 to 2006
Contracts for Other Vehicle Charter for Transportation of Things, Passenger Motor Charter Service, Motor Passenger Services, Lease or Rental of Equipment -- Vehicular Equipment Components, and moreby Navy Signed by year:2000: $159,535; 2001: $0; 2002: $0; 2003: $0; 2004: $9,060; 2005: $302,500; 2006: -$60,495.
Biggest contracts:
$160,000 with Navy for Other Vehicle Charter for Transportation of Things. Signed on 2005-10-12. Completion date: 2006-09-30.
$159,535 with Navy for Passenger Motor Charter Service. Signed on 2000-10-01. Completion date: 2001-09-30.
$145,260, same as above.Signed on 1999-10-01. Completion date: 2000-09-30.
$142,500 with Navy for Motor Passenger Services. Signed on 2005-01-03. Completion date: 2005-09-30.
ORION INTERNATIONAL INC (5081 COOSAW CREEK BLVD in NORTH CHARLEST, SC; small business) : $227,891 in 11 contractsfrom 1999 to 2006
Contracts for Synchros and Resolvers, Switches, Engine Instruments, Combination and Miscellaneous Instruments, and moreby Defense Logistics Agency Signed by year:2000: $21,090; 2001: $65,490; 2002: $0; 2003: $0; 2004: $57,301; 2005: $4,460; 2006: $19,100.
Biggest contracts:
$65,490 with Defense Logistics Agency for Synchros and Resolvers. Signed on 2001-04-06. Completion date: 2001-06-10.
$60,450 with Defense Logistics Agency for Switches. Signed on 1999-11-08. Completion date: 1999-12-23.
$45,000 with Defense Logistics Agency for Engine Instruments. Signed on 2000-09-15. Completion date: 2000-12-14.
$36,540 with Defense Logistics Agency for Combination and Miscellaneous Instruments. Signed on 2000-11-13. Completion date: 2001-02-11.
WEED MANAGEMENT CO , INC (8512 KENNESTONE LANE in NORTH CHARLEST, SC; small business) : $101,300 in 5 contractsfrom 2001 to 2005
Contracts for Construction of Structures and Facilities -- Miscellaneous Buildings, Landscaping/Groundskeeping Services, Insect and Rodent Control Services by Navy Signed by year:2000: $0; 2001: $11,900; 2002: $29,800; 2003: $0; 2004: $0; 2005: $59,600; 2006: $0.
Biggest contracts:
$29,800 with Navy for Construction of Structures and Facilities -- Miscellaneous Buildings. Signed on 2005-12-22. Completion date: 2006-09-30.
$29,800 with Navy for Landscaping/Groundskeeping Services. Signed on 2005-03-25. Completion date: 2005-10-14.
$29,800 with Navy for Insect and Rodent Control Services. Signed on 2002-12-18. Completion date: 2004-09-29.
$11,900, same as above.Signed on 2001-10-01. Completion date: 2004-09-29.
SLEEP INN NORTH (7435 NORTHSIDE DRIVE in CHARLESTON, SC; small business) : $91,315 in 15 contractsfrom 2002 to 2005
Contracts for Lodging - Hotel/Motel by Navy, Army Signed by year:2000: $0; 2001: $0; 2002: $40,992; 2003: $0; 2004: $13,731; 2005: $36,592; 2006: $0.
Biggest contracts:
$40,992 with Navy for Lodging - Hotel/Motel. Signed on 2002-11-07. Completion date: 2002-11-14.
$11,712 with Army for Lodging - Hotel/Motel. Signed on 2005-12-29. Completion date: 2006-02-03.
$6,072 with Navy for Lodging - Hotel/Motel. Signed on 2004-07-15. Completion date: 2004-10-21.
$5,313, same as above.Signed on 2004-07-15. Completion date: 2004-10-21.
DYNAMARC PRECISION POWER INC (5081 COOSAW CREEK BLVD in NORTH CHARLEST, SC; small business) : $84,541 in 4 contractsfrom 2003 to 2005
$39,987 with Navy for Miscellaneous Electrical and Electronic Components. Signed on 2003-12-02. Completion date: 2004-05-30.
$27,260, same as above.Signed on 2003-02-11. Completion date: 2003-12-31.
$14,316, same as above.Signed on 2005-01-10. Completion date: 2005-06-28.
$2,978 with Navy for Maintenance, Repair and Rebuilding of Equipment -- Miscellaneous. Signed on 2004-11-23. Completion date: 2004-12-01.
COMMVERGENCE INCORPORATED (8540 LYNN HAVEN LANE in NORTH CHARLEST, SC; small business) 50 employees, $0 revenue. Woman Owned Business: $74,808 in 6 contractsfrom 2004 to 2005
Contracts for Other ADP and Telecommunications Services (includes data storage on tapes, compact disks, etc.) by Army, U.S. Army Corps of Engineers - civil program financing only Signed by year:2000: $0; 2001: $0; 2002: $0; 2003: $0; 2004: $36,670; 2005: $38,138; 2006: $0.
Biggest contracts:
$19,069 with Army for Other ADP and Telecommunications Services (includes data storage on tapes, compact disks, etc.). Signed on 2005-09-16. Completion date: 2006-08-30.
$19,069 with U.S. Army Corps of Engineers - civil program financing only for Other ADP and Telecommunications Services (includes data storage on tapes, compact disks, etc.). Signed on 2005-09-16. Completion date: 2006-08-30.
$18,335, same as above.Signed on 2004-08-06. Completion date: 2003-09-24.
$18,335 with Army for Other ADP and Telecommunications Services (includes data storage on tapes, compact disks, etc.). Signed on 2004-08-06. Completion date: 2003-09-24.
FAIRFIELD INN (7415 NORTHSIDE DRIVE in NORTH CHARLEST, SC; small business) : $53,520 in 4 contractsfrom 2002 to 2003
$35,840 with Navy for Non-nuclear Ship Repair (East) Ship repair (including overhauls and conversions) performed on non-nuclear propelled and nonpropelled ships east of the 108th meridian. Signed on 2002-10-07. Completion date: 2002-11-18.
$12,544, same as above.Signed on 2002-10-24. Completion date: 2002-11-18.
$3,264, same as above.Signed on 2003-01-13. Completion date: 2002-11-18.
$1,872 with Army for Lodging - Hotel/Motel. Signed on 2003-05-19. Completion date: 2003-05-19.
TOWN & COUNTRY INN INC (7424 NORTHSIDE in NORTH CHARLEST, SC) : $31,989 in 5 contractsin 2004
Contracts for Lodging - Hotel/Motel by Army Signed by year:2000: $0; 2001: $0; 2002: $0; 2003: $0; 2004: $31,989; 2005: $0; 2006: $0.
Biggest contracts:
$15,675 with Army for Lodging - Hotel/Motel. Signed on 2004-09-28. Completion date: 2004-09-29.
$11,172, same as above.Signed on 2004-10-12. Completion date: 2004-10-19.
$6,600, same as above.Signed on 2004-08-14. Completion date: 2004-09-17.
$600, same as above.Signed on 2004-09-19. Completion date: 2004-09-17.
RENTAL UNIFORM SERVICE OF FLOR (7607 SOUTHRAIL RD in NORTH CHARLEST, SC) : $25,387 in 5 contractsfrom 2004 to 2005
Contracts for Laundry and DryCleaning Services by Defense Commissary Agency, Navy Signed by year:2000: $0; 2001: $0; 2002: $0; 2003: $0; 2004: $12,863; 2005: $12,524; 2006: $0.
Biggest contracts:
$13,276 with Defense Commissary Agency for Laundry and DryCleaning Services. Signed on 2005-05-26. Completion date: 2006-06-30.
$12,285 with Navy for Laundry and DryCleaning Services. Signed on 2004-09-30. Completion date: 2004-09-30.
$578, same as above.Signed on 2004-05-10. Completion date: 2004-09-30.
$0, same as above.Signed on 2004-05-10. Completion date: 2004-09-30.
FORSIGHT RESOURCES (8761 DORCHESTER RD STE 101 in NORTH CHARLEST, SC; small business)
$18,192 with Navy for Communications Security Equipment and Components. Signed on 2005-10-06. Completion date: 2005-11-16.
Top industries in this zip code by the number of employees in 2005:
2002 - 2018 National Fire Incident Reporting System (NFIRS) incidents
Based on the data from the years 2002 - 2018 the average number of fires per year is 70. The highest number of reported fire incidents - 111 took place in 2017, and the least - 25 in 2003. The data has an increasing trend.
When looking into fire subcategories, the most incidents belonged to: Structure Fires (47.8%), and Outside Fires (40.1%).
Fire incident types reported to NFIRS in Zip Code 29420


 Nearest zip codes: 29418, 29423, 29456, 29404, 29406, 29485.


 Based on the data from the years 2002 - 2018 the average number of fires per year is 70. The highest number of reported fire incidents - 111 took place in 2017, and the least - 25 in 2003. The data has an increasing trend.
 When looking into fire subcategories, the most incidents belonged to: Structure Fires (47.8%), and Outside Fires (40.1%).