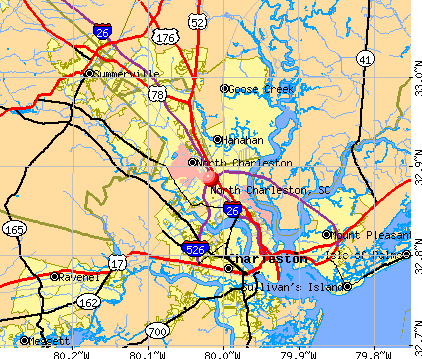
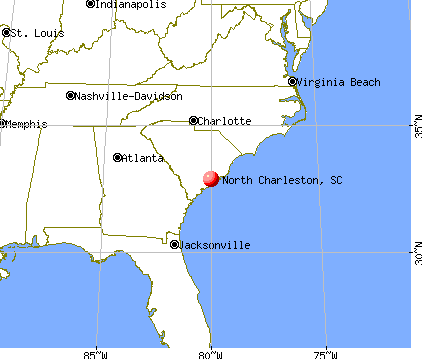
North Charleston, South Carolina
North Charleston: popular north charleston neighboorhood
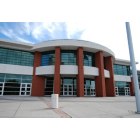
North Charleston: city building
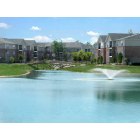
North Charleston: A North Chalreston Apts
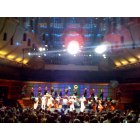
North Charleston: Inside North Charleston Coliseum
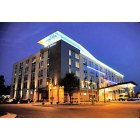
North Charleston: loft hotel in north charleston,sc
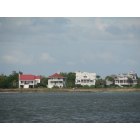
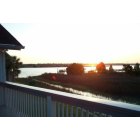
North Charleston: view from river
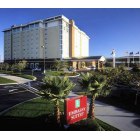
North Charleston: embassy suites

North Charleston: Loft Hotel North Charleston
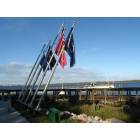
North Charleston: North Charleston River Front Park

North Charleston: Bird Resting on a Tree limb at Lake Moutrie Cross
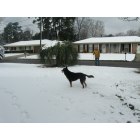
North Charleston: North Charleston First Snow in 18 years
- see
14
more - add
your
Submit your own pictures of this city and show them to the world
- OSM Map
- General Map
- Google Map
- MSN Map
Population change since 2000: +48.9%
| Males: 58,349 | |
| Females: 60,259 |
| Median resident age: | 33.5 years |
| South Carolina median age: | 40.5 years |
Zip codes: 29404, 29418, 29420, 29423.
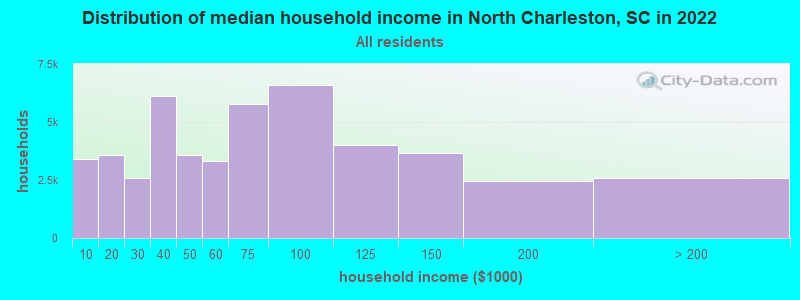
North Charleston Zip Code Map| North Charleston: | $62,091 |
| SC: | $64,115 |
Estimated per capita income in 2022: $32,705 (it was $14,361 in 2000)
North Charleston city income, earnings, and wages data
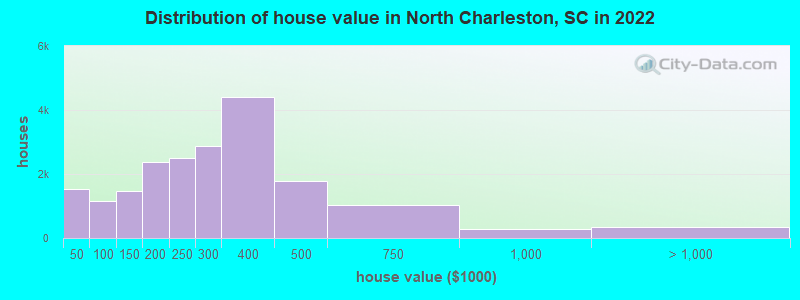
Estimated median house or condo value in 2022: $310,700 (it was $64,500 in 2000)
| North Charleston: | $310,700 |
| SC: | $254,600 |
Mean prices in 2022: all housing units: $262,400; detached houses: $286,451; townhouses or other attached units: $203,658; in 2-unit structures: $565,522; in 3-to-4-unit structures: $124,962; in 5-or-more-unit structures: $286,292; mobile homes: $53,883
Median gross rent in 2022: $1,291.
North Charleston, SC residents, houses, and apartments details
(11.7% for White Non-Hispanic residents, 19.2% for Black residents, 18.9% for Hispanic or Latino residents, 31.9% for American Indian residents, 25.8% for Native Hawaiian and other Pacific Islander residents, 23.0% for other race residents, 15.6% for two or more races residents)
Detailed information about poverty and poor residents in North Charleston, SC


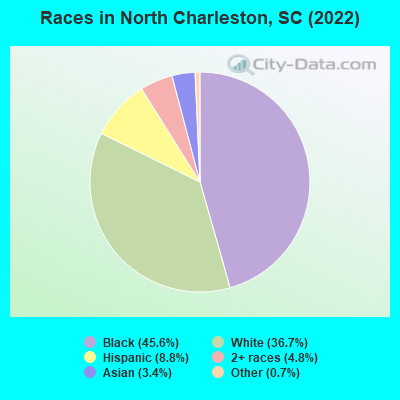
- 54,03145.6%Black alone
- 43,47436.7%White alone
- 10,4218.8%Hispanic
- 5,7334.8%Two or more races
- 4,0793.4%Asian alone
- 8000.7%Other race alone
- 660.06%American Indian alone
Races in North Charleston detailed stats: ancestries, foreign born residents, place of birth
According to our research of South Carolina and other state lists, there were 43 registered sex offenders living in North Charleston, South Carolina as of April 27, 2024.
The ratio of all residents to sex offenders in North Charleston is 2,570 to 1.
The ratio of registered sex offenders to all residents in this city is lower than the state average.
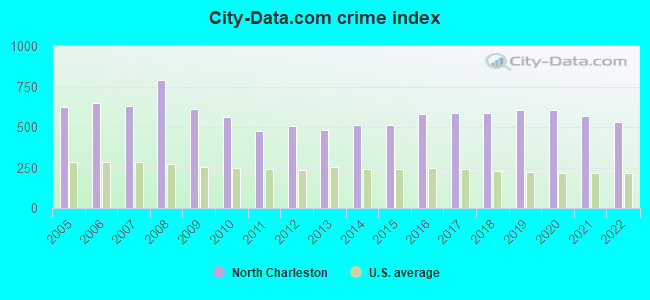
The City-Data.com crime index weighs serious crimes and violent crimes more heavily. Higher means more crime, U.S. average is 246.1. It adjusts for the number of visitors and daily workers commuting into cities.
- means the value is smaller than the state average.- means the value is about the same as the state average.
- means the value is bigger than the state average.
- means the value is much bigger than the state average.
Crime rate in North Charleston detailed stats: murders, rapes, robberies, assaults, burglaries, thefts, arson
Full-time law enforcement employees in 2021, including police officers: 166 (145 officers - 118 male; 27 female).
| Officers per 1,000 residents here: | 1.20 |
| South Carolina average: | 2.21 |
 Recent articles from our blog. Our writers, many of them Ph.D. graduates or candidates, create easy-to-read articles on a wide variety of topics.

 | Racquetball courts and tennis courts in North Charleston (1 reply) |
| 65 year of male veteran moving to North Charleston from Los Angeles (12 replies) |
| North Charleston, quick question. (4 replies) |
| Confederate statues to come down (270 replies) |
| What's Going On In North Charleston?? (60 replies) |
| And at #25 in the country for murder: North Charleston (40 replies) |
Latest news from North Charleston, SC collected exclusively by city-data.com from local newspapers, TV, and radio stations
Ancestries: American (9.5%), English (3.6%), Irish (2.7%), German (2.5%), African (1.8%), European (1.2%).
Current Local Time: EST time zone
Land area: 58.5 square miles.
Population density: 2,026 people per square mile (low).
12,310 residents are foreign born (6.0% Latin America, 2.7% Asia, 1.0% Europe).
| This city: | 10.4% |
| South Carolina: | 5.3% |
Median real estate property taxes paid for housing units with mortgages in 2022: $1,950 (0.6%)
Median real estate property taxes paid for housing units with no mortgage in 2022: $1,203 (0.4%)
Nearest city with pop. 200,000+: Charlotte, NC  (167.2 miles , pop. 540,828).
Nearest city with pop. 1,000,000+: Philadelphia, PA (561.5 miles , pop. 1,517,550).
Nearest cities:
), ), Latitude: 32.89 N, Longitude: 80.02 W
Daytime population change due to commuting: +39,698 (+33.5%)
Workers who live and work in this city: 28,435 (45.7%)
Area code commonly used in this area: 843
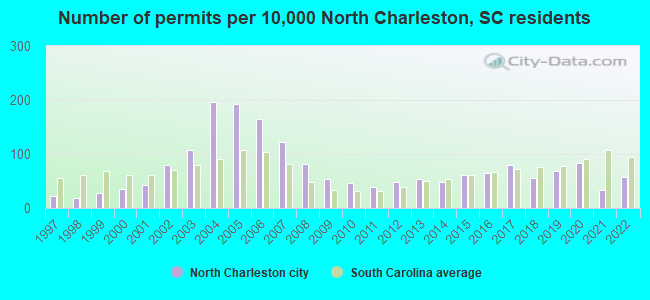
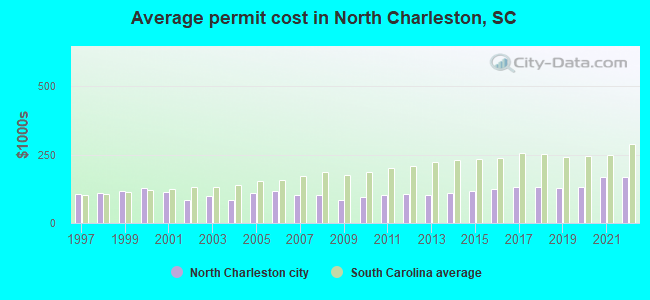
Single-family new house construction building permits:
- 2022: 456 buildings, average cost: $166,600
- 2021: 264 buildings, average cost: $169,400
- 2020: 672 buildings, average cost: $132,300
- 2019: 549 buildings, average cost: $128,800
- 2018: 448 buildings, average cost: $130,200
- 2017: 629 buildings, average cost: $131,100
- 2016: 515 buildings, average cost: $123,900
- 2015: 483 buildings, average cost: $117,400
- 2014: 386 buildings, average cost: $109,000
- 2013: 427 buildings, average cost: $102,000
- 2012: 388 buildings, average cost: $106,400
- 2011: 300 buildings, average cost: $100,800
- 2010: 374 buildings, average cost: $94,900
- 2009: 421 buildings, average cost: $86,100
- 2008: 646 buildings, average cost: $102,300
- 2007: 971 buildings, average cost: $102,100
- 2006: 1316 buildings, average cost: $117,200
- 2005: 1537 buildings, average cost: $109,900
- 2004: 1559 buildings, average cost: $84,200
- 2003: 864 buildings, average cost: $98,800
- 2002: 633 buildings, average cost: $84,900
- 2001: 339 buildings, average cost: $113,000
- 2000: 275 buildings, average cost: $128,100
- 1999: 218 buildings, average cost: $117,600
- 1998: 155 buildings, average cost: $108,600
- 1997: 177 buildings, average cost: $105,200
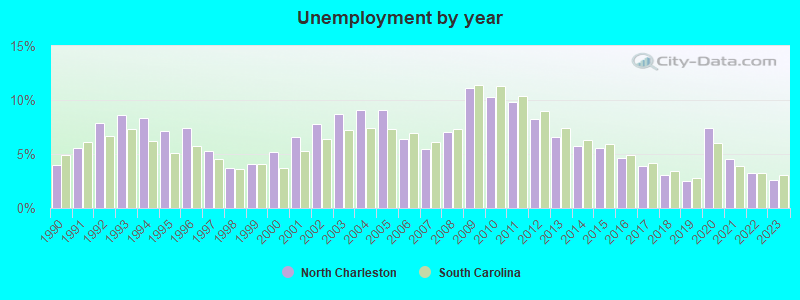
| Here: | 2.6% |
| South Carolina: | 3.1% |
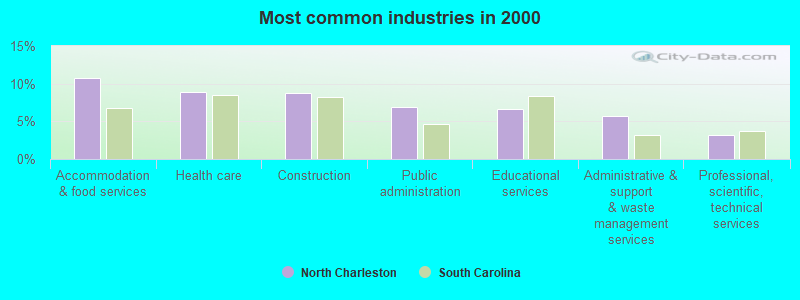
- Accommodation & food services (10.7%)
- Health care (8.9%)
- Construction (8.7%)
- Public administration (6.9%)
- Educational services (6.6%)
- Administrative & support & waste management services (5.7%)
- Professional, scientific, technical services (3.2%)
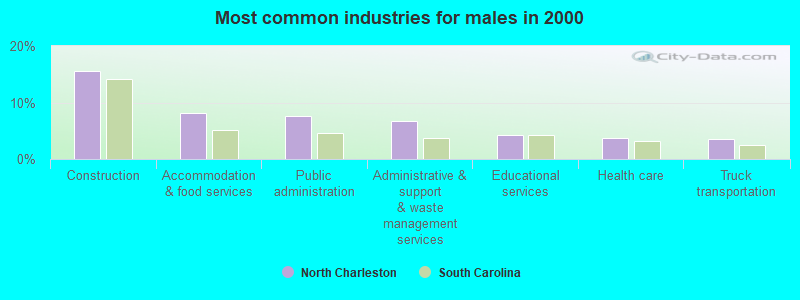
- Construction (15.5%)
- Accommodation & food services (8.1%)
- Public administration (7.6%)
- Administrative & support & waste management services (6.7%)
- Educational services (4.2%)
- Health care (3.6%)
- Truck transportation (3.5%)
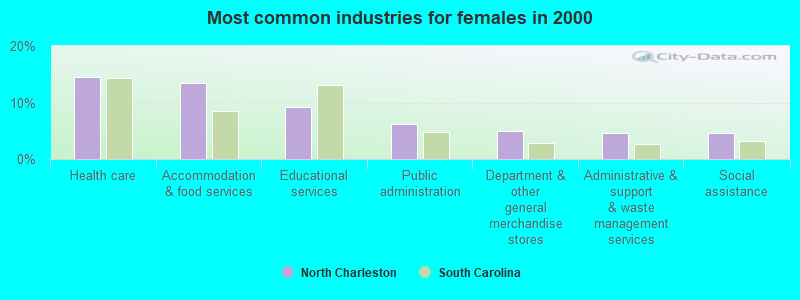
- Health care (14.5%)
- Accommodation & food services (13.4%)
- Educational services (9.2%)
- Public administration (6.1%)
- Department & other general merchandise stores (5.0%)
- Administrative & support & waste management services (4.6%)
- Social assistance (4.6%)
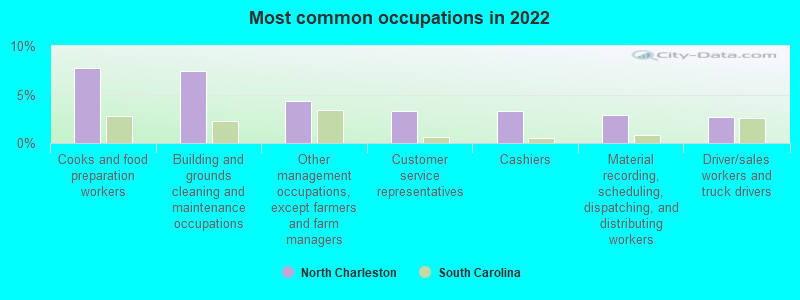
- Cooks and food preparation workers (7.8%)
- Building and grounds cleaning and maintenance occupations (7.4%)
- Other management occupations, except farmers and farm managers (4.4%)
- Customer service representatives (3.3%)
- Cashiers (3.3%)
- Material recording, scheduling, dispatching, and distributing workers (2.8%)
- Driver/sales workers and truck drivers (2.7%)
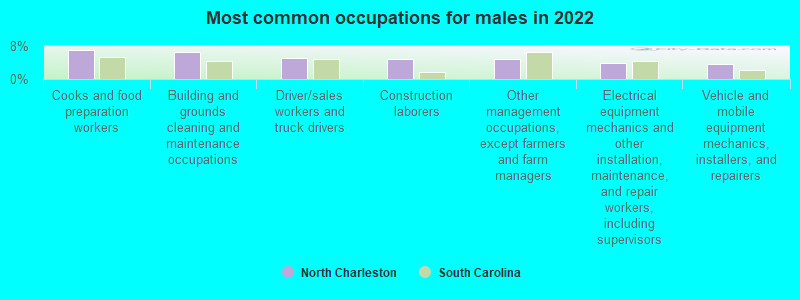
- Cooks and food preparation workers (7.1%)
- Building and grounds cleaning and maintenance occupations (6.5%)
- Driver/sales workers and truck drivers (5.1%)
- Construction laborers (4.8%)
- Other management occupations, except farmers and farm managers (4.8%)
- Electrical equipment mechanics and other installation, maintenance, and repair workers, including supervisors (3.9%)
- Vehicle and mobile equipment mechanics, installers, and repairers (3.6%)
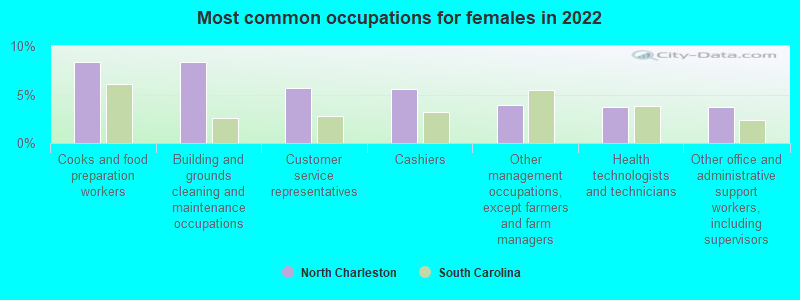
- Cooks and food preparation workers (8.4%)
- Building and grounds cleaning and maintenance occupations (8.3%)
- Customer service representatives (5.6%)
- Cashiers (5.6%)
- Other management occupations, except farmers and farm managers (4.0%)
- Health technologists and technicians (3.7%)
- Other office and administrative support workers, including supervisors (3.7%)
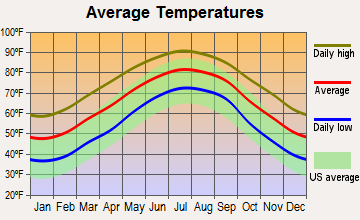
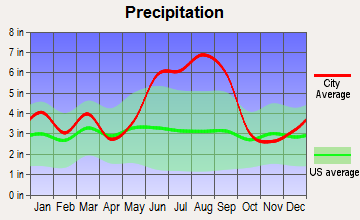
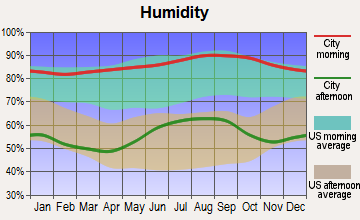
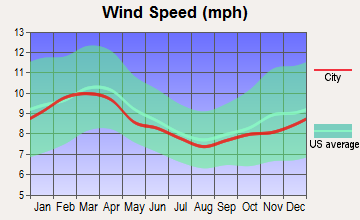
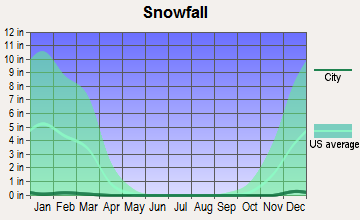
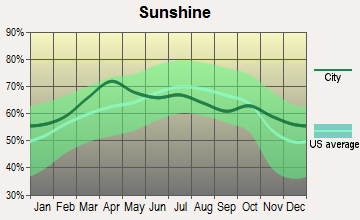
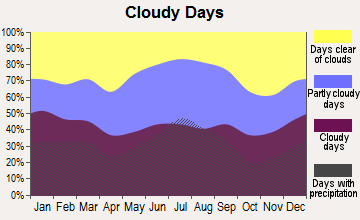
Average climate in North Charleston, South Carolina
Based on data reported by over 4,000 weather stations
|
|

(lower is better)
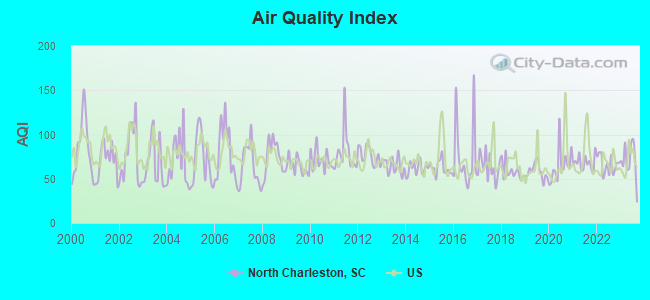
Air Quality Index (AQI) level in 2023 was 69.9. This is about average.
| City: | 69.9 |
| U.S.: | 72.6 |
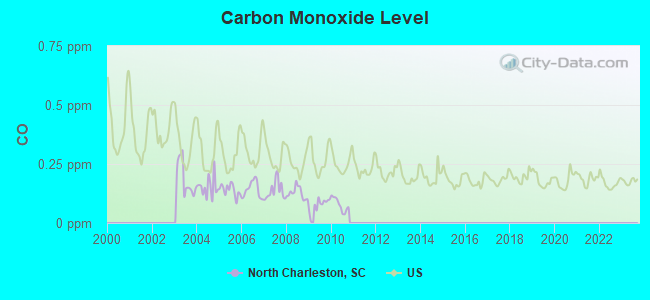
Carbon Monoxide (CO) [ppm] level in 2010 was 0.0779. This is significantly better than average. Closest monitor was 21.2 miles away from the city center.
| City: | 0.0779 |
| U.S.: | 0.2513 |
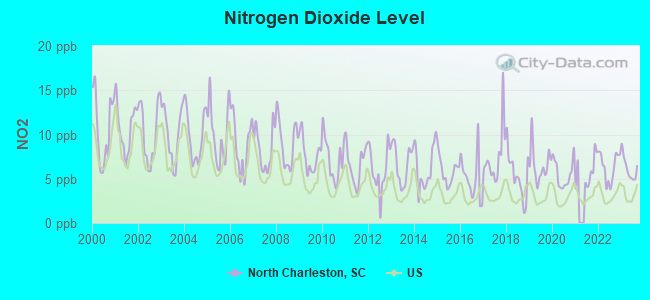
Nitrogen Dioxide (NO2) [ppb] level in 2023 was 6.19. This is worse than average. Closest monitor was 2.3 miles away from the city center.
| City: | 6.19 |
| U.S.: | 5.11 |
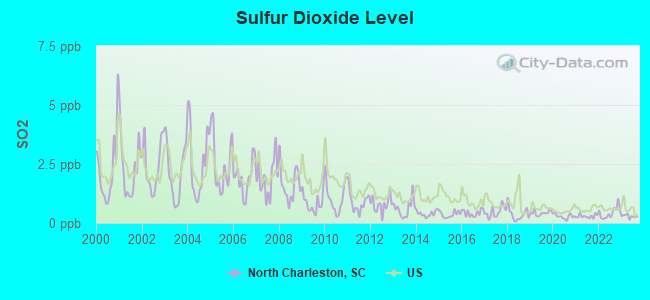
Sulfur Dioxide (SO2) [ppb] level in 2023 was 0.288. This is significantly better than average. Closest monitor was 2.3 miles away from the city center.
| City: | 0.288 |
| U.S.: | 1.515 |
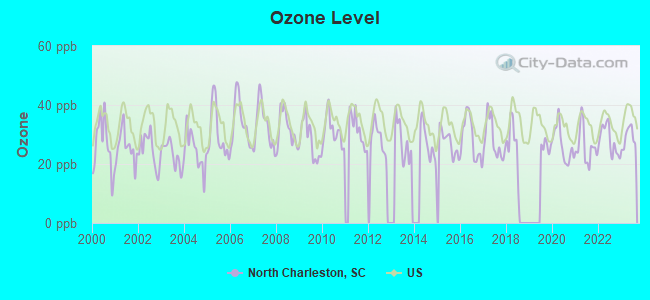
Ozone [ppb] level in 2023 was 29.0. This is about average. Closest monitor was 3.5 miles away from the city center.
| City: | 29.0 |
| U.S.: | 33.3 |
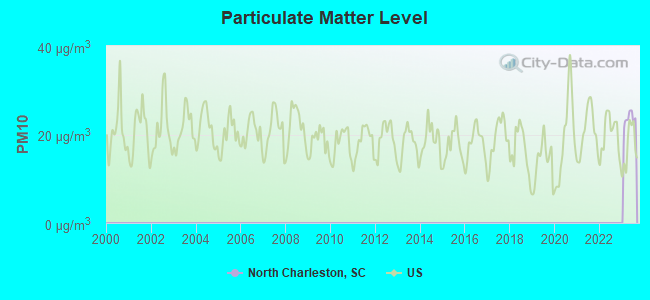
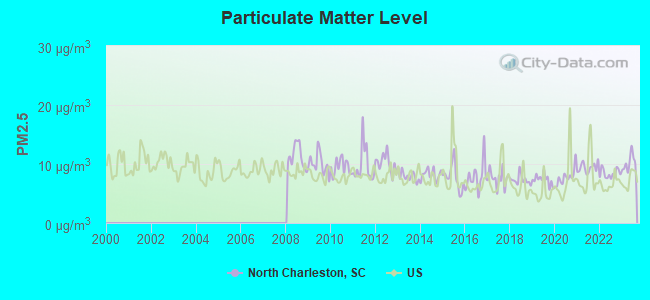
Particulate Matter (PM2.5) [µg/m3] level in 2023 was 10.2. This is worse than average. Closest monitor was 4.5 miles away from the city center.
| City: | 10.2 |
| U.S.: | 8.1 |
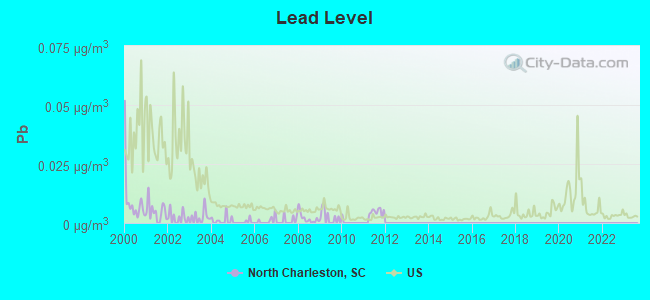
Lead (Pb) [µg/m3] level in 2011 was 0.00361. This is significantly better than average. Closest monitor was 2.3 miles away from the city center.
| City: | 0.00361 |
| U.S.: | 0.00931 |
Tornado activity:
North Charleston-area historical tornado activity is below South Carolina state average. It is 43% smaller than the overall U.S. average.
On 9/11/1960, a category F3 (max. wind speeds 158-206 mph) tornado 6.3 miles away from the North Charleston city center injured 10 people and caused between $500,000 and $5,000,000 in damages.
On 5/10/1998, a category F2 (max. wind speeds 113-157 mph) tornado 6.6 miles away from the city center killed one person and injured 7 people and caused $5 million in damages.
Earthquake activity:
North Charleston-area historical earthquake activity is significantly above South Carolina state average. It is 51% smaller than the overall U.S. average.On 11/22/1974 at 05:25:55, a magnitude 4.7 (4.7 MB, Class: Light, Intensity: IV - V) earthquake occurred 7.5 miles away from North Charleston center
On 8/21/1992 at 16:31:55, a magnitude 4.4 (4.1 MB, 4.1 LG, 4.4 LG, Depth: 6.2 mi) earthquake occurred 12.8 miles away from North Charleston center
On 8/2/1974 at 08:52:09, a magnitude 4.9 (4.3 MB, 4.9 LG) earthquake occurred 158.2 miles away from the city center
On 8/23/2011 at 17:51:04, a magnitude 5.8 (5.8 MW, Depth: 3.7 mi, Class: Moderate, Intensity: VI - VII) earthquake occurred 366.8 miles away from the city center
On 4/17/1995 at 13:45:57, a magnitude 3.9 (3.9 LG, Depth: 6.2 mi, Class: Light, Intensity: II - III) earthquake occurred 5.2 miles away from North Charleston center
On 11/11/2002 at 23:39:29, a magnitude 4.0 (4.0 MB, Depth: 1.5 mi) earthquake occurred 33.6 miles away from the city center
Magnitude types: regional Lg-wave magnitude (LG), body-wave magnitude (MB), moment magnitude (MW)
Natural disasters:
The number of natural disasters in Charleston County (17) is near the US average (15).Major Disasters (Presidential) Declared: 7
Emergencies Declared: 6
Causes of natural disasters: Hurricanes: 9, Floods: 2, Storms: 2, Tropical Storms: 2, Winter Storms: 2, Drought: 1, Other: 1 (Note: some incidents may be assigned to more than one category).
Main business address for: POLYMER GROUP INC (BROADWOVEN FABRIC MILS, MAN MADE FIBER & SILK).
Hospitals and medical centers in North Charleston:
- HEALTHSOUTH OF CHARLESTON, INC (9181 MEDCOM ST)
- HOSPICE OF CHARLESTON (3870 LEEDS AVE SUITE 101)
- ODYSSEY HEALTHCARE (5965 CORE AVENUE, SUITE 603)
- ROPER HOSPITAL NORTH INC (2750 SPEISSEGGER DR)
- AMEDISYS HOME HEALTH OF CHARLESTON (2675 LAKE PARK DRIVE)
- CAROLINA HOME HEALTH CARE (4975 LACROSS RD, STE 101)
- DHEC REGION 7 HOME HEALTH SERVICES (4050 BRIDGEVIEW DRIVE SUITE 600)
- BAKER HOSPITAL LONG TERM CARE UNIT (2750 SPEISSEGGER DRIVE)
Amtrak station near North Charleston:
Colleges/Universities in North Charleston:
- Southeastern Institute-Charleston (Full-time enrollment: 358; Location: 4600 Goer Dr, Ste 105; Private, for-profit; Website: www.southeasterninstitute.com)
- Virginia College-Charleston (Full-time enrollment: 326; Location: 6185 Rivers Avenue; Private, for-profit; Website: www.vc.edu/charleston)
- ITT Technical Institute-North Charleston (Full-time enrollment: 256; Location: 2431 W Aviation Ave; Private, for-profit; Website: www.itt-tech.edu)
- Paul Mitchell The School-Charleston (Full-time enrollment: 242; Location: 4952 Centre Pointe Drive, Suite 114; Private, for-profit; Website: charleston.paulmitchell.edu)
- Centura College-North Charleston (Full-time enrollment: 182; Location: 8088 Rivers Ave; Private, for-profit; Website: www.centuracollege.edu)
Colleges/universities with over 2000 students nearest to North Charleston:
- Trident Technical College (about 3 miles; Charleston, SC; Full-time enrollment: 13,125)
- Citadel Military College of South Carolina (about 7 miles; Charleston, SC; FT enrollment: 3,683)
- Charleston Southern University (about 8 miles; Charleston, SC; FT enrollment: 3,012)
- Medical University of South Carolina (about 8 miles; Charleston, SC; FT enrollment: 2,138)
- College of Charleston (about 9 miles; Charleston, SC; FT enrollment: 10,974)
- South Carolina State University (about 65 miles; Orangeburg, SC; FT enrollment: 3,481)
- Orangeburg Calhoun Technical College (about 66 miles; Orangeburg, SC; FT enrollment: 2,113)
Public high schools in North Charleston:
- FORT DORCHESTER HIGH (Students: 2,242, Location: 8500 PATRIOT BOULEVARD, Grades: 9-12)
- R. B. STALL HIGH (Students: 950, Location: 3625 ASHLEY PHOSPHATE ROAD, Grades: 9-12)
- GARRETT ACADEMY OF TECHNOLOGY (Students: 730, Location: 2731 GORDON STREET, Grades: 9-12)
- NORTH CHARLESTON HIGH (Students: 619, Location: 1087 EAST MONTAGUE AVENUE, Grades: 9-12)
- ACADEMIC MAGNET HIGH (Students: 608, Location: 5109-A WEST ENTERPRISE STREET, Grades: 9-12)
- MILITARY MAGNET ACADEMY (Students: 490, Location: 2950 CARNER AVENUE, Grades: 6-12)
- CHARLESTON SCHOOL OF THE ARTS (Location: 5109-B WEST ENTERPRISE STREET, Grades: 6-12)
- PALMETTO SCHOLARS ACADEMY (Location: 2415 AVENUE F, Grades: 6-12, Charter school)
Private high schools in North Charleston:
Biggest public elementary/middle schools in North Charleston:
- RIVER OAKS MIDDLE (Students: 863, Location: 8642 RIVER OAKS DRIVE, Grades: 6-8)
- EAGLE NEST ELEMENTARY (Students: 830, Location: 8640 RIVER OAKS DRIVE, Grades: PK-5)
- W. B. GOODWIN ELEMENTARY (Students: 693, Location: 5501 DORCHESTER ROAD, Grades: PK-5)
- A. C. CORCORAN ELEMENTARY (Students: 635, Location: 8585 VISTAVIA ROAD, Grades: PK-5)
- PEPPERHILL ELEMENTARY (Students: 589, Location: 3300 CREOLA ROAD, Grades: PK-5)
- HUNLEY PARK ELEMENTARY (Students: 511, Location: 1000 MICHIGAN AVENUE, Grades: PK-5)
- JERRY ZUCKER MIDDLE SCHOOL OF SCIENCE (Students: 462, Location: 6401 DORCHESTER ROAD, Grades: 6-8)
- EDMUND A. BURNS ELEMENTARY (Students: 410, Location: 3750 DORCHESTER ROAD, Grades: PK-5)
- LAMBS ELEMENTARY (Students: 398, Location: 6800 DORCHESTER ROAD, Grades: PK-5)
- MARY FORD ELEMENTARY (Students: 363, Location: 3180 THOMASINA MCPERSON BLVD, Grades: PK-5)
Private elementary/middle school in North Charleston:
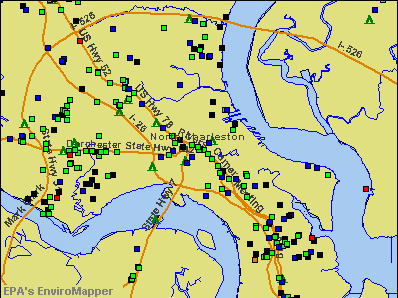
Points of interest:
Notable locations in North Charleston: Sevenmile (A), Sixmile (B), Ashley Phosphate (C), Jenkins Orphanage (D), Live Oak Hall (E), Camp Gregg (F), Bry Hawke Industrial Park (G), Colony North Industrial Park (H), Ladson Station Industrial Park (I), Faber Place (J), International Commerce Park (K), Palmetto Commercial Center (L), Bentwood Plaza (M), Festival Center (N), North Pointe Plaza (O), Northwoods Point (P), Shipwatch Square (Q), US Air Force Moral Welfare and Recreation Services Golf Course (R), Stark Industrial Park (S), Cooper River Marina (T). Display/hide their locations on the map
Shopping Centers: Pine Haven Plaza Shopping Center (1), Pepperhill Square Shopping Center (2), Otranto Plaza Shopping Center (3), Oak Ridge Plaza Shopping Center (4), Northwoods Merchant Plaza Shopping Center (5), Northwoods Mall Shopping Center (6), Northrivers Market Shopping Center (7), North Fiftytwo Square Shopping Center (8), North Charleston Shopping Center (9). Display/hide their locations on the map
Main business address in North Charleston: POLYMER GROUP INC (A). Display/hide its location on the map
Churches in North Charleston include: Promised Land Church (A), Rhett Avenue Church (B), Saint Pauls Church (C), Saint Peters Church (D), Aldersgate Church (E), Deer Park Church (F), Peace Lutheran Church (G), Ashley River Church of God (H), Charleston Southern University Lightsey Chapel (I). Display/hide their locations on the map
Cemeteries: Riverview Memorial Park (1), Oak Grove Cemetery (2), Carolina Memorial Gardens (3), Johnson Cemetery (4), Sunset Memorial Cemetery (5). Display/hide their locations on the map
Swamps: Bluehouse Swamp (A). Display/hide its location on the map
Streams, rivers, and creeks: Spencer Branch (A), Sawpit Creek (B), Popperdam Creek (C), Noisette Creek (D), McChune Branch (E), Brickyard Creek (F), Filbin Creek (G), Federwitz Branch (H). Display/hide their locations on the map
Parks in North Charleston include: Park Circle (1), Bentley Park (2), Midland Park (3), Liberty Hill Park (4), Hillsdale Park (5), Fellowship Road Park (6), Swamp Park (7), Danny Jones Park (8), Woodahl Park (9). Display/hide their locations on the map
Tourist attractions: Mims Amusement CO (Amusement & Theme Parks; 2681 Spruill Avenue) (1), Air Conditioned Kitchenettes (Amusement & Theme Parks; 3387 Ashley Phosphate Road) (2), Craig's Amusements LLC (Amusement & Theme Parks; 5700 Dorchester Road) (3), AAA Amusement CO (Amusement & Theme Parks; 1808 Meeting Street Road) (4), Beach Bingo (Amusement & Theme Parks; 4307 Rivers Avenue) (5), Holliday Amusement CO Inc (Amusement & Theme Parks; 1808 Meeting Street Road) (6), Frankie's Fun Park (Amusement & Theme Parks; 5000 Ashley Phosphate Road) (7), Collins Entertainment Corporation (Amusement & Theme Parks; 7329 Spa Road) (8), Tourist Pack Marketing (2132 Dorchester Road) (9). Display/hide their approximate locations on the map
Hotels: Howard Johnson Inn Charleston (3640 Dorchester Road) (1), Econo Lodge North Charleston (4725 Saul White Boulevard) (2), Holiday Inn Express Hotel & Suites (7670 Northwoods Boulevard) (3), Comfort Inn Suites (7435 Northside Drive) (4), Four Seasons Environmental Inc (1050 Remount Road) (5), Chs/Arpt/Coliseum/ConvCtr Area (4620 Dorchester Road) (6), Hampton Inn Charleston North (7424 Northside Drive) (7), Howard Johnson Express (2512 Ashley Phosphate Road) (8), LA Quinta Inn - Airport Area (2499 La Quinta Lane) (9). Display/hide their approximate locations on the map
Courts: Family Court Of Charleston County - Detention Home (Leeds Avenue) (1), North Charleston City - Municipal Court (2536 4th Street) (2). Display/hide their approximate locations on the map
Birthplace of: Carlos Dunlap - College football player, Nehemiah Broughton - 2005 NFL player (Washington Redskins, born: Nov 4, 1982), Mendel Jackson Davis - Politician.
| This city: | 2.5 people |
| South Carolina: | 2.5 people |
| This city: | 62.3% |
| Whole state: | 67.5% |
| This city: | 8.2% |
| Whole state: | 6.0% |
Likely homosexual households (counted as self-reported same-sex unmarried-partner households)
- Lesbian couples: 0.5% of all households
- Gay men: 0.3% of all households
People in group quarters in North Charleston in 2010:
- 1,610 people in local jails and other municipal confinement facilities
- 956 people in college/university student housing
- 477 people in military barracks and dormitories (nondisciplinary)
- 283 people in nursing facilities/skilled-nursing facilities
- 168 people in correctional residential facilities
- 76 people in group homes intended for adults
- 75 people in other noninstitutional facilities
- 64 people in residential treatment centers for adults
- 34 people in mental (psychiatric) hospitals and psychiatric units in other hospitals
- 34 people in maritime/merchant vessels
- 29 people in group homes for juveniles (non-correctional)
- 22 people in workers' group living quarters and job corps centers
- 16 people in emergency and transitional shelters (with sleeping facilities) for people experiencing homelessness
- 15 people in correctional facilities intended for juveniles
People in group quarters in North Charleston in 2000:
- 1,446 people in local jails and other confinement facilities (including police lockups)
- 1,263 people in college dormitories (includes college quarters off campus)
- 508 people in military barracks, etc.
- 457 people in nursing homes
- 373 people in other noninstitutional group quarters
- 218 people in state prisons
- 176 people in job corps and vocational training facilities
- 102 people in homes or halfway houses for drug/alcohol abuse
- 87 people in hospitals or wards for drug/alcohol abuse
- 65 people in other group homes
- 42 people in military ships
- 39 people in homes for the mentally ill
- 37 people in short-term care, detention or diagnostic centers for delinquent children
- 31 people in homes for abused, dependent, and neglected children
- 28 people in crews of maritime vessels
- 28 people in other nonhousehold living situations
- 19 people in homes for the physically handicapped
- 16 people in military transient quarters for temporary residents
- 13 people in agriculture workers' dormitories on farms
- 6 people in halfway houses
- 4 people in homes for the mentally retarded
Banks with most branches in North Charleston (2011 data):
- Wells Fargo Bank, National Association: Brentwood Plaza Branch, Port City Branch, North Rivers Market Branch, North Village Branch, Dual Lanes Branch. Info updated 2011/04/05: Bank assets: $1,161,490.0 mil, Deposits: $905,653.0 mil, headquarters in Sioux Falls, SD, positive income, 6395 total offices, Holding Company: Wells Fargo & Company
- First Citizens Bank and Trust Company, Inc.: Trident Branch, Rivers Avenue Branch, Oak Ridge Plaza Branch, Montague Branch, Ashley Phosphate Branch. Info updated 2011/08/24: Bank assets: $8,104.0 mil, Deposits: $6,880.8 mil, headquarters in Columbia, SC, positive income, 197 total offices, Holding Company: First Citizens Bancorporation, Inc.
- Bank of America, National Association: Festival Centre Branch, Aviation Avenue Branch, North Charleston Branch, Northwoods Branch. Info updated 2009/11/18: Bank assets: $1,451,969.3 mil, Deposits: $1,077,176.8 mil, headquarters in Charlotte, NC, positive income, 5782 total offices, Holding Company: Bank Of America Corporation
- Branch Banking and Trust Company: Dorchester Rd Branch, Northwoods Mall Branch, University Boulevard Branch. Info updated 2010/03/29: Bank assets: $168,867.6 mil, Deposits: $127,549.5 mil, headquarters in Winston Salem, NC, positive income, Commercial Lending Specialization, 1793 total offices, Holding Company: Bb&T Corporation
- First Federal Savings and Loan Association of Charleston: 7400 Rivers Avenue, 7850 Rivers Avenue Branch, Center Pointe Drive Branch. Info updated 2012/02/24: Bank assets: $3,140.4 mil, Deposits: $2,278.8 mil, headquarters in Charleston, SC, negative income in the last year, Mortgage Lending Specialization, 69 total offices
- CresCom Bank: North Charleston Branch at 8485 Dorchester Road, branch established on 2006/10/03. Info updated 2011/12/16: Bank assets: $825.2 mil, Deposits: $627.6 mil, headquarters in Charleston, SC, negative income in the last year, Commercial Lending Specialization, 10 total offices, Holding Company: Carolina Financial Corporation
- Synovus Bank: Charles Towne Square Branch at 2701 Mall Drive, branch established on 1978/10/19. Info updated 2011/01/25: Bank assets: $26,863.3 mil, Deposits: $22,415.0 mil, headquarters in Columbus, GA, positive income, Commercial Lending Specialization, 296 total offices, Holding Company: Synovus Financial Corp.
- Woodforest National Bank: Sc North Charleston Branch at 4920 Centre Pointe Drive, branch established on 2009/07/15. Info updated 2011/05/10: Bank assets: $3,488.9 mil, Deposits: $3,097.6 mil, headquarters in Houston, TX, positive income, Commercial Lending Specialization, 766 total offices, Holding Company: Woodforest Financial Group Employee Stock Ownership Plan (With 401(K) Provisions)
- SunTrust Bank: Coosaw Creek Branch at 8610 Dorchester Rd, branch established on 2007/10/29. Info updated 2010/05/27: Bank assets: $171,291.7 mil, Deposits: $129,833.2 mil, headquarters in Atlanta, GA, positive income, Commercial Lending Specialization, 1716 total offices, Holding Company: Suntrust Banks, Inc.
For population 15 years and over in North Charleston:
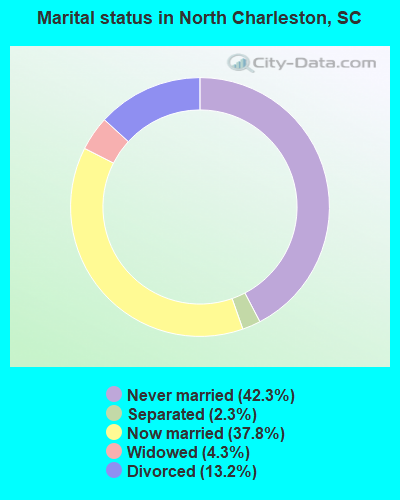
- Never married: 42.3%
- Now married: 37.8%
- Separated: 2.3%
- Widowed: 4.3%
- Divorced: 13.2%
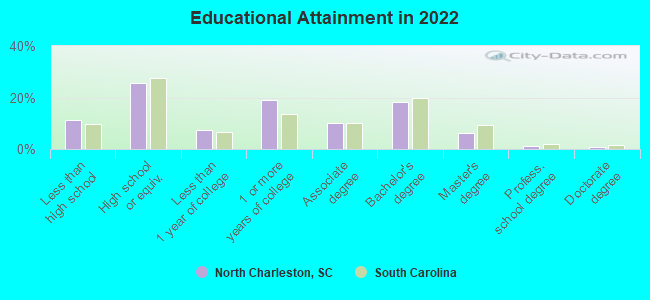
For population 25 years and over in North Charleston:
- High school or higher: 88.6%
- Bachelor's degree or higher: 26.5%
- Graduate or professional degree: 8.4%
- Unemployed: 4.0%
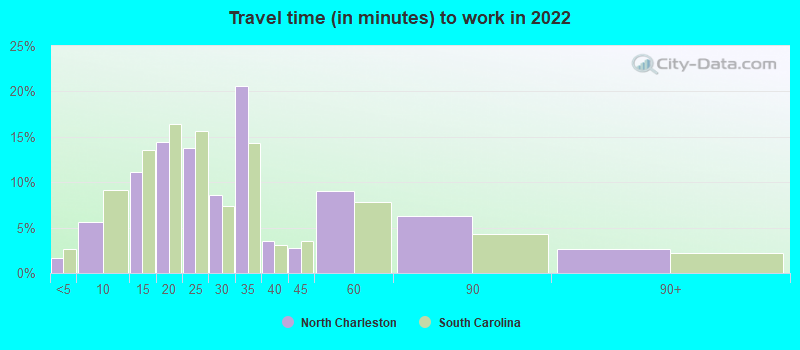
- Mean travel time to work (commute): 22.8 minutes
| Here: | 11.0 |
| South Carolina average: | 11.1 |
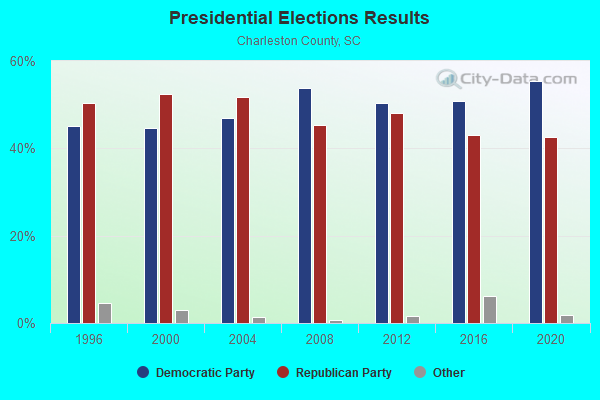
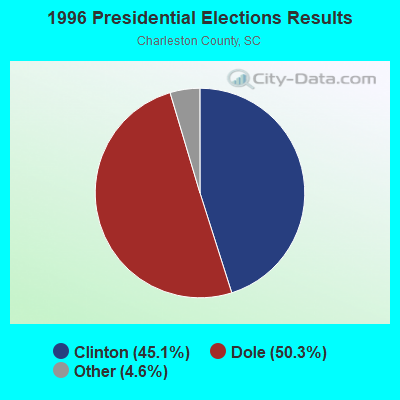
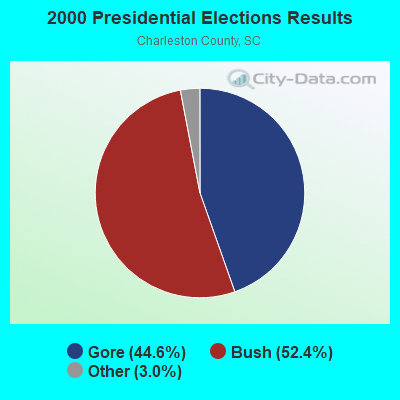
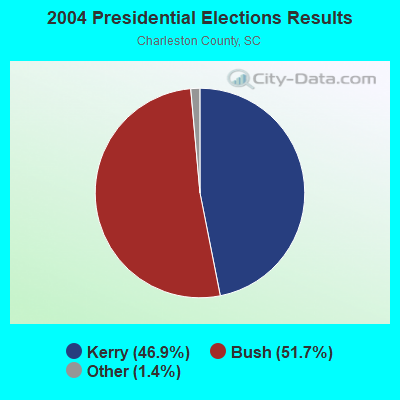
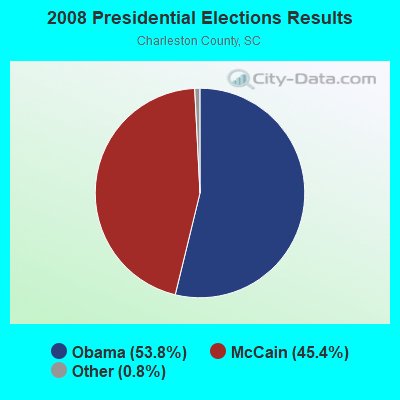
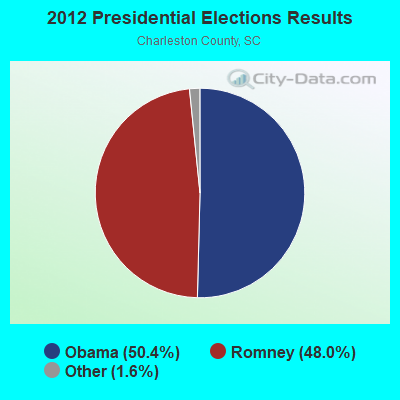
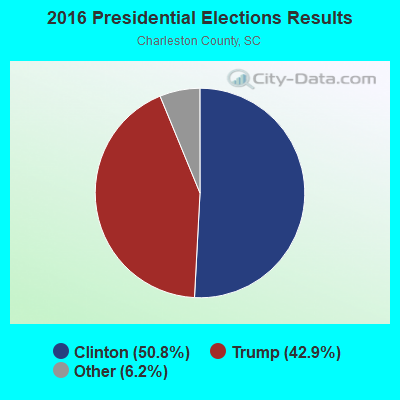
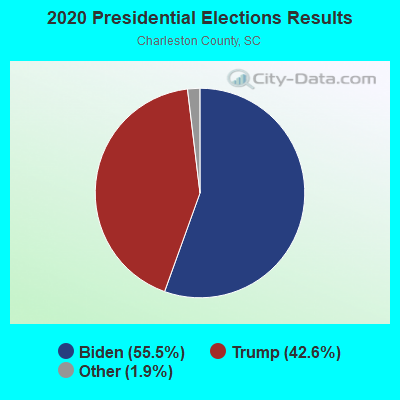
Graphs represent county-level data. Detailed 2008 Election Results
Political contributions by individuals in North Charleston, SC
Religion statistics for North Charleston, SC (based on Charleston County data)
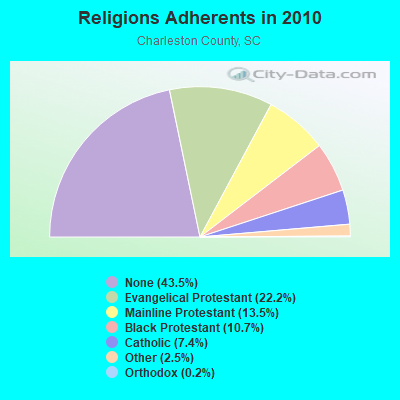
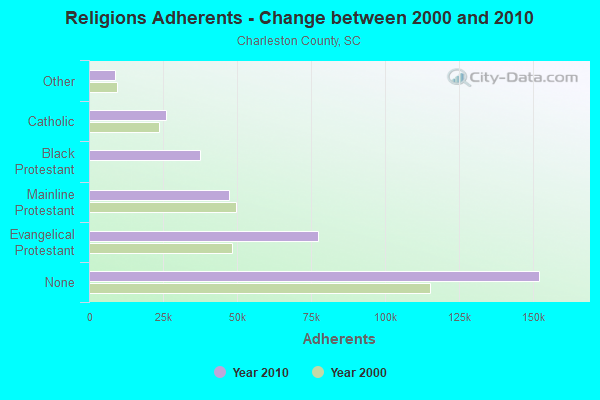
| Religion | Adherents | Congregations |
|---|---|---|
| Evangelical Protestant | 77,602 | 223 |
| Mainline Protestant | 47,209 | 106 |
| Black Protestant | 37,531 | 103 |
| Catholic | 26,003 | 19 |
| Other | 8,688 | 24 |
| Orthodox | 850 | 2 |
| None | 152,326 | - |
Food Environment Statistics:
| Charleston County: | 2.56 / 10,000 pop. |
| South Carolina: | 1.99 / 10,000 pop. |
| Charleston County: | 0.15 / 10,000 pop. |
| South Carolina: | 0.15 / 10,000 pop. |
| Charleston County: | 0.55 / 10,000 pop. |
| State: | 0.85 / 10,000 pop. |
| This county: | 4.08 / 10,000 pop. |
| South Carolina: | 5.38 / 10,000 pop. |
| This county: | 11.44 / 10,000 pop. |
| State: | 7.75 / 10,000 pop. |
| This county: | 8.8% |
| South Carolina: | 10.6% |
| This county: | 25.5% |
| South Carolina: | 29.4% |
| Here: | 13.7% |
| State: | 13.4% |
Health and Nutrition:
| Here: | 47.3% |
| South Carolina: | 49.2% |
| Here: | 44.1% |
| South Carolina: | 46.2% |
| This city: | 29.2 |
| South Carolina: | 29.0 |
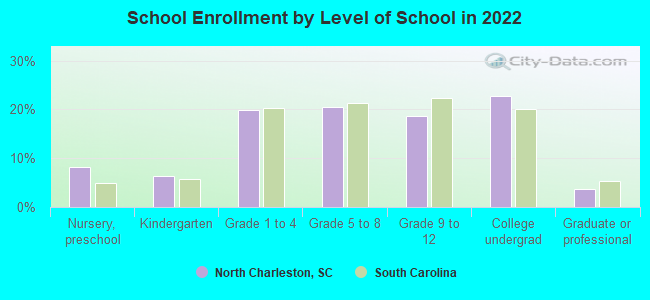
| North Charleston: | 20.0% |
| State: | 20.4% |
| North Charleston: | 12.1% |
| South Carolina: | 11.0% |
| North Charleston: | 6.7 |
| South Carolina: | 6.8 |
| This city: | 32.7% |
| South Carolina: | 34.4% |
| North Charleston: | 54.6% |
| South Carolina: | 55.6% |
| This city: | 81.5% |
| State: | 79.9% |
More about Health and Nutrition of North Charleston, SC Residents
| Local government employment and payroll (March 2022) | |||||
| Function | Full-time employees | Monthly full-time payroll | Average yearly full-time wage | Part-time employees | Monthly part-time payroll |
|---|---|---|---|---|---|
| Police Protection - Officers | 281 | $1,354,707 | $57,852 | 0 | $0 |
| Firefighters | 228 | $1,256,067 | $66,109 | 0 | $0 |
| Police - Other | 66 | $244,835 | $44,515 | 0 | $0 |
| Other and Unallocable | 52 | $247,344 | $57,079 | 25 | $2,329 |
| Streets and Highways | 51 | $202,891 | $47,739 | 0 | $0 |
| Other Government Administration | 51 | $293,794 | $69,128 | 1 | $1,356 |
| Parks and Recreation | 51 | $221,028 | $52,007 | 85 | $85,821 |
| Solid Waste Management | 47 | $159,371 | $40,690 | 4 | $3,684 |
| Sewerage | 39 | $136,094 | $41,875 | 0 | $0 |
| Financial Administration | 28 | $173,954 | $74,552 | 0 | $0 |
| Fire - Other | 19 | $83,997 | $53,051 | 0 | $0 |
| Judicial and Legal | 13 | $75,306 | $69,513 | 2 | $9,952 |
| Housing and Community Development (Local) | 1 | $7,851 | $94,212 | 0 | $0 |
| Totals for Government | 927 | $4,457,238 | $57,699 | 117 | $103,141 |
North Charleston government finances - Expenditure in 2021 (per resident):
- Construction - General Public Buildings: $45,366,000 ($382.49)
- Current Operations - Police Protection: $36,533,000 ($308.01)
Local Fire Protection: $24,402,000 ($205.74)
General - Other: $12,953,000 ($109.21)
Central Staff Services: $8,336,000 ($70.28)
Parks and Recreation: $6,840,000 ($57.67)
Solid Waste Management: $6,527,000 ($55.03)
Regular Highways: $5,108,000 ($43.07)
General Public Buildings: $5,075,000 ($42.79)
Financial Administration: $4,071,000 ($34.32)
Judicial and Legal Services: $2,099,000 ($17.70)
Parking Facilities: $582,000 ($4.91)
Housing and Community Development: $414,000 ($3.49)
- General - Interest on Debt: $10,522,000 ($88.71)
- Other Capital Outlay - Police Protection: $1,274,000 ($10.74)
Local Fire Protection: $686,000 ($5.78)
Solid Waste Management: $114,000 ($0.96)
Parks and Recreation: $83,000 ($0.70)
Regular Highways: $43,000 ($0.36)
- Total Salaries and Wages: $54,719,000 ($461.34)
North Charleston government finances - Revenue in 2021 (per resident):
- Charges - Other: $2,018,000 ($17.01)
Parks and Recreation: $612,000 ($5.16)
Parking Facilities: $450,000 ($3.79)
- Federal Intergovernmental - Other: $1,057,000 ($8.91)
Housing and Community Development: $414,000 ($3.49)
General Local Government Support: $55,000 ($0.46)
- Local Intergovernmental - General Local Government Support: $2,927,000 ($24.68)
Other: $91,000 ($0.77)
- Miscellaneous - General Revenue - Other: $4,409,000 ($37.17)
Sale of Property: $3,466,000 ($29.22)
Rents: $1,885,000 ($15.89)
Fines and Forfeits: $791,000 ($6.67)
Interest Earnings: $252,000 ($2.12)
- State Intergovernmental - General Local Government Support: $3,246,000 ($27.37)
Other: $1,356,000 ($11.43)
- Tax - Property: $76,882,000 ($648.20)
Occupation and Business License - Other: $38,328,000 ($323.15)
General Sales and Gross Receipts: $14,692,000 ($123.87)
Other Selective Sales: $11,800,000 ($99.49)
Public Utilities Sales: $7,819,000 ($65.92)
Alcoholic Beverage Sales: $150,000 ($1.26)
North Charleston government finances - Debt in 2021 (per resident):
- Long Term Debt - Outstanding Unspecified Public Purpose: $247,280,000 ($2084.85)
Beginning Outstanding - Unspecified Public Purpose: $214,810,000 ($1811.09)
Issue, Unspecified Public Purpose: $93,665,000 ($789.70)
Retired Unspecified Public Purpose: $61,195,000 ($515.94)
Beginning Outstanding - Public Debt for Private Purpose: $3,185,000 ($26.85)
Outstanding Nonguaranteed - Industrial Revenue: $2,495,000 ($21.04)
Retired Nonguaranteed - Public Debt for Private Purpose: $690,000 ($5.82)
North Charleston government finances - Cash and Securities in 2021 (per resident):
- Bond Funds - Cash and Securities: $97,615,000 ($823.01)
- Other Funds - Cash and Securities: $76,031,000 ($641.03)
- Sinking Funds - Cash and Securities: $17,405,000 ($146.74)
10.38% of this county's 2021 resident taxpayers lived in other counties in 2020 ($106,855 average adjusted gross income)
| Here: | 10.38% |
| South Carolina average: | 8.89% |
0.04% of residents moved from foreign countries ($264 average AGI)
Charleston County: 0.04% South Carolina average: 0.04%
Top counties from which taxpayers relocated into this county between 2020 and 2021:
| from Berkeley County, SC | |
| from Dorchester County, SC | |
| from Mecklenburg County, NC |
9.80% of this county's 2020 resident taxpayers moved to other counties in 2021 ($68,552 average adjusted gross income)
| Here: | 9.80% |
| South Carolina average: | 7.46% |
0.05% of residents moved to foreign countries ($339 average AGI)
Charleston County: 0.05% South Carolina average: 0.03%
Top counties to which taxpayers relocated from this county between 2020 and 2021:
| to Berkeley County, SC | |
| to Dorchester County, SC | |
| to Greenville County, SC |
| Businesses in North Charleston, SC | ||||
| Name | Count | Name | Count | |
|---|---|---|---|---|
| AT&T | 2 | Marriott | 5 | |
| American Eagle Outfitters | 1 | Marshalls | 1 | |
| Ann Taylor | 1 | MasterBrand Cabinets | 2 | |
| Applebee's | 1 | McDonald's | 6 | |
| Arby's | 4 | Motel 6 | 1 | |
| Banana Republic | 1 | New York & Co | 1 | |
| Bath & Body Works | 2 | Nike | 5 | |
| Bed Bath & Beyond | 1 | Nissan | 1 | |
| Best Western | 1 | Office Depot | 1 | |
| Blockbuster | 2 | Old Navy | 1 | |
| Buffalo Wild Wings | 1 | Olive Garden | 1 | |
| CVS | 3 | Pac Sun | 1 | |
| Catherines | 1 | Papa John's Pizza | 1 | |
| Charlotte Russe | 1 | Penske | 1 | |
| Chevrolet | 1 | Pier 1 Imports | 1 | |
| Chick-Fil-A | 4 | Pizza Hut | 1 | |
| Chico's | 1 | Publix Super Markets | 1 | |
| Chuck E. Cheese's | 1 | Qdoba Mexican Grill | 1 | |
| Clarion | 1 | Quality | 2 | |
| Cold Stone Creamery | 1 | Quiznos | 2 | |
| Comfort Suites | 1 | Red Lobster | 1 | |
| Cracker Barrel | 1 | Red Roof Inn | 1 | |
| Cricket Wireless | 6 | Rodeway Inn | 1 | |
| Dairy Queen | 1 | Rooms To Go | 1 | |
| Decora Cabinetry | 1 | Ruby Tuesday | 1 | |
| Dennys | 1 | SONIC Drive-In | 2 | |
| Dunkin Donuts | 5 | Sam's Club | 1 | |
| Eddie Bauer | 1 | Sheraton | 1 | |
| Express | 1 | Shoe Carnival | 1 | |
| Extended Stay America | 1 | Skechers USA | 1 | |
| FedEx | 16 | Sleep Inn | 2 | |
| Firestone Complete Auto Care | 1 | Spencer Gifts | 1 | |
| Ford | 1 | Sprint Nextel | 4 | |
| GNC | 1 | Starbucks | 2 | |
| GameStop | 3 | Studio Plus Deluxe Studios | 1 | |
| Gap | 1 | Subaru | 1 | |
| Gymboree | 1 | Suburban | 1 | |
| H&R Block | 4 | Subway | 11 | |
| Hardee's | 4 | T-Mobile | 3 | |
| Hilton | 5 | Taco Bell | 4 | |
| Holiday Inn | 6 | Talbots | 1 | |
| Hollister Co. | 1 | Target | 1 | |
| Homestead Studio Suites | 1 | The Room Place | 1 | |
| Honda | 1 | Tire Kingdom | 2 | |
| Hyundai | 1 | Toyota | 1 | |
| IZOD | 1 | Toys"R"Us | 2 | |
| InTown Suites | 2 | U-Haul | 3 | |
| J.Crew | 1 | UPS | 23 | |
| Jimmy Jazz | 1 | Vans | 2 | |
| Johnny Rockets | 1 | Verizon Wireless | 2 | |
| Jones New York | 3 | Victoria's Secret | 1 | |
| Journeys | 2 | Volkswagen | 1 | |
| Kincaid | 1 | Waffle House | 4 | |
| Kmart | 1 | Walgreens | 2 | |
| Levi Strauss & Co. | 1 | Walmart | 2 | |
| Little Caesars Pizza | 3 | Wingate | 1 | |
| Lowe's | 1 | |||
Strongest AM radio stations in North Charleston:
- WIQB (1050 AM; 25 kW; CONWAY, SC; Owner: CUMULUS LICENSING CORP.)
- WXTC (1390 AM; 5 kW; CHARLESTON, SC)
- WTMA (1250 AM; 5 kW; CHARLESTON, SC; Owner: CITADEL BROADCASTING COMPANY)
- WSCC (730 AM; 5 kW; CHARLESTON, SC; Owner: CITICASTERS LICENSES, L.P.)
- WTMZ (910 AM; 0 kW; DORCHESTER TERR.-BRE, SC; Owner: CITADEL BROADCASTING COMPANY)
- WQSC (1340 AM; 1 kW; CHARLESTON, SC; Owner: KIRKMAN BROADCASTING, INC,)
- WQTK (950 AM; 10 kW; MONCKS CORNER, SC; Owner: KIRKMAN BROADCASTING, INC.)
- WQNT (1450 AM; 1 kW; CHARLESTON, SC; Owner: KIRKMAN BROADCASTING, INC.)
- WCEO (840 AM; daytime; 50 kW; COLUMBIA, SC; Owner: EASTERN BROADCASTING GROUP, INC.)
- WBAJ (890 AM; daytime; 50 kW; BLYTHEWOOD, SC; Owner: FAMILY FIRST)
- WAZS (980 AM; 1 kW; SUMMERVILLE, SC; Owner: THOMAS B. DANIELS)
- WZJY (1480 AM; 1 kW; MOUNT PLEASANT, SC; Owner: LEVAS COMMUNICATIONS, LLC)
- WQIZ (810 AM; daytime; 5 kW; ST. GEORGE, SC; Owner: RADIO PROPERTIES, LLC)
Strongest FM radio stations in North Charleston:
- WWWZ (93.3 FM; SUMMERVILLE, SC; Owner: CITADEL BROADCASTING COMPANY)
- WALC (100.5 FM; CHARLESTON, SC; Owner: CITICASTERS LICENSES, L.P.)
- WEZL (103.5 FM; CHARLESTON, SC; Owner: CITICASTERS LICENSES, L.P.)
- WSSX-FM (95.1 FM; CHARLESTON, SC; Owner: CITADEL BROADCASTING COMPANY)
- WXLY (102.5 FM; NORTH CHARLESTON, SC; Owner: CITICASTERS LICENSES, L.P.)
- WSUY (96.9 FM; CHARLESTON, SC; Owner: CITADEL BROADCASTING COMPANY)
- WJNI (106.3 FM; LADSON, SC; Owner: THOMAS B. DANIELS)
- WAVF (96.1 FM; HANAHAN, SC; Owner: APEX BROADCASTING, INC.)
- WSCI (89.3 FM; CHARLESTON, SC; Owner: SOUTH CAROLINA EDUCATIONAL TV COMMISSION)
- WSSP (94.3 FM; GOOSE CREEK, SC; Owner: CLEAR CHANNEL BROADCASTING LICENSES, INC.)
- WRFQ (104.5 FM; MOUNT PLEASANT, SC; Owner: CITICASTERS LICENSES, L.P.)
- W205BJ (88.9 FM; CHARLESTON, SC; Owner: CALVARY CHAPEL OF TWIN FALLS, INC.)
- WMGL (101.7 FM; RAVENEL, SC; Owner: CITADEL BROADCASTING COMPANY)
- WKCL (91.5 FM; LADSON, SC; Owner: CHAPEL HOLY SPIRIT CHURCH & BIBLE CO)
- WYFH (90.7 FM; NORTH CHARLESTON, SC; Owner: BIBLE BROADCASTING NETWORK, INC.)
- WNKT (107.5 FM; ST. GEORGE, SC; Owner: CITADEL BROADCASTING COMPANY)
- W220CN (91.9 FM; CHARLESTON, SC; Owner: RADIO TRAINING NETWORK, INC.)
- WYBB (98.1 FM; FOLLY BEACH, SC; Owner: L.M. COMMUNICATIONS OF SOUTH CAROLINA, INC.)
- WCOO (105.5 FM; KIAWAH ISLAND, SC; Owner: L.M. COMMUNICATIONS II OF SOUTH CAROLINA, INC.)
- WFCH (88.5 FM; CHARLESTON, SC; Owner: FAMILY STATIONS, INC.)
TV broadcast stations around North Charleston:
- WCBD-TV (Channel 2; CHARLESTON, SC; Owner: MEDIA GENERAL COMMUNICATIONS, INC.)
- WCSC-TV (Channel 5; CHARLESTON, SC; Owner: WCSC, INC.)
- WITV (Channel 7; CHARLESTON, SC; Owner: SOUTH CAROLINA EDUCATIONAL TV COMMISSION)
- WCIV (Channel 4; CHARLESTON, SC; Owner: WCIV, LLC)
- WMMP (Channel 36; CHARLESTON, SC; Owner: WMMP LICENSEE L.P.)
- WTAT-TV (Channel 24; CHARLESTON, SC; Owner: WTAT LICENSEE, LLC)
- WJEA-LP (Channel 12; CHARLESTON, SC; Owner: CHARLES S. NAMEY)
- WJNI-LP (Channel 57; NORTH CHARLESTON, SC; Owner: THOMAS B. DANIELS)
- WTBD-LP (Channel 22; NORTH CHARLESTON, SC; Owner: THOMAS B. DANIELS)
- W21BX (Channel 21; CHARLESTON, SC; Owner: TRINITY BROADCASTING NETWORK)
- WJRB-LP (Channel 18; CHARLESTON, SC; Owner: RAUL INFANTE, JR.)
- WCHD-LP (Channel 49; CHARLESTON, SC; Owner: IZZO LIVING TRUST)
- W26CF (Channel 26; SUMMERVILLE, SC; Owner: DOVE BROADCASTING, INC.)
- WJWJ-TV (Channel 16; BEAUFORT, SC; Owner: SOUTH CAROLINA EDUCATIONAL TV COMMISSION)
- National Bridge Inventory (NBI) Statistics
- 155Number of bridges
- 6,736ft / 2,053mTotal length
- $236,455,000Total costs
- 3,730,024Total average daily traffic
- 300,824Total average daily truck traffic
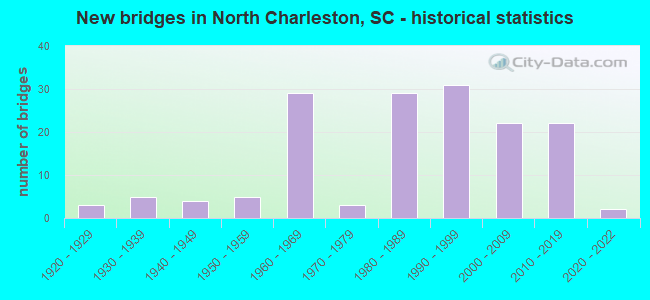
- New bridges - historical statistics
- 31920-1929
- 51930-1939
- 41940-1949
- 51950-1959
- 291960-1969
- 31970-1979
- 291980-1989
- 311990-1999
- 222000-2009
- 222010-2019
- 22020-2022
FCC Registered Antenna Towers: 448 (See the full list of FCC Registered Antenna Towers)
FCC Registered Commercial Land Mobile Towers: 1 (See the full list of FCC Registered Commercial Land Mobile Towers in North Charleston, SC)
FCC Registered Private Land Mobile Towers: 7 (See the full list of FCC Registered Private Land Mobile Towers)
FCC Registered Broadcast Land Mobile Towers: 108 (See the full list of FCC Registered Broadcast Land Mobile Towers)
FCC Registered Microwave Towers: 44 (See the full list of FCC Registered Microwave Towers in this town)
FCC Registered Paging Towers: 6 (See the full list of FCC Registered Paging Towers)
FCC Registered Maritime Coast & Aviation Ground Towers: 13 (See the full list of FCC Registered Maritime Coast & Aviation Ground Towers)
FCC Registered Amateur Radio Licenses: 251 (See the full list of FCC Registered Amateur Radio Licenses in North Charleston)
FAA Registered Aircraft Manufacturers and Dealers: 3 (See the full list of FAA Registered Manufacturers and Dealers in North Charleston)
FAA Registered Aircraft: 43 (See the full list of FAA Registered Aircraft)
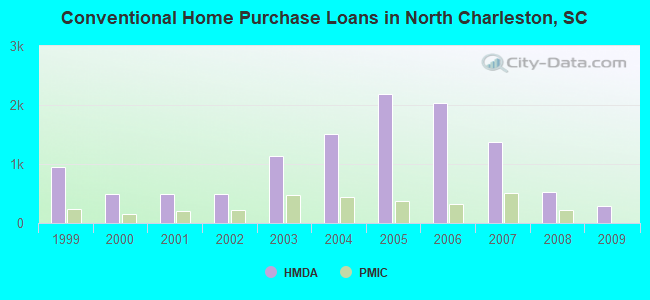
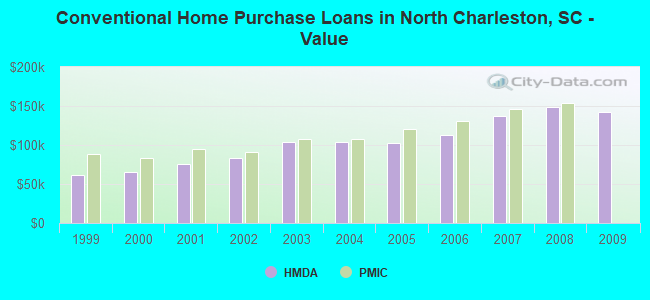
| Home Mortgage Disclosure Act Aggregated Statistics For Year 2009 (Based on 18 full and 8 partial tracts) | ||||||||||||||
| A) FHA, FSA/RHS & VA Home Purchase Loans | B) Conventional Home Purchase Loans | C) Refinancings | D) Home Improvement Loans | E) Loans on Dwellings For 5+ Families | F) Non-occupant Loans on < 5 Family Dwellings (A B C & D) | G) Loans On Manufactured Home Dwelling (A B C & D) | ||||||||
|---|---|---|---|---|---|---|---|---|---|---|---|---|---|---|
| Number | Average Value | Number | Average Value | Number | Average Value | Number | Average Value | Number | Average Value | Number | Average Value | Number | Average Value | |
| LOANS ORIGINATED | 629 | $156,607 | 281 | $142,073 | 1,078 | $155,701 | 68 | $48,048 | 3 | $334,720 | 139 | $121,624 | 17 | $70,523 |
| APPLICATIONS APPROVED, NOT ACCEPTED | 23 | $156,226 | 17 | $127,743 | 134 | $141,360 | 2 | $96,455 | 0 | $0 | 21 | $111,769 | 2 | $32,055 |
| APPLICATIONS DENIED | 157 | $147,602 | 67 | $127,007 | 668 | $146,681 | 56 | $53,047 | 1 | $108,000 | 87 | $106,794 | 13 | $50,996 |
| APPLICATIONS WITHDRAWN | 87 | $157,199 | 40 | $165,154 | 367 | $150,770 | 13 | $88,569 | 0 | $0 | 35 | $106,302 | 0 | $0 |
| FILES CLOSED FOR INCOMPLETENESS | 18 | $140,846 | 15 | $118,849 | 86 | $160,567 | 5 | $103,642 | 0 | $0 | 12 | $108,862 | 2 | $104,580 |
Detailed mortgage data for all 26 tracts in North Charleston, SC
| Private Mortgage Insurance Companies Aggregated Statistics For Year 2008 (Based on 17 full and 7 partial tracts) | ||||||
| A) Conventional Home Purchase Loans | B) Refinancings | C) Non-occupant Loans on < 5 Family Dwellings (A & B) | ||||
|---|---|---|---|---|---|---|
| Number | Average Value | Number | Average Value | Number | Average Value | |
| LOANS ORIGINATED | 217 | $154,004 | 89 | $149,913 | 48 | $111,711 |
| APPLICATIONS APPROVED, NOT ACCEPTED | 85 | $147,082 | 53 | $157,922 | 16 | $105,537 |
| APPLICATIONS DENIED | 37 | $119,274 | 17 | $135,386 | 24 | $113,496 |
| APPLICATIONS WITHDRAWN | 13 | $149,511 | 10 | $146,221 | 6 | $118,893 |
| FILES CLOSED FOR INCOMPLETENESS | 6 | $152,973 | 4 | $137,258 | 2 | $181,805 |
2002 - 2018 National Fire Incident Reporting System (NFIRS) incidents
- Fire incident types reported to NFIRS in North Charleston, SC
- 4,66140.1%Structure Fires
- 4,23036.4%Outside Fires
- 2,43620.9%Mobile Property/Vehicle Fires
- 3092.7%Other
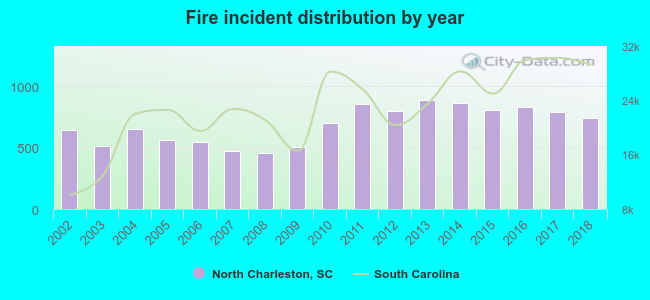 According to the data from the years 2002 - 2018 the average number of fires per year is 684. The highest number of fires - 886 took place in 2013, and the least - 460 in 2008. The data has a rising trend.
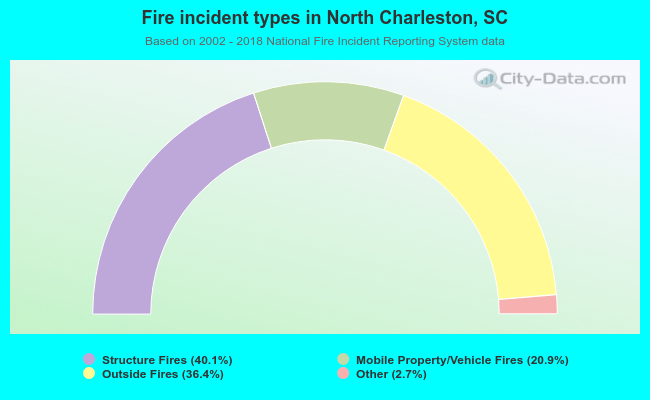 When looking into fire subcategories, the most incidents belonged to: Structure Fires (40.1%), and Outside Fires (36.4%).
Fire-safe hotels and motels in North Charleston, South Carolina:
- Wingate by Wyndham Charleston Airport Coliseum, 4701 Saul White Blvd, North Charleston, South Carolina 29418 , Phone: (843) 554-7154, Fax: (843) 566-9299
- The North Charleston Inn, 2934 W Montague Ave, North Charleston, South Carolina 29418 , Phone: (843) 744-8281, Fax: (843) 744-6230
- Hawthorn Inn and Suites by Wyndham, 7645 Northwoods Blvd, North Charleston, South Carolina 29405 , Phone: (843) 572-5757, Fax: (843) 797-8529
- Siesta Motor Lodge, 4044 Rivers Ave, North Charleston, South Carolina 29405 , Phone: (843) 747-3659
- Quality Inn Coliseum, 5055 N Arco Ln, North Charleston, South Carolina 29418 , Phone: (843) 554-6485, Fax: (843) 566-9466
- North Charleston Marriott, 4770 Goer Dr, North Charleston, South Carolina 29406 , Phone: (800) 228-9290, Fax: (843) 744-6108
- Extended Stay America - Charleston - North Charleston, 5059 N Arco Ln, North Charleston, South Carolina 29418 , Phone: (843) 747-3787, Fax: (843) 747-3990
- Howard Johnson Express Inn, 2512 Ashley Phosphate Rd, North Charleston, South Carolina 29418 , Phone: (843) 797-6864, Fax: (843) 572-5153
- 34 other hotels and motels
| Most common first names in North Charleston, SC among deceased individuals | ||
| Name | Count | Lived (average) |
|---|---|---|
| James | 357 | 69.4 years |
| John | 293 | 70.2 years |
| Mary | 283 | 74.5 years |
| William | 271 | 70.6 years |
| Robert | 184 | 66.6 years |
| George | 161 | 69.3 years |
| Joseph | 161 | 69.4 years |
| Charles | 137 | 66.5 years |
| Henry | 116 | 70.8 years |
| Willie | 108 | 70.0 years |
| Most common last names in North Charleston, SC among deceased individuals | ||
| Last name | Count | Lived (average) |
|---|---|---|
| Brown | 230 | 67.3 years |
| Johnson | 146 | 69.6 years |
| Smith | 144 | 69.7 years |
| Williams | 141 | 68.7 years |
| Jones | 112 | 69.7 years |
| Green | 96 | 69.5 years |
| White | 87 | 68.8 years |
| Simmons | 83 | 69.7 years |
| Davis | 77 | 68.5 years |
| Wilson | 75 | 71.1 years |
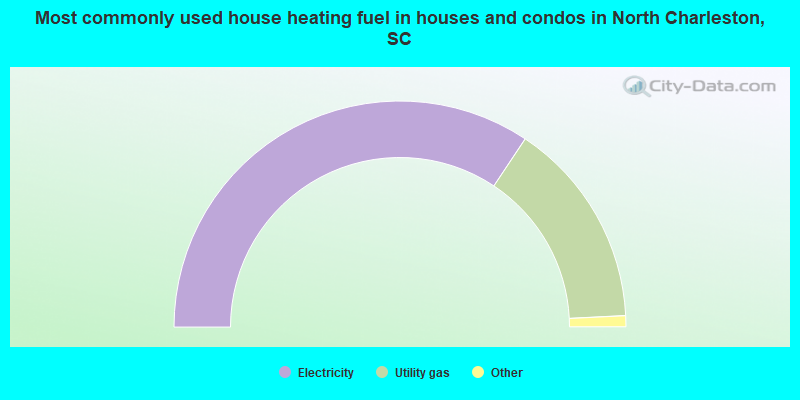
- 68.7%Electricity
- 29.7%Utility gas
- 0.5%Bottled, tank, or LP gas
- 0.5%Solar energy
- 0.4%No fuel used
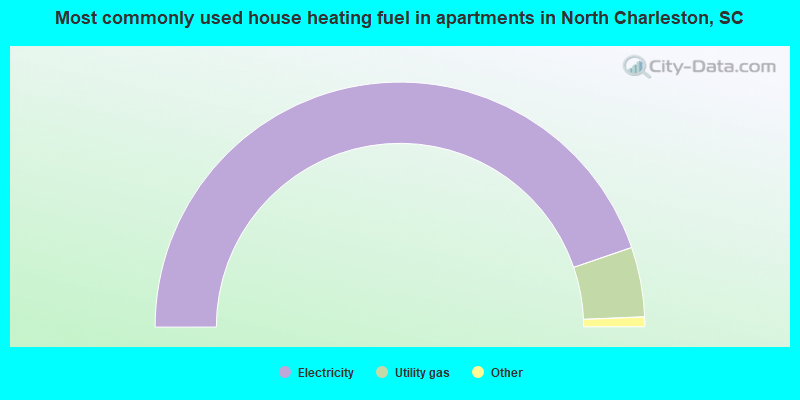
- 89.5%Electricity
- 9.2%Utility gas
- 0.6%Bottled, tank, or LP gas
- 0.5%No fuel used
- 0.2%Fuel oil, kerosene, etc.
North Charleston compared to South Carolina state average:
- Unemployed percentage significantly below state average.
- Black race population percentage above state average.
- Hispanic race population percentage above state average.
- Median age below state average.
- Foreign-born population percentage significantly above state average.
- Renting percentage above state average.
- Length of stay since moving in significantly below state average.
North Charleston on our top lists:
- #9 on the list of "Top 101 cities with the lowest percentage of workers working at home, population 50,000+"
- #11 on the list of "Top 101 cities with largest percentage of females in industries: accommodation and food services (population 50,000+)"
- #22 on the list of "Top 101 cities with the largest city-data.com crime index decrease from 2002 to 2012 (population 50,000+)"
- #23 on the list of "Top 101 cities with largest percentage of males in occupations: construction and extraction occupations (population 50,000+)"
- #24 on the list of "Top 101 cities with largest percentage of males in industries: administrative and support and waste management services (population 50,000+)"
- #28 on the list of "Top 101 cities with the highest number of thefts per 100,000 residents, excludes tourist destinations and others with a lot of outsiders visiting based on city industries data (population 50,000+)"
- #30 on the list of "Top 101 cities with the largest percentage of people in crews of maritime vessels (population 1,000+)"
- #31 on the list of "Top 101 cities with largest percentage of females in occupations: health technologists and technicians (population 50,000+)"
- #34 on the list of "Top 101 cities with the highest number of police officers per 1000 residents (population 50,000+)"
- #37 on the list of "Top 101 cities with largest percentage of females in occupations: installation, maintenance, and repair occupations (population 50,000+)"
- #39 on the list of "Top 101 cities with largest percentage of females in occupations: building and grounds cleaning and maintenance occupations (population 50,000+)"
- #40 on the list of "Top 101 cities with largest percentage of females in industries: administrative and support and waste management services (population 50,000+)"
- #47 on the list of "Top 101 cities with the largest percentage of people in military ships (population 1,000+)"
- #47 on the list of "Top 101 cities with the largest house values disparities (population 50,000+)"
- #53 on the list of "Top 100 cities with strongest arts, entertainment, recreation, accommodation and food services industries (pop. 50,000+)"
- #54 on the list of "Top 101 cities that people commute into (largest positive percentage daily daytime population change due to commuting) (population 50,000+)"
- #56 on the list of "Top 101 larger cities with the highest increase in house/condo value from 2000 (population 50,000+)"
- #63 on the list of "Top 101 cities with the least people having professional degrees (population 50,000+)"
- #65 on the list of "Top 101 cities with the highest number of murders per 100,000 residents, excludes tourist destinations and others with a lot of outsiders visiting based on city industries data (population 50,000+)"
- #68 on the list of "Top 101 cities with the lowest cost per building permit (population 50,000+)"
- #25 (29404) on the list of "Top 101 zip codes with the smallest percentage of taxpayers using charity contributions deductions in 2012 (pop 1,000+)"
- #36 (29404) on the list of "Top 101 zip codes with the lowest 2012 average taxable interest for individuals (pop 1,000+)"
- #39 (29404) on the list of "Top 101 zip codes with the smallest percentage of taxpayers using paid preparers for 2012 taxes (pop 1,000+)"
- #46 (29404) on the list of "Top 101 zip codes with the largest percentage of returns reporting salary or wage in 2012 (pop 1,000+)"
- #62 (29404) on the list of "Top 101 zip codes with the largest percentage of Greek first ancestries"
- #14 on the list of "Top 101 counties with the most Black Protestant congregations"
- #21 on the list of "Top 101 counties with the largest decrease in the number of infant deaths per 1000 residents 2000-2006 to 2007-2013 (pop. 50,000+)"
- #22 on the list of "Top 101 counties with the most Black Protestant adherents"
- #24 on the list of "Top 101 counties with the lowest surface withdrawal of fresh water for public supply (pop. 50,000+)"
- #43 on the list of "Top 101 counties with the lowest Nitrogen Dioxide air pollution readings in 2012 (ppm)"

|
|
Total of 98 patent applications in 2008-2024.