Goose Creek, South Carolina Submit your own pictures of this city and show them to the world
OSM Map
General Map
Google Map
MSN Map
OSM Map
General Map
Google Map
MSN Map
OSM Map
General Map
Google Map
MSN Map
OSM Map
General Map
Google Map
MSN Map
Please wait while loading the map...
Population in 2022: 47,618 (97% urban, 3% rural). Population change since 2000: +63.0%Males: 24,508 Females: 23,110
March 2022 cost of living index in Goose Creek: 92.7 (less than average, U.S. average is 100) Percentage of residents living in poverty in 2022: 7.3%for White Non-Hispanic residents , 11.0% for Black residents , 12.3% for Hispanic or Latino residents , 100.0% for Native Hawaiian and other Pacific Islander residents , 13.7% for other race residents , 2.1% for two or more races residents )
Profiles of local businesses
Business Search - 14 Million verified businesses
Data:
Median household income ($)
Median household income (% change since 2000)
Household income diversity
Ratio of average income to average house value (%)
Ratio of average income to average rent
Median household income ($) - White
Median household income ($) - Black or African American
Median household income ($) - Asian
Median household income ($) - Hispanic or Latino
Median household income ($) - American Indian and Alaska Native
Median household income ($) - Multirace
Median household income ($) - Other Race
Median household income for houses/condos with a mortgage ($)
Median household income for apartments without a mortgage ($)
Races - White alone (%)
Races - White alone (% change since 2000)
Races - Black alone (%)
Races - Black alone (% change since 2000)
Races - American Indian alone (%)
Races - American Indian alone (% change since 2000)
Races - Asian alone (%)
Races - Asian alone (% change since 2000)
Races - Hispanic (%)
Races - Hispanic (% change since 2000)
Races - Native Hawaiian and Other Pacific Islander alone (%)
Races - Native Hawaiian and Other Pacific Islander alone (% change since 2000)
Races - Two or more races (%)
Races - Two or more races (% change since 2000)
Races - Other race alone (%)
Races - Other race alone (% change since 2000)
Racial diversity
Unemployment (%)
Unemployment (% change since 2000)
Unemployment (%) - White
Unemployment (%) - Black or African American
Unemployment (%) - Asian
Unemployment (%) - Hispanic or Latino
Unemployment (%) - American Indian and Alaska Native
Unemployment (%) - Multirace
Unemployment (%) - Other Race
Population density (people per square mile)
Population - Males (%)
Population - Females (%)
Population - Males (%) - White
Population - Males (%) - Black or African American
Population - Males (%) - Asian
Population - Males (%) - Hispanic or Latino
Population - Males (%) - American Indian and Alaska Native
Population - Males (%) - Multirace
Population - Males (%) - Other Race
Population - Females (%) - White
Population - Females (%) - Black or African American
Population - Females (%) - Asian
Population - Females (%) - Hispanic or Latino
Population - Females (%) - American Indian and Alaska Native
Population - Females (%) - Multirace
Population - Females (%) - Other Race
Coronavirus confirmed cases (Apr 27, 2024)
Deaths caused by coronavirus (Apr 27, 2024)
Coronavirus confirmed cases (per 100k population) (Apr 27, 2024)
Deaths caused by coronavirus (per 100k population) (Apr 27, 2024)
Daily increase in number of cases (Apr 27, 2024)
Weekly increase in number of cases (Apr 27, 2024)
Cases doubled (in days) (Apr 27, 2024)
Hospitalized patients (Apr 18, 2022)
Negative test results (Apr 18, 2022)
Total test results (Apr 18, 2022)
COVID Vaccine doses distributed (per 100k population) (Sep 19, 2023)
COVID Vaccine doses administered (per 100k population) (Sep 19, 2023)
COVID Vaccine doses distributed (Sep 19, 2023)
COVID Vaccine doses administered (Sep 19, 2023)
Likely homosexual households (%)
Likely homosexual households (% change since 2000)
Likely homosexual households - Lesbian couples (%)
Likely homosexual households - Lesbian couples (% change since 2000)
Likely homosexual households - Gay men (%)
Likely homosexual households - Gay men (% change since 2000)
Cost of living index
Median gross rent ($)
Median contract rent ($)
Median monthly housing costs ($)
Median house or condo value ($)
Median house or condo value ($ change since 2000)
Mean house or condo value by units in structure - 1, detached ($)
Mean house or condo value by units in structure - 1, attached ($)
Mean house or condo value by units in structure - 2 ($)
Mean house or condo value by units in structure by units in structure - 3 or 4 ($)
Mean house or condo value by units in structure - 5 or more ($)
Mean house or condo value by units in structure - Boat, RV, van, etc. ($)
Mean house or condo value by units in structure - Mobile home ($)
Median house or condo value ($) - White
Median house or condo value ($) - Black or African American
Median house or condo value ($) - Asian
Median house or condo value ($) - Hispanic or Latino
Median house or condo value ($) - American Indian and Alaska Native
Median house or condo value ($) - Multirace
Median house or condo value ($) - Other Race
Median resident age
Resident age diversity
Median resident age - Males
Median resident age - Females
Median resident age - White
Median resident age - Black or African American
Median resident age - Asian
Median resident age - Hispanic or Latino
Median resident age - American Indian and Alaska Native
Median resident age - Multirace
Median resident age - Other Race
Median resident age - Males - White
Median resident age - Males - Black or African American
Median resident age - Males - Asian
Median resident age - Males - Hispanic or Latino
Median resident age - Males - American Indian and Alaska Native
Median resident age - Males - Multirace
Median resident age - Males - Other Race
Median resident age - Females - White
Median resident age - Females - Black or African American
Median resident age - Females - Asian
Median resident age - Females - Hispanic or Latino
Median resident age - Females - American Indian and Alaska Native
Median resident age - Females - Multirace
Median resident age - Females - Other Race
Commute - mean travel time to work (minutes)
Travel time to work - Less than 5 minutes (%)
Travel time to work - Less than 5 minutes (% change since 2000)
Travel time to work - 5 to 9 minutes (%)
Travel time to work - 5 to 9 minutes (% change since 2000)
Travel time to work - 10 to 19 minutes (%)
Travel time to work - 10 to 19 minutes (% change since 2000)
Travel time to work - 20 to 29 minutes (%)
Travel time to work - 20 to 29 minutes (% change since 2000)
Travel time to work - 30 to 39 minutes (%)
Travel time to work - 30 to 39 minutes (% change since 2000)
Travel time to work - 40 to 59 minutes (%)
Travel time to work - 40 to 59 minutes (% change since 2000)
Travel time to work - 60 to 89 minutes (%)
Travel time to work - 60 to 89 minutes (% change since 2000)
Travel time to work - 90 or more minutes (%)
Travel time to work - 90 or more minutes (% change since 2000)
Marital status - Never married (%)
Marital status - Now married (%)
Marital status - Separated (%)
Marital status - Widowed (%)
Marital status - Divorced (%)
Median family income ($)
Median family income (% change since 2000)
Median non-family income ($)
Median non-family income (% change since 2000)
Median per capita income ($)
Median per capita income (% change since 2000)
Median family income ($) - White
Median family income ($) - Black or African American
Median family income ($) - Asian
Median family income ($) - Hispanic or Latino
Median family income ($) - American Indian and Alaska Native
Median family income ($) - Multirace
Median family income ($) - Other Race
Median year house/condo built
Median year apartment built
Year house built - Built 2005 or later (%)
Year house built - Built 2000 to 2004 (%)
Year house built - Built 1990 to 1999 (%)
Year house built - Built 1980 to 1989 (%)
Year house built - Built 1970 to 1979 (%)
Year house built - Built 1960 to 1969 (%)
Year house built - Built 1950 to 1959 (%)
Year house built - Built 1940 to 1949 (%)
Year house built - Built 1939 or earlier (%)
Average household size
Household density (households per square mile)
Average household size - White
Average household size - Black or African American
Average household size - Asian
Average household size - Hispanic or Latino
Average household size - American Indian and Alaska Native
Average household size - Multirace
Average household size - Other Race
Occupied housing units (%)
Vacant housing units (%)
Owner occupied housing units (%)
Renter occupied housing units (%)
Vacancy status - For rent (%)
Vacancy status - For sale only (%)
Vacancy status - Rented or sold, not occupied (%)
Vacancy status - For seasonal, recreational, or occasional use (%)
Vacancy status - For migrant workers (%)
Vacancy status - Other vacant (%)
Residents with income below the poverty level (%)
Residents with income below 50% of the poverty level (%)
Children below poverty level (%)
Poor families by family type - Married-couple family (%)
Poor families by family type - Male, no wife present (%)
Poor families by family type - Female, no husband present (%)
Poverty status for native-born residents (%)
Poverty status for foreign-born residents (%)
Poverty among high school graduates not in families (%)
Poverty among people who did not graduate high school not in families (%)
Residents with income below the poverty level (%) - White
Residents with income below the poverty level (%) - Black or African American
Residents with income below the poverty level (%) - Asian
Residents with income below the poverty level (%) - Hispanic or Latino
Residents with income below the poverty level (%) - American Indian and Alaska Native
Residents with income below the poverty level (%) - Multirace
Residents with income below the poverty level (%) - Other Race
Air pollution - Air Quality Index (AQI)
Air pollution - CO
Air pollution - NO2
Air pollution - SO2
Air pollution - Ozone
Air pollution - PM10
Air pollution - PM25
Air pollution - Pb
Crime - Murders per 100,000 population
Crime - Rapes per 100,000 population
Crime - Robberies per 100,000 population
Crime - Assaults per 100,000 population
Crime - Burglaries per 100,000 population
Crime - Thefts per 100,000 population
Crime - Auto thefts per 100,000 population
Crime - Arson per 100,000 population
Crime - City-data.com crime index
Crime - Violent crime index
Crime - Property crime index
Crime - Murders per 100,000 population (5 year average)
Crime - Rapes per 100,000 population (5 year average)
Crime - Robberies per 100,000 population (5 year average)
Crime - Assaults per 100,000 population (5 year average)
Crime - Burglaries per 100,000 population (5 year average)
Crime - Thefts per 100,000 population (5 year average)
Crime - Auto thefts per 100,000 population (5 year average)
Crime - Arson per 100,000 population (5 year average)
Crime - City-data.com crime index (5 year average)
Crime - Violent crime index (5 year average)
Crime - Property crime index (5 year average)
1996 Presidential Elections Results (%) - Democratic Party (Clinton)
1996 Presidential Elections Results (%) - Republican Party (Dole)
1996 Presidential Elections Results (%) - Other
2000 Presidential Elections Results (%) - Democratic Party (Gore)
2000 Presidential Elections Results (%) - Republican Party (Bush)
2000 Presidential Elections Results (%) - Other
2004 Presidential Elections Results (%) - Democratic Party (Kerry)
2004 Presidential Elections Results (%) - Republican Party (Bush)
2004 Presidential Elections Results (%) - Other
2008 Presidential Elections Results (%) - Democratic Party (Obama)
2008 Presidential Elections Results (%) - Republican Party (McCain)
2008 Presidential Elections Results (%) - Other
2012 Presidential Elections Results (%) - Democratic Party (Obama)
2012 Presidential Elections Results (%) - Republican Party (Romney)
2012 Presidential Elections Results (%) - Other
2016 Presidential Elections Results (%) - Democratic Party (Clinton)
2016 Presidential Elections Results (%) - Republican Party (Trump)
2016 Presidential Elections Results (%) - Other
2020 Presidential Elections Results (%) - Democratic Party (Biden)
2020 Presidential Elections Results (%) - Republican Party (Trump)
2020 Presidential Elections Results (%) - Other
Ancestries Reported - Arab (%)
Ancestries Reported - Czech (%)
Ancestries Reported - Danish (%)
Ancestries Reported - Dutch (%)
Ancestries Reported - English (%)
Ancestries Reported - French (%)
Ancestries Reported - French Canadian (%)
Ancestries Reported - German (%)
Ancestries Reported - Greek (%)
Ancestries Reported - Hungarian (%)
Ancestries Reported - Irish (%)
Ancestries Reported - Italian (%)
Ancestries Reported - Lithuanian (%)
Ancestries Reported - Norwegian (%)
Ancestries Reported - Polish (%)
Ancestries Reported - Portuguese (%)
Ancestries Reported - Russian (%)
Ancestries Reported - Scotch-Irish (%)
Ancestries Reported - Scottish (%)
Ancestries Reported - Slovak (%)
Ancestries Reported - Subsaharan African (%)
Ancestries Reported - Swedish (%)
Ancestries Reported - Swiss (%)
Ancestries Reported - Ukrainian (%)
Ancestries Reported - United States (%)
Ancestries Reported - Welsh (%)
Ancestries Reported - West Indian (%)
Ancestries Reported - Other (%)
Educational Attainment - No schooling completed (%)
Educational Attainment - Less than high school (%)
Educational Attainment - High school or equivalent (%)
Educational Attainment - Less than 1 year of college (%)
Educational Attainment - 1 or more years of college (%)
Educational Attainment - Associate degree (%)
Educational Attainment - Bachelor's degree (%)
Educational Attainment - Master's degree (%)
Educational Attainment - Professional school degree (%)
Educational Attainment - Doctorate degree (%)
School Enrollment - Nursery, preschool (%)
School Enrollment - Kindergarten (%)
School Enrollment - Grade 1 to 4 (%)
School Enrollment - Grade 5 to 8 (%)
School Enrollment - Grade 9 to 12 (%)
School Enrollment - College undergrad (%)
School Enrollment - Graduate or professional (%)
School Enrollment - Not enrolled in school (%)
School enrollment - Public schools (%)
School enrollment - Private schools (%)
School enrollment - Not enrolled (%)
Median number of rooms in houses and condos
Median number of rooms in apartments
Housing units lacking complete plumbing facilities (%)
Housing units lacking complete kitchen facilities (%)
Density of houses
Urban houses (%)
Rural houses (%)
Households with people 60 years and over (%)
Households with people 65 years and over (%)
Households with people 75 years and over (%)
Households with one or more nonrelatives (%)
Households with no nonrelatives (%)
Population in households (%)
Family households (%)
Nonfamily households (%)
Population in families (%)
Family households with own children (%)
Median number of bedrooms in owner occupied houses
Mean number of bedrooms in owner occupied houses
Median number of bedrooms in renter occupied houses
Mean number of bedrooms in renter occupied houses
Median number of vehichles in owner occupied houses
Mean number of vehichles in owner occupied houses
Median number of vehichles in renter occupied houses
Mean number of vehichles in renter occupied houses
Mortgage status - with mortgage (%)
Mortgage status - with second mortgage (%)
Mortgage status - with home equity loan (%)
Mortgage status - with both second mortgage and home equity loan (%)
Mortgage status - without a mortgage (%)
Average family size
Average family size - White
Average family size - Black or African American
Average family size - Asian
Average family size - Hispanic or Latino
Average family size - American Indian and Alaska Native
Average family size - Multirace
Average family size - Other Race
Geographical mobility - Same house 1 year ago (%)
Geographical mobility - Moved within same county (%)
Geographical mobility - Moved from different county within same state (%)
Geographical mobility - Moved from different state (%)
Geographical mobility - Moved from abroad (%)
Place of birth - Born in state of residence (%)
Place of birth - Born in other state (%)
Place of birth - Native, outside of US (%)
Place of birth - Foreign born (%)
Housing units in structures - 1, detached (%)
Housing units in structures - 1, attached (%)
Housing units in structures - 2 (%)
Housing units in structures - 3 or 4 (%)
Housing units in structures - 5 to 9 (%)
Housing units in structures - 10 to 19 (%)
Housing units in structures - 20 to 49 (%)
Housing units in structures - 50 or more (%)
Housing units in structures - Mobile home (%)
Housing units in structures - Boat, RV, van, etc. (%)
House/condo owner moved in on average (years ago)
Renter moved in on average (years ago)
Year householder moved into unit - Moved in 1999 to March 2000 (%)
Year householder moved into unit - Moved in 1995 to 1998 (%)
Year householder moved into unit - Moved in 1990 to 1994 (%)
Year householder moved into unit - Moved in 1980 to 1989 (%)
Year householder moved into unit - Moved in 1970 to 1979 (%)
Year householder moved into unit - Moved in 1969 or earlier (%)
Means of transportation to work - Drove car alone (%)
Means of transportation to work - Carpooled (%)
Means of transportation to work - Public transportation (%)
Means of transportation to work - Bus or trolley bus (%)
Means of transportation to work - Streetcar or trolley car (%)
Means of transportation to work - Subway or elevated (%)
Means of transportation to work - Railroad (%)
Means of transportation to work - Ferryboat (%)
Means of transportation to work - Taxicab (%)
Means of transportation to work - Motorcycle (%)
Means of transportation to work - Bicycle (%)
Means of transportation to work - Walked (%)
Means of transportation to work - Other means (%)
Working at home (%)
Industry diversity
Most Common Industries - Agriculture, forestry, fishing and hunting, and mining (%)
Most Common Industries - Agriculture, forestry, fishing and hunting (%)
Most Common Industries - Mining, quarrying, and oil and gas extraction (%)
Most Common Industries - Construction (%)
Most Common Industries - Manufacturing (%)
Most Common Industries - Wholesale trade (%)
Most Common Industries - Retail trade (%)
Most Common Industries - Transportation and warehousing, and utilities (%)
Most Common Industries - Transportation and warehousing (%)
Most Common Industries - Utilities (%)
Most Common Industries - Information (%)
Most Common Industries - Finance and insurance, and real estate and rental and leasing (%)
Most Common Industries - Finance and insurance (%)
Most Common Industries - Real estate and rental and leasing (%)
Most Common Industries - Professional, scientific, and management, and administrative and waste management services (%)
Most Common Industries - Professional, scientific, and technical services (%)
Most Common Industries - Management of companies and enterprises (%)
Most Common Industries - Administrative and support and waste management services (%)
Most Common Industries - Educational services, and health care and social assistance (%)
Most Common Industries - Educational services (%)
Most Common Industries - Health care and social assistance (%)
Most Common Industries - Arts, entertainment, and recreation, and accommodation and food services (%)
Most Common Industries - Arts, entertainment, and recreation (%)
Most Common Industries - Accommodation and food services (%)
Most Common Industries - Other services, except public administration (%)
Most Common Industries - Public administration (%)
Occupation diversity
Most Common Occupations - Management, business, science, and arts occupations (%)
Most Common Occupations - Management, business, and financial occupations (%)
Most Common Occupations - Management occupations (%)
Most Common Occupations - Business and financial operations occupations (%)
Most Common Occupations - Computer, engineering, and science occupations (%)
Most Common Occupations - Computer and mathematical occupations (%)
Most Common Occupations - Architecture and engineering occupations (%)
Most Common Occupations - Life, physical, and social science occupations (%)
Most Common Occupations - Education, legal, community service, arts, and media occupations (%)
Most Common Occupations - Community and social service occupations (%)
Most Common Occupations - Legal occupations (%)
Most Common Occupations - Education, training, and library occupations (%)
Most Common Occupations - Arts, design, entertainment, sports, and media occupations (%)
Most Common Occupations - Healthcare practitioners and technical occupations (%)
Most Common Occupations - Health diagnosing and treating practitioners and other technical occupations (%)
Most Common Occupations - Health technologists and technicians (%)
Most Common Occupations - Service occupations (%)
Most Common Occupations - Healthcare support occupations (%)
Most Common Occupations - Protective service occupations (%)
Most Common Occupations - Fire fighting and prevention, and other protective service workers including supervisors (%)
Most Common Occupations - Law enforcement workers including supervisors (%)
Most Common Occupations - Food preparation and serving related occupations (%)
Most Common Occupations - Building and grounds cleaning and maintenance occupations (%)
Most Common Occupations - Personal care and service occupations (%)
Most Common Occupations - Sales and office occupations (%)
Most Common Occupations - Sales and related occupations (%)
Most Common Occupations - Office and administrative support occupations (%)
Most Common Occupations - Natural resources, construction, and maintenance occupations (%)
Most Common Occupations - Farming, fishing, and forestry occupations (%)
Most Common Occupations - Construction and extraction occupations (%)
Most Common Occupations - Installation, maintenance, and repair occupations (%)
Most Common Occupations - Production, transportation, and material moving occupations (%)
Most Common Occupations - Production occupations (%)
Most Common Occupations - Transportation occupations (%)
Most Common Occupations - Material moving occupations (%)
People in Group quarters - Institutionalized population (%)
People in Group quarters - Correctional institutions (%)
People in Group quarters - Federal prisons and detention centers (%)
People in Group quarters - Halfway houses (%)
People in Group quarters - Local jails and other confinement facilities (including police lockups) (%)
People in Group quarters - Military disciplinary barracks (%)
People in Group quarters - State prisons (%)
People in Group quarters - Other types of correctional institutions (%)
People in Group quarters - Nursing homes (%)
People in Group quarters - Hospitals/wards, hospices, and schools for the handicapped (%)
People in Group quarters - Hospitals/wards and hospices for chronically ill (%)
People in Group quarters - Hospices or homes for chronically ill (%)
People in Group quarters - Military hospitals or wards for chronically ill (%)
People in Group quarters - Other hospitals or wards for chronically ill (%)
People in Group quarters - Hospitals or wards for drug/alcohol abuse (%)
People in Group quarters - Mental (Psychiatric) hospitals or wards (%)
People in Group quarters - Schools, hospitals, or wards for the mentally retarded (%)
People in Group quarters - Schools, hospitals, or wards for the physically handicapped (%)
People in Group quarters - Institutions for the deaf (%)
People in Group quarters - Institutions for the blind (%)
People in Group quarters - Orthopedic wards and institutions for the physically handicapped (%)
People in Group quarters - Wards in general hospitals for patients who have no usual home elsewhere (%)
People in Group quarters - Wards in military hospitals for patients who have no usual home elsewhere (%)
People in Group quarters - Juvenile institutions (%)
People in Group quarters - Long-term care (%)
People in Group quarters - Homes for abused, dependent, and neglected children (%)
People in Group quarters - Residential treatment centers for emotionally disturbed children (%)
People in Group quarters - Training schools for juvenile delinquents (%)
People in Group quarters - Short-term care, detention or diagnostic centers for delinquent children (%)
People in Group quarters - Type of juvenile institution unknown (%)
People in Group quarters - Noninstitutionalized population (%)
People in Group quarters - College dormitories (includes college quarters off campus) (%)
People in Group quarters - Military quarters (%)
People in Group quarters - On base (%)
People in Group quarters - Barracks, unaccompanied personnel housing (UPH), (Enlisted/Officer), ;and similar group living quarters for military personnel (%)
People in Group quarters - Transient quarters for temporary residents (%)
People in Group quarters - Military ships (%)
People in Group quarters - Group homes (%)
People in Group quarters - Homes or halfway houses for drug/alcohol abuse (%)
People in Group quarters - Homes for the mentally ill (%)
People in Group quarters - Homes for the mentally retarded (%)
People in Group quarters - Homes for the physically handicapped (%)
People in Group quarters - Other group homes (%)
People in Group quarters - Religious group quarters (%)
People in Group quarters - Dormitories (%)
People in Group quarters - Agriculture workers' dormitories on farms (%)
People in Group quarters - Job Corps and vocational training facilities (%)
People in Group quarters - Other workers' dormitories (%)
People in Group quarters - Crews of maritime vessels (%)
People in Group quarters - Other nonhousehold living situations (%)
People in Group quarters - Other noninstitutional group quarters (%)
Residents speaking English at home (%)
Residents speaking English at home - Born in the United States (%)
Residents speaking English at home - Native, born elsewhere (%)
Residents speaking English at home - Foreign born (%)
Residents speaking Spanish at home (%)
Residents speaking Spanish at home - Born in the United States (%)
Residents speaking Spanish at home - Native, born elsewhere (%)
Residents speaking Spanish at home - Foreign born (%)
Residents speaking other language at home (%)
Residents speaking other language at home - Born in the United States (%)
Residents speaking other language at home - Native, born elsewhere (%)
Residents speaking other language at home - Foreign born (%)
Class of Workers - Employee of private company (%)
Class of Workers - Self-employed in own incorporated business (%)
Class of Workers - Private not-for-profit wage and salary workers (%)
Class of Workers - Local government workers (%)
Class of Workers - State government workers (%)
Class of Workers - Federal government workers (%)
Class of Workers - Self-employed workers in own not incorporated business and Unpaid family workers (%)
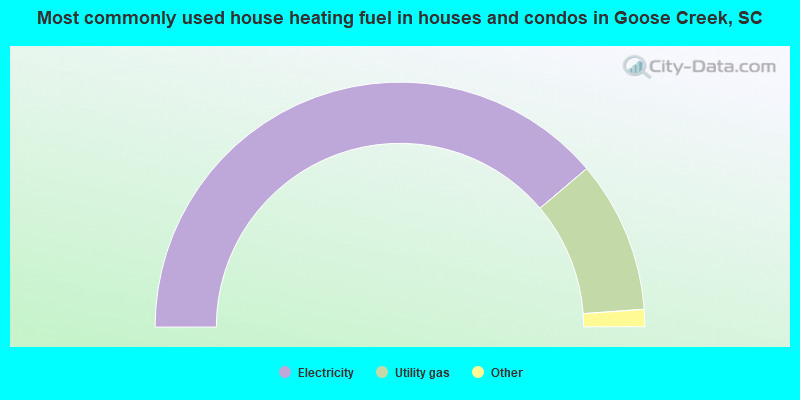
House heating fuel used in houses and condos - Utility gas (%)
House heating fuel used in houses and condos - Bottled, tank, or LP gas (%)
House heating fuel used in houses and condos - Electricity (%)
House heating fuel used in houses and condos - Fuel oil, kerosene, etc. (%)
House heating fuel used in houses and condos - Coal or coke (%)
House heating fuel used in houses and condos - Wood (%)
House heating fuel used in houses and condos - Solar energy (%)
House heating fuel used in houses and condos - Other fuel (%)
House heating fuel used in houses and condos - No fuel used (%)
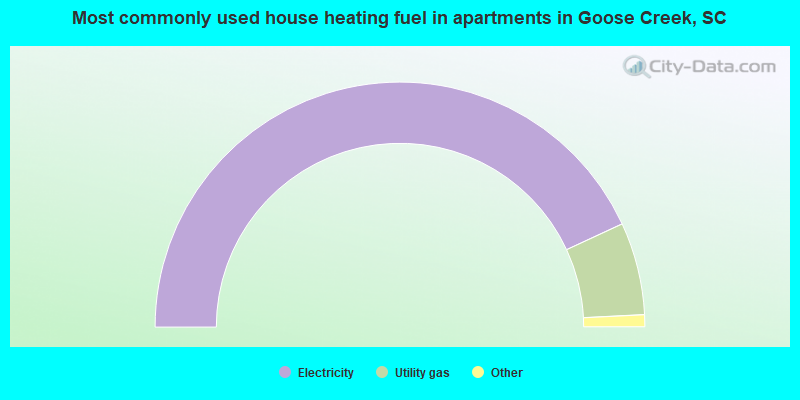
House heating fuel used in apartments - Utility gas (%)
House heating fuel used in apartments - Bottled, tank, or LP gas (%)
House heating fuel used in apartments - Electricity (%)
House heating fuel used in apartments - Fuel oil, kerosene, etc. (%)
House heating fuel used in apartments - Coal or coke (%)
House heating fuel used in apartments - Wood (%)
House heating fuel used in apartments - Solar energy (%)
House heating fuel used in apartments - Other fuel (%)
House heating fuel used in apartments - No fuel used (%)
Armed forces status - In Armed Forces (%)
Armed forces status - Civilian (%)
Armed forces status - Civilian - Veteran (%)
Armed forces status - Civilian - Nonveteran (%)
Fatal accidents locations in years 2005-2021
Fatal accidents locations in 2005
Fatal accidents locations in 2006
Fatal accidents locations in 2007
Fatal accidents locations in 2008
Fatal accidents locations in 2009
Fatal accidents locations in 2010
Fatal accidents locations in 2011
Fatal accidents locations in 2012
Fatal accidents locations in 2013
Fatal accidents locations in 2014
Fatal accidents locations in 2015
Fatal accidents locations in 2016
Fatal accidents locations in 2017
Fatal accidents locations in 2018
Fatal accidents locations in 2019
Fatal accidents locations in 2020
Fatal accidents locations in 2021
Alcohol use - People drinking some alcohol every month (%)
Alcohol use - People not drinking at all (%)
Alcohol use - Average days/month drinking alcohol
Alcohol use - Average drinks/week
Alcohol use - Average days/year people drink much
Audiometry - Average condition of hearing (%)
Audiometry - People that can hear a whisper from across a quiet room (%)
Audiometry - People that can hear normal voice from across a quiet room (%)
Audiometry - Ears ringing, roaring, buzzing (%)
Audiometry - Had a job exposure to loud noise (%)
Audiometry - Had off-work exposure to loud noise (%)
Blood Pressure & Cholesterol - Has high blood pressure (%)
Blood Pressure & Cholesterol - Checking blood pressure at home (%)
Blood Pressure & Cholesterol - Frequently checking blood cholesterol (%)
Blood Pressure & Cholesterol - Has high cholesterol level (%)
Consumer Behavior - Money monthly spent on food at supermarket/grocery store
Consumer Behavior - Money monthly spent on food at other stores
Consumer Behavior - Money monthly spent on eating out
Consumer Behavior - Money monthly spent on carryout/delivered foods
Consumer Behavior - Income spent on food at supermarket/grocery store (%)
Consumer Behavior - Income spent on food at other stores (%)
Consumer Behavior - Income spent on eating out (%)
Consumer Behavior - Income spent on carryout/delivered foods (%)
Current Health Status - General health condition (%)
Current Health Status - Blood donors (%)
Current Health Status - Has blood ever tested for HIV virus (%)
Current Health Status - Left-handed people (%)
Dermatology - People using sunscreen (%)
Diabetes - Diabetics (%)
Diabetes - Had a blood test for high blood sugar (%)
Diabetes - People taking insulin (%)
Diet Behavior & Nutrition - Diet health (%)
Diet Behavior & Nutrition - Milk product consumption (# of products/month)
Diet Behavior & Nutrition - Meals not home prepared (#/week)
Diet Behavior & Nutrition - Meals from fast food or pizza place (#/week)
Diet Behavior & Nutrition - Ready-to-eat foods (#/month)
Diet Behavior & Nutrition - Frozen meals/pizza (#/month)
Drug Use - People that ever used marijuana or hashish (%)
Drug Use - Ever used hard drugs (%)
Drug Use - Ever used any form of cocaine (%)
Drug Use - Ever used heroin (%)
Drug Use - Ever used methamphetamine (%)
Health Insurance - People covered by health insurance (%)
Kidney Conditions-Urology - Avg. # of times urinating at night
Medical Conditions - People with asthma (%)
Medical Conditions - People with anemia (%)
Medical Conditions - People with psoriasis (%)
Medical Conditions - People with overweight (%)
Medical Conditions - Elderly people having difficulties in thinking or remembering (%)
Medical Conditions - People who ever received blood transfusion (%)
Medical Conditions - People having trouble seeing even with glass/contacts (%)
Medical Conditions - People with arthritis (%)
Medical Conditions - People with gout (%)
Medical Conditions - People with congestive heart failure (%)
Medical Conditions - People with coronary heart disease (%)
Medical Conditions - People with angina pectoris (%)
Medical Conditions - People who ever had heart attack (%)
Medical Conditions - People who ever had stroke (%)
Medical Conditions - People with emphysema (%)
Medical Conditions - People with thyroid problem (%)
Medical Conditions - People with chronic bronchitis (%)
Medical Conditions - People with any liver condition (%)
Medical Conditions - People who ever had cancer or malignancy (%)
Mental Health - People who have little interest in doing things (%)
Mental Health - People feeling down, depressed, or hopeless (%)
Mental Health - People who have trouble sleeping or sleeping too much (%)
Mental Health - People feeling tired or having little energy (%)
Mental Health - People with poor appetite or overeating (%)
Mental Health - People feeling bad about themself (%)
Mental Health - People who have trouble concentrating on things (%)
Mental Health - People moving or speaking slowly or too fast (%)
Mental Health - People having thoughts they would be better off dead (%)
Oral Health - Average years since last visit a dentist
Oral Health - People embarrassed because of mouth (%)
Oral Health - People with gum disease (%)
Oral Health - General health of teeth and gums (%)
Oral Health - Average days a week using dental floss/device
Oral Health - Average days a week using mouthwash for dental problem
Oral Health - Average number of teeth
Pesticide Use - Households using pesticides to control insects (%)
Pesticide Use - Households using pesticides to kill weeds (%)
Physical Activity - People doing vigorous-intensity work activities (%)
Physical Activity - People doing moderate-intensity work activities (%)
Physical Activity - People walking or bicycling (%)
Physical Activity - People doing vigorous-intensity recreational activities (%)
Physical Activity - People doing moderate-intensity recreational activities (%)
Physical Activity - Average hours a day doing sedentary activities
Physical Activity - Average hours a day watching TV or videos
Physical Activity - Average hours a day using computer
Physical Functioning - People having limitations keeping them from working (%)
Physical Functioning - People limited in amount of work they can do (%)
Physical Functioning - People that need special equipment to walk (%)
Physical Functioning - People experiencing confusion/memory problems (%)
Physical Functioning - People requiring special healthcare equipment (%)
Prescription Medications - Average number of prescription medicines taking
Preventive Aspirin Use - Adults 40+ taking low-dose aspirin (%)
Reproductive Health - Vaginal deliveries (%)
Reproductive Health - Cesarean deliveries (%)
Reproductive Health - Deliveries resulted in a live birth (%)
Reproductive Health - Pregnancies resulted in a delivery (%)
Reproductive Health - Women breastfeeding newborns (%)
Reproductive Health - Women that had a hysterectomy (%)
Reproductive Health - Women that had both ovaries removed (%)
Reproductive Health - Women that have ever taken birth control pills (%)
Reproductive Health - Women taking birth control pills (%)
Reproductive Health - Women that have ever used Depo-Provera or injectables (%)
Reproductive Health - Women that have ever used female hormones (%)
Sexual Behavior - People 18+ that ever had sex (vaginal, anal, or oral) (%)
Sexual Behavior - Males 18+ that ever had vaginal sex with a woman (%)
Sexual Behavior - Males 18+ that ever performed oral sex on a woman (%)
Sexual Behavior - Males 18+ that ever had anal sex with a woman (%)
Sexual Behavior - Males 18+ that ever had any sex with a man (%)
Sexual Behavior - Females 18+ that ever had vaginal sex with a man (%)
Sexual Behavior - Females 18+ that ever performed oral sex on a man (%)
Sexual Behavior - Females 18+ that ever had anal sex with a man (%)
Sexual Behavior - Females 18+ that ever had any kind of sex with a woman (%)
Sexual Behavior - Average age people first had sex
Sexual Behavior - Average number of female sex partners in lifetime (males 18+)
Sexual Behavior - Average number of female vaginal sex partners in lifetime (males 18+)
Sexual Behavior - Average age people first performed oral sex on a woman (18+)
Sexual Behavior - Average number of woman performed oral sex on in lifetime (18+)
Sexual Behavior - Average number of male sex partners in lifetime (males 18+)
Sexual Behavior - Average number of male anal sex partners in lifetime (males 18+)
Sexual Behavior - Average age people first performed oral sex on a man (18+)
Sexual Behavior - Average number of male oral sex partners in lifetime (18+)
Sexual Behavior - People using protection when performing oral sex (%)
Sexual Behavior - Average number of times people have vaginal or anal sex a year
Sexual Behavior - People having sex without condom (%)
Sexual Behavior - Average number of male sex partners in lifetime (females 18+)
Sexual Behavior - Average number of male vaginal sex partners in lifetime (females 18+)
Sexual Behavior - Average number of female sex partners in lifetime (females 18+)
Sexual Behavior - Circumcised males 18+ (%)
Sleep Disorders - Average hours sleeping at night
Sleep Disorders - People that has trouble sleeping (%)
Smoking-Cigarette Use - People smoking cigarettes (%)
Taste & Smell - People 40+ having problems with smell (%)
Taste & Smell - People 40+ having problems with taste (%)
Taste & Smell - People 40+ that ever had wisdom teeth removed (%)
Taste & Smell - People 40+ that ever had tonsils teeth removed (%)
Taste & Smell - People 40+ that ever had a loss of consciousness because of a head injury (%)
Taste & Smell - People 40+ that ever had a broken nose or other serious injury to face or skull (%)
Taste & Smell - People 40+ that ever had two or more sinus infections (%)
Weight - Average height (inches)
Weight - Average weight (pounds)
Weight - Average BMI
Weight - People that are obese (%)
Weight - People that ever were obese (%)
Weight - People trying to lose weight (%)
Officers per 1,000 residents here:
1.72South Carolina average:
2.21
Latest news from Goose Creek, SC collected exclusively by city-data.com from local newspapers, TV, and radio stations
Ancestries: American (15.3%), English (7.3%), Irish (5.6%), German (5.3%), European (3.0%), Italian (2.2%).
Current Local Time:
Land area: 31.7 square miles.
Population density: 1,503 people per square mile (low).
3,039 residents are foreign born (2.8% Asia , 2.7% Latin America , 0.9% Europe ).
This city:
6.3%South Carolina:
5.3%
Median real estate property taxes paid for housing units with mortgages in 2022: $1,426 (0.5%)Median real estate property taxes paid for housing units with no mortgage in 2022: $1,131 (0.4%)
Nearest city with pop. 50,000+: North Charleston, SC
Nearest city with pop. 200,000+: Charlotte, NC
Nearest city with pop. 1,000,000+: Philadelphia, PA
Nearest cities:
Latitude: 33.00 N, Longitude: 80.03 W
Daytime population change due to commuting: -6,540 (-13.5%)Workers who live and work in this city: 9,888 (36.2%)
Area code commonly used in this area: 843
Single-family new house construction building permits:
2022: 527 buildings , average cost: $381,2002021: 372 buildings , average cost: $202,8002020: 380 buildings , average cost: $183,0002019: 363 buildings , average cost: $172,4002018: 287 buildings , average cost: $177,2002017: 266 buildings , average cost: $181,7002016: 210 buildings , average cost: $172,4002015: 180 buildings , average cost: $176,5002014: 124 buildings , average cost: $161,7002013: 158 buildings , average cost: $141,2002012: 193 buildings , average cost: $137,8002011: 199 buildings , average cost: $132,8002010: 285 buildings , average cost: $115,2002009: 268 buildings , average cost: $117,8002008: 432 buildings , average cost: $121,3002007: 461 buildings , average cost: $144,4002006: 477 buildings , average cost: $141,5002005: 508 buildings , average cost: $132,7002004: 369 buildings , average cost: $169,3002003: 248 buildings , average cost: $163,2002002: 323 buildings , average cost: $156,6002001: 270 buildings , average cost: $148,9002000: 216 buildings , average cost: $141,8001999: 303 buildings , average cost: $106,9001998: 235 buildings , average cost: $122,3001997: 188 buildings , average cost: $112,900Unemployment in December 2023: Here:
2.9%South Carolina:
3.1%
Population change in the 1990s: +3,184 (+12.2%).
Most common occupations in Goose Creek, SC (%)
Both Males Females
Electrical equipment mechanics and other installation, maintenance, and repair workers, including supervisors (5.1%)
Other sales and related occupations, including supervisors (5.0%)
Other management occupations, except farmers and farm managers (3.9%)
Other production occupations, including supervisors (3.7%)
Other office and administrative support workers, including supervisors (3.6%)
Information and record clerks, except customer service representatives (3.5%)
Secretaries and administrative assistants (3.3%)
Electrical equipment mechanics and other installation, maintenance, and repair workers, including supervisors (9.8%)
Driver/sales workers and truck drivers (5.6%)
Other production occupations, including supervisors (4.9%)
Other sales and related occupations, including supervisors (4.7%)
Other management occupations, except farmers and farm managers (3.8%)
Vehicle and mobile equipment mechanics, installers, and repairers (3.6%)
Computer specialists (3.1%)
Secretaries and administrative assistants (6.7%)
Preschool, kindergarten, elementary, and middle school teachers (5.8%)
Information and record clerks, except customer service representatives (5.6%)
Other office and administrative support workers, including supervisors (5.4%)
Other sales and related occupations, including supervisors (5.3%)
Other management occupations, except farmers and farm managers (4.1%)
Registered nurses (3.9%)
Tornado activity:
Goose Creek-area historical tornado activity is below South Carolina state average. It is 37% smaller than the overall U.S. average.
On 9/11/1960, a category F3 (max. wind speeds 158-206 mph) tornado 13.8 miles away from the Goose Creek city center injured 10 people and caused between $500,000 and $5,000,000 in damages.
On 5/10/1998, a category F2 (max. wind speeds 113-157 mph) tornado 1.1 miles away from the city center killed one person and injured 7 people and caused $5 million in damages.
Earthquake activity:
Goose Creek-area historical earthquake activity is significantly above South Carolina state average. It is 50% smaller than the overall U.S. average. On 11/22/1974 at 05:25:55, a magnitude 4.7 (4.7 MB, Class: Light, Intensity: IV - V) earthquake occurred 9.4 miles away from the city center On 8/21/1992 at 16:31:55, a magnitude 4.4 (4.1 MB, 4.1 LG, 4.4 LG, Depth: 6.2 mi) earthquake occurred 6.3 miles away from the city center On 8/2/1974 at 08:52:09, a magnitude 4.9 (4.3 MB, 4.9 LG) earthquake occurred 154.3 miles away from Goose Creek center On 8/23/2011 at 17:51:04, a magnitude 5.8 (5.8 MW, Depth: 3.7 mi, Class: Moderate, Intensity: VI - VII) earthquake occurred 359.7 miles away from Goose Creek center On 4/17/1995 at 13:45:57, a magnitude 3.9 (3.9 LG, Depth: 6.2 mi, Class: Light, Intensity: II - III) earthquake occurred 4.1 miles away from Goose Creek center On 8/9/2020 at 12:07:37, a magnitude 5.1 (5.1 MW, Depth: 4.7 mi) earthquake occurred 248.2 miles away from the city center Magnitude types: regional Lg-wave magnitude (LG), body-wave magnitude (MB), moment magnitude (MW) Natural disasters: The number of natural disasters in Berkeley County (18) is near the US average (15).Major Disasters (Presidential) Declared: 8Emergencies Declared: 5Hurricanes: 9, Storms: 3, Winter Storms: 3, Floods: 2, Tropical Storms: 2, Tornado: 1, Wind: 1, Other: 1 (Note: some incidents may be assigned to more than one category). Hospitals and medical centers in Goose Creek: CHARLESTON RENAL CARE LLC GOOSE CREEK (109 GREENLAND DRIVE)
DCI GOOSE CREEK INC (98 HAMLET CIRCLE)
Other hospitals and medical centers near Goose Creek: LIFE CARE CENTER OF CHARLESTON (Nursing Home, about 3 miles away; N CHARLESTON, SC)
AMEDISYS HOME HEALTH OF CHARLESTON (Home Health Center, about 3 miles away; NORTH CHARLESTON, SC)
HEALTHSOUTH OF CHARLESTON, INC (Hospital, about 3 miles away; NORTH CHARLESTON, SC)
INTREPID USA HEALTHCARE SERVICES (Home Health Center, about 3 miles away; N CHARLESTON, SC)
RAI CARE CENTERS N CHARLESTON (Dialysis Facility, about 3 miles away; CHARLESTON, SC)
TRIDENT MEDICAL CENTER (about 3 miles away; CHARLESTON, SC)
TRIDENT MEDICAL SKILLED NURSING CARE CENTER (Nursing Home, about 3 miles away; CHARLESTON, SC)
Airports located in Goose Creek: Amtrak station near Goose Creek: 9 miles: CHARLESTON (N. CHARLESTON, 4565 GAYNOR AVE.) Services: ticket office, fully wheelchair accessible, enclosed waiting area, public restrooms, public payphones, vending machines, free short-term parking, free long-term parking, call for car rental service, call for taxi service.
College/University in Goose Creek: Lacy Cosmetology School-Goose Creek Full-time enrollment: 47; Location: 98 Davenport St; Private, for-profit; Website: www.lacyschools.com)
Colleges/universities with over 2000 students nearest to Goose Creek:
Charleston Southern University (about 3 miles; Charleston, SC ; Full-time enrollment: 3,012)
Trident Technical College (about 5 miles; Charleston, SC ; FT enrollment: 13,125)
Citadel Military College of South Carolina (about 15 miles; Charleston, SC ; FT enrollment: 3,683)
Medical University of South Carolina (about 16 miles; Charleston, SC ; FT enrollment: 2,138)
College of Charleston (about 16 miles; Charleston, SC ; FT enrollment: 10,974)
South Carolina State University (about 59 miles; Orangeburg, SC ; FT enrollment: 3,481)
Orangeburg Calhoun Technical College (about 60 miles; Orangeburg, SC ; FT enrollment: 2,113)
Public high schools in Goose Creek: GOOSE CREEK HIGH Students: 1,645, Location: 1137 REDBANK ROAD, Grades: 9-12)STRATFORD HIGH Location: 951 CROWFIELD BOULEVARD, Grades: 9-12)
Biggest public elementary/middle schools in Goose Creek: GOOSE CREEK PRIMARY Students: 934, Location: 200 FOSTER CREEK ROAD, Grades: PK-2)DEVON FOREST ELEMENTARY Students: 870, Location: 1127 DOROTHY STREET, Grades: PK-5)WESTVIEW PRIMARY Students: 765, Location: 98 WESTVIEW BOULEVARD, Grades: PK-2)BOULDER BLUFF ELEMENTARY Students: 715, Location: 400 JUDY DRIVE, Grades: PK-5)SEDGEFIELD INTERMEDIATE Students: 665, Location: 225 GARWOOD DRIVE, Grades: 3-5)HOWE HALL AIMS ELEMENTARY Students: 421, Location: 115 HOWE HALL ROAD, Grades: KG-5)WESTVIEW ELEMENTARY Location: 100 WESTVIEW BOULEVARD, Grades: 3-5)
SEDGEFIELD MIDDLE Location: 131 CHARLES B. GIBSON BLVD, Grades: 6-8)
MARRINGTON MIDDLE SCHOOL OF THE ARTS Location: 109 GEARING STREET, Grades: 6-8)
MARRINGTON ELEMENTARY Location: 101 GEARING STREET, Grades: PK-5)
Private elementary/middle schools in Goose Creek: NEW LIFE CHRISTIAN ACADEMY Students: 78, Location: PO BOX 201, Grades: PK-1)
CROWFIELD ACADEMY Students: 15, Location: 240 WESTVIEW BLVD, Grades: KG-1)
See full list of schools located in Goose Creek
Notable locations in Goose Creek: (A) , Redbank Plantation Golf Course (B) , Lower Berkeley Wastewater Treatment Facility (C) , Marrington Plantation (D) , Berkeley County Library Goose Creek Branch (E) , Goose Creek Community Center (F) , Casey Community Center (G) , Pinewood House (H) , Goose Creek City Fire Department (I) , Goose Creek Rural Fire Department Station 3 (J) , Goose Creek Police Department (K) . Display/hide their locations on the map
Shopping Centers: (1) , Goose Plaza Shopping Center (2) . Display/hide their locations on the map
Churches in Goose Creek include: (A) , Casey Church (B) , Mount Carmel Church (C) . Display/hide their locations on the map
Cemetery: (1) . Display/hide its location on the map
Reservoirs and swamps: (A) , Dutes Pond (B) , Georgie Pond (C) , Logan Pond (D) , New Tenant Pond (E) , Old Tenant Pond (F) , Wilson Pond (G) , Huckhole Swamp (H) . Display/hide their locations on the map
Streams, rivers, and creeks: (A) , Lindley Branch (B) . Display/hide their locations on the map
Tourist attractions: (1) , Deleon Amusements Inc (Amusement & Theme Parks; 222 Redbank Road) (2) , Goosecreek Travel (332 Pandora Drive) (3) , CAPT Bo Gator's Boat Tours Inc (Tours & Charters; 132 Redbank Road Apt A) (4) . Display/hide their approximate locations on the map
Hotels: (1) , Econo Lodge (401 Goose Creek Blvd N) (2) , Quality Inn Goose Creek (103 Red Bank Road) (3) . Display/hide their approximate locations on the map
Courts: (1) , Goose Creek City - Municapal Court- Clerk of Court (519 North Goose Creek Boulevard) (2) . Display/hide their approximate locations on the map
Birthplace of: Matt Wieters - Baseball player, REO (record producer) - Music producer, Andre Manning - College basketball player (Gardner Webb Runnin' Bulldogs), Donnell Covington - College basketball player (Char. Southern Buccaneers).
Berkeley County has a predicted average indoor radon screening level less than 2 pCi/L (pico curies per liter) - Low Potential Drinking water stations with addresses in Goose Creek that have no violations reported:
GOOSE CREEK CITY OF (0810004) (Population served: 25,772, Primary Water Source Type: Purch surface water)
Average household size: This city:
2.7 peopleSouth Carolina:
2.5 people
Percentage of family households: This city:
75.4%Whole state:
67.5%
Percentage of households with unmarried partners: This city:
5.8%Whole state:
6.0%
Likely homosexual households (counted as self-reported same-sex unmarried-partner households)
Lesbian couples: 0.4% of all households Gay men: 0.3% of all households
2,322 people in military barracks and dormitories (nondisciplinary) in 2010People in group quarters in Goose Creek in 2000:
2,738 people in military barracks, etc.
69 people in military transient quarters for temporary residents
58 people in other nonhousehold living situations
28 people in nursing homes
Banks with branches in Goose Creek (2011 data):
SunTrust Bank: Goose Creek Branch at 539 Saint James Ave, branch established on 2007/04/30; Goose Creek Bi-Lo Branch at 142 E. Saint James Avenue, branch established on 2006/04/28. Info updated 2010/05/27: Bank assets: $171,291.7 mil, Deposits: $129,833.2 mil, headquarters in Atlanta, GA, positive income , Commercial Lending Specialization, 1716 total offices , Holding Company: Suntrust Banks, Inc.
First Federal Savings and Loan Association of Charleston: St James Boulevard Branch at 218 St. James Blvd., branch established on 1934/07/01; Wal-Mart Goose Creek Branch at 605 Saint James Avenue, branch established on 2004/09/15. Info updated 2012/02/24: Bank assets: $3,140.4 mil, Deposits: $2,278.8 mil, headquarters in Charleston, SC, negative income in the last year , Mortgage Lending Specialization, 69 total offices
Synovus Bank: Goose Creek Branch at 305 Goose Creek Boulevard North, branch established on 1976/05/13. Info updated 2011/01/25: Bank assets: $26,863.3 mil, Deposits: $22,415.0 mil, headquarters in Columbus, GA, positive income , Commercial Lending Specialization, 296 total offices , Holding Company: Synovus Financial Corp.
SouthCoast Community Bank: Goose Creek Branch at 597 Old Mt. Holly Road, branch established on 2004/12/17. Info updated 2006/11/03: Bank assets: $425.3 mil, Deposits: $318.7 mil, headquarters in Mount Pleasant, SC, negative income in the last year , Commercial Lending Specialization, 12 total offices , Holding Company: Southcoast Financial Corporation
Branch Banking and Trust Company: Goose Creek Branch at 144 St James Avenue, branch established on 1933/01/01. Info updated 2010/03/29: Bank assets: $168,867.6 mil, Deposits: $127,549.5 mil, headquarters in Winston Salem, NC, positive income , Commercial Lending Specialization, 1793 total offices , Holding Company: Bb&T Corporation
First National Bank of South Carolina: Goose Creek Branch at 106 Thomason Boulevard, branch established on 1999/04/15. Info updated 2006/11/03: Bank assets: $155.6 mil, Deposits: $129.2 mil, headquarters in Holly Hill, SC, positive income , Commercial Lending Specialization, 8 total offices , Holding Company: Fnb Corporation
Wells Fargo Bank, National Association: Berkeley Square at 101 Berkeley Square Lane, branch established on 1969/06/02. Info updated 2011/04/05: Bank assets: $1,161,490.0 mil, Deposits: $905,653.0 mil, headquarters in Sioux Falls, SD, positive income , 6395 total offices , Holding Company: Wells Fargo & Company
Bank of America, National Association: Goose Creek Branch at 212 St. James Avenue, branch established on 1982/10/11. Info updated 2009/11/18: Bank assets: $1,451,969.3 mil, Deposits: $1,077,176.8 mil, headquarters in Charlotte, NC, positive income , 5782 total offices , Holding Company: Bank Of America Corporation
For population 15 years and over in Goose Creek:
Never married: 32.4%Now married: 54.3%Separated: 1.4%Widowed: 3.3%Divorced: 8.6% For population 25 years and over in Goose Creek:
High school or higher: 92.8%Bachelor's degree or higher: 27.5%Graduate or professional degree: 10.2%Unemployed: 4.4%Mean travel time to work (commute): 25.0 minutes
Education Gini index (Inequality in education) Here:
9.7South Carolina average:
11.1
Religion statistics for Goose Creek, SC (based on Berkeley County data)
Religion Adherents Congregations Evangelical Protestant 28,148 126 Mainline Protestant 10,346 51 Catholic 7,244 4 Black Protestant 6,388 37 Other 2,215 7 None 123,502 -
Source: Clifford Grammich, Kirk Hadaway, Richard Houseal, Dale E.Jones, Alexei Krindatch, Richie Stanley and Richard H.Taylor. 2012. 2010 U.S.Religion Census: Religious Congregations & Membership Study. Association of Statisticians of American Religious Bodies. Jones, Dale E., et al. 2002. Congregations and Membership in the United States 2000. Nashville, TN: Glenmary Research Center. Graphs represent county-level data
Food Environment Statistics: Number of grocery stores : 17Berkeley County :
1.04 / 10,000 pop.South Carolina :
1.99 / 10,000 pop.
Number of supercenters and club stores : 2Berkeley County :
0.12 / 10,000 pop.State :
0.15 / 10,000 pop.
Number of convenience stores (no gas) : 12Berkeley County :
0.73 / 10,000 pop.South Carolina :
0.85 / 10,000 pop.
Number of convenience stores (with gas) : 58Berkeley County :
3.55 / 10,000 pop.South Carolina :
5.38 / 10,000 pop.
Number of full-service restaurants : 69Berkeley County :
4.22 / 10,000 pop.South Carolina :
7.75 / 10,000 pop.
Adult diabetes rate : This county :
11.3%South Carolina :
10.6%
Adult obesity rate : Here :
33.5%South Carolina :
29.4%
Low-income preschool obesity rate : Berkeley County :
11.8%South Carolina :
13.4%
Health and Nutrition: Healthy diet rate : Goose Creek:
48.9%South Carolina:
49.2%
Average overall health of teeth and gums : This city:
47.9%State:
46.2%
Average BMI : This city:
28.6South Carolina:
29.0
People feeling badly about themselves : Goose Creek:
20.8%State:
20.4%
People not drinking alcohol at all : Goose Creek:
10.1%State:
11.0%
Average hours sleeping at night : Goose Creek:
6.8South Carolina:
6.8
Overweight people : Goose Creek:
32.0%South Carolina:
34.4%
General health condition : Goose Creek:
58.4%South Carolina:
55.6%
Average condition of hearing : Goose Creek:
82.2%South Carolina:
79.9%
More about Health and Nutrition of Goose Creek, SC Residents
Local government employment and payroll (March 2022)
Function
Full-time employees
Monthly full-time payroll
Average yearly full-time wage
Part-time employees
Monthly part-time payroll
Police Protection - Officers
78 $397,218 $61,110 0 $0 Firefighters
46 $324,781 $84,725 0 $0 Parks and Recreation
38 $139,640 $44,097 73 $60,638 Police - Other
24 $98,630 $49,315 2 $2,393 Solid Waste Management
22 $76,219 $41,574 0 $0 Other Government Administration
16 $101,434 $76,076 8 $9,399 Water Supply
14 $63,224 $54,192 0 $0 Financial Administration
11 $59,008 $64,372 0 $0 Other and Unallocable
11 $48,648 $53,071 0 $0 Judicial and Legal
4 $13,907 $41,721 2 $5,755 Fire - Other
2 $8,645 $51,870 0 $0
Totals for Government
266 $1,331,355 $60,061 85 $78,185
Goose Creek government finances - Expenditure in 2021 (per resident):
Construction - Parks and Recreation: $346,000 ($7.27)
Water Utilities: $277,000 ($5.82)Regular Highways: $14,000 ($0.29)Current Operations - Police Protection: $8,244,000 ($173.13)
Local Fire Protection: $5,844,000 ($122.73)Parks and Recreation: $4,871,000 ($102.29)Central Staff Services: $3,546,000 ($74.47)Water Utilities: $3,297,000 ($69.24)Solid Waste Management: $1,629,000 ($34.21)Regular Highways: $965,000 ($20.27)General - Other: $453,000 ($9.51)Financial Administration: $394,000 ($8.27)Judicial and Legal Services: $388,000 ($8.15)Health - Other: $119,000 ($2.50)General - Interest on Debt: $39,000 ($0.82)
Other Capital Outlay - Local Fire Protection: $740,000 ($15.54)
Solid Waste Management: $475,000 ($9.98)Police Protection: $321,000 ($6.74)Central Staff Services: $183,000 ($3.84)General - Other: $37,000 ($0.78)Regular Highways: $20,000 ($0.42)Judicial and Legal Services: $11,000 ($0.23)Total Salaries and Wages: $14,670,000 ($308.08)
Water Utilities - Interest on Debt: $109,000 ($2.29)
Goose Creek government finances - Revenue in 2021 (per resident):
Charges - Parks and Recreation: $2,435,000 ($51.14)
Solid Waste Management: $2,116,000 ($44.44)Hospital Public: $635,000 ($13.34)Local Intergovernmental - General Local Government Support: $251,000 ($5.27)
Health and Hospitals: $209,000 ($4.39)Highways: $187,000 ($3.93)Public Welfare: $10,000 ($0.21)Miscellaneous - Sale of Property: $394,000 ($8.27)
General Revenue - Other: $375,000 ($7.88)Fines and Forfeits: $360,000 ($7.56)Interest Earnings: $163,000 ($3.42)Rents: $67,000 ($1.41)Donations From Private Sources: $38,000 ($0.80)Revenue - Water Utilities: $5,626,000 ($118.15)
State Intergovernmental - General Local Government Support: $852,000 ($17.89)
Public Welfare: $341,000 ($7.16)Health and Hospitals: $150,000 ($3.15)Tax - Occupation and Business License - Other: $8,063,000 ($169.33)
General Sales and Gross Receipts: $7,368,000 ($154.73)Property: $4,645,000 ($97.55)Public Utilities Sales: $2,892,000 ($60.73)Other License: $1,881,000 ($39.50)Alcoholic Beverage Sales: $18,000 ($0.38)
Goose Creek government finances - Debt in 2021 (per resident):
Long Term Debt - Beginning Outstanding - Unspecified Public Purpose: $19,598,000 ($411.57)
Outstanding Unspecified Public Purpose: $18,404,000 ($386.49)Retired Unspecified Public Purpose: $6,558,000 ($137.72)Beginning Outstanding - Public Debt for Private Purpose: $5,850,000 ($122.85)Outstanding Nonguaranteed - Industrial Revenue: $5,520,000 ($115.92)Issue, Unspecified Public Purpose: $5,364,000 ($112.65)Retired Nonguaranteed - Public Debt for Private Purpose: $330,000 ($6.93)
Goose Creek government finances - Cash and Securities in 2021 (per resident):
Other Funds - Cash and Securities: $27,414,000 ($575.71)
Sinking Funds - Cash and Securities: $5,697,000 ($119.64)
13.27% of this county's 2021 resident taxpayers lived in other counties in 2020 ($69,278 average adjusted gross income )
Here:
13.27%South Carolina average:
8.89%
0.09% of residents moved from foreign countries ($375 average AGI )Berkeley County:
0.09%South Carolina average:
0.04%
Top counties from which taxpayers relocated into this county between 2020 and 2021:
11.39% of this county's 2020 resident taxpayers moved to other counties in 2021 ($61,922 average adjusted gross income )
Here:
11.39%South Carolina average:
7.46%
0.12% of residents moved to foreign countries ($615 average AGI )Berkeley County:
0.12%South Carolina average:
0.03%
Top counties to which taxpayers relocated from this county between 2020 and 2021:
Businesses in Goose Creek, SC
Name Count Name Count
Ace Hardware 1 Kincaid 1 Advance Auto Parts 1 Lane Furniture 1 Arby's 1 Little Caesars Pizza 2 AutoZone 1 Lowe's 1 Blockbuster 2 McDonald's 4 Burger King 2 Papa John's Pizza 1 CVS 3 Pizza Hut 2 Chick-Fil-A 1 Publix Super Markets 1 Circle K 2 Quality 1 Cricket Wireless 3 RadioShack 1 Curves 1 Rite Aid 2 DHL 1 SONIC Drive-In 1 Days Inn 1 Sprint Nextel 1 Domino's Pizza 1 Subway 4 Dunkin Donuts 3 T-Mobile 3 Econo Lodge 1 Taco Bell 1 FedEx 6 U-Haul 2 Firestone Complete Auto Care 1 UPS 3 GameStop 1 Waffle House 1 H&R Block 4 Walgreens 2 Hardee's 2 Walmart 1 KFC 2
Strongest AM radio stations in Goose Creek:
WIQB (1050 AM; 25 kW; CONWAY, SC; Owner: CUMULUS LICENSING CORP.)
WQTK (950 AM; 10 kW; MONCKS CORNER, SC; Owner: KIRKMAN BROADCASTING, INC.)
WSCC (730 AM; 5 kW; CHARLESTON, SC; Owner: CITICASTERS LICENSES, L.P.)
WTMA (1250 AM; 5 kW; CHARLESTON, SC; Owner: CITADEL BROADCASTING COMPANY)
WXTC (1390 AM; 5 kW; CHARLESTON, SC)
WAZS (980 AM; 1 kW; SUMMERVILLE, SC; Owner: THOMAS B. DANIELS)
WTMZ (910 AM; 0 kW; DORCHESTER TERR.-BRE, SC; Owner: CITADEL BROADCASTING COMPANY)
WCEO (840 AM; daytime; 50 kW; COLUMBIA, SC; Owner: EASTERN BROADCASTING GROUP, INC.)
WBAJ (890 AM; daytime; 50 kW; BLYTHEWOOD, SC; Owner: FAMILY FIRST)
WQIZ (810 AM; daytime; 5 kW; ST. GEORGE, SC; Owner: RADIO PROPERTIES, LLC)
WQSC (1340 AM; 1 kW; CHARLESTON, SC; Owner: KIRKMAN BROADCASTING, INC,)
WQNT (1450 AM; 1 kW; CHARLESTON, SC; Owner: KIRKMAN BROADCASTING, INC.)
WZJY (1480 AM; 1 kW; MOUNT PLEASANT, SC; Owner: LEVAS COMMUNICATIONS, LLC)
Strongest FM radio stations in Goose Creek:
WKCL (91.5 FM; LADSON, SC; Owner: CHAPEL HOLY SPIRIT CHURCH & BIBLE CO)
WSSP (94.3 FM; GOOSE CREEK, SC; Owner: CLEAR CHANNEL BROADCASTING LICENSES, INC.)
WSUY (96.9 FM; CHARLESTON, SC; Owner: CITADEL BROADCASTING COMPANY)
WAVF (96.1 FM; HANAHAN, SC; Owner: APEX BROADCASTING, INC.)
WJNI (106.3 FM; LADSON, SC; Owner: THOMAS B. DANIELS)
WWWZ (93.3 FM; SUMMERVILLE, SC; Owner: CITADEL BROADCASTING COMPANY)
WSCI (89.3 FM; CHARLESTON, SC; Owner: SOUTH CAROLINA EDUCATIONAL TV COMMISSION)
WEZL (103.5 FM; CHARLESTON, SC; Owner: CITICASTERS LICENSES, L.P.)
WSSX-FM (95.1 FM; CHARLESTON, SC; Owner: CITADEL BROADCASTING COMPANY)
WXLY (102.5 FM; NORTH CHARLESTON, SC; Owner: CITICASTERS LICENSES, L.P.)
WYFH (90.7 FM; NORTH CHARLESTON, SC; Owner: BIBLE BROADCASTING NETWORK, INC.)
WNKT (107.5 FM; ST. GEORGE, SC; Owner: CITADEL BROADCASTING COMPANY)
WRFQ (104.5 FM; MOUNT PLEASANT, SC; Owner: CITICASTERS LICENSES, L.P.)
WCSQ (92.5 FM; MONCKS CORNER, SC; Owner: APEX BROADCASTING, INC.)
WALC (100.5 FM; CHARLESTON, SC; Owner: CITICASTERS LICENSES, L.P.)
WMGL (101.7 FM; RAVENEL, SC; Owner: CITADEL BROADCASTING COMPANY)
W205BJ (88.9 FM; CHARLESTON, SC; Owner: CALVARY CHAPEL OF TWIN FALLS, INC.)
W220CN (91.9 FM; CHARLESTON, SC; Owner: RADIO TRAINING NETWORK, INC.)
WYBB (98.1 FM; FOLLY BEACH, SC; Owner: L.M. COMMUNICATIONS OF SOUTH CAROLINA, INC.)
WJWJ-FM (89.9 FM; BEAUFORT, SC; Owner: SOUTH CAROLINA EDUCATIONAL TV COMMISSION)
TV broadcast stations around Goose Creek:
WCBD-TV (Channel 2; CHARLESTON, SC; Owner: MEDIA GENERAL COMMUNICATIONS, INC.)
WCSC-TV (Channel 5; CHARLESTON, SC; Owner: WCSC, INC.)
WITV (Channel 7; CHARLESTON, SC; Owner: SOUTH CAROLINA EDUCATIONAL TV COMMISSION)
WCIV (Channel 4; CHARLESTON, SC; Owner: WCIV, LLC)
WMMP (Channel 36; CHARLESTON, SC; Owner: WMMP LICENSEE L.P.)
WTAT-TV (Channel 24; CHARLESTON, SC; Owner: WTAT LICENSEE, LLC)
WJNI-LP (Channel 57; NORTH CHARLESTON, SC; Owner: THOMAS B. DANIELS)
WTBD-LP (Channel 22; NORTH CHARLESTON, SC; Owner: THOMAS B. DANIELS)
W26CF (Channel 26; SUMMERVILLE, SC; Owner: DOVE BROADCASTING, INC.)
WJEA-LP (Channel 12; CHARLESTON, SC; Owner: CHARLES S. NAMEY)
W21BX (Channel 21; CHARLESTON, SC; Owner: TRINITY BROADCASTING NETWORK)
WJRB-LP (Channel 18; CHARLESTON, SC; Owner: RAUL INFANTE, JR.)
WJWJ-TV (Channel 16; BEAUFORT, SC; Owner: SOUTH CAROLINA EDUCATIONAL TV COMMISSION)
WCHD-LP (Channel 49; CHARLESTON, SC; Owner: IZZO LIVING TRUST)
National Bridge Inventory (NBI) Statistics 22 Number of bridges394ft / 120m Total length $1,341,000 Total costs142,370 Total average daily traffic13,214 Total average daily truck traffic207,849 Total future (year 2035) average daily traffic
New bridges - historical statistics
1 1920-1929 3 1930-1939 1 1940-1949 7 1960-1969 3 1970-1979 2 1980-1989 3 1990-1999 1 2000-2009 1 2010-2019
See full National Bridge Inventory statistics for Goose Creek, SC
Home Mortgage Disclosure Act Aggregated Statistics For Year 2009(Based on 5 partial tracts) A) FHA, FSA/RHS & VA B) Conventional C) Refinancings D) Home Improvement Loans F) Non-occupant Loans on G) Loans On Manufactured Number Average Value Number Average Value Number Average Value Number Average Value Number Average Value Number Average Value
LOANS ORIGINATED 158 $165,136 69 $152,933 501 $167,654 45 $35,392 30 $121,916 4 $31,130 APPLICATIONS APPROVED, NOT ACCEPTED 10 $182,390 6 $91,487 38 $153,795 0 $0 2 $94,405 3 $36,880 APPLICATIONS DENIED 31 $155,390 9 $86,583 176 $168,040 21 $50,607 8 $125,042 6 $66,225 APPLICATIONS WITHDRAWN 13 $153,125 10 $125,243 145 $169,130 3 $113,333 9 $119,960 2 $84,995 FILES CLOSED FOR INCOMPLETENESS 4 $167,382 2 $92,275 27 $166,583 0 $0 1 $206,880 1 $29,350
Aggregated Statistics For Year 2008(Based on 5 partial tracts) A) FHA, FSA/RHS & VA B) Conventional C) Refinancings D) Home Improvement Loans E) Loans on Dwellings For 5+ Families F) Non-occupant Loans on G) Loans On Manufactured Number Average Value Number Average Value Number Average Value Number Average Value Number Average Value Number Average Value Number Average Value
LOANS ORIGINATED 154 $173,966 138 $149,188 318 $158,118 50 $48,989 3 $3,517,913 34 $111,918 16 $46,708 APPLICATIONS APPROVED, NOT ACCEPTED 14 $168,094 15 $141,227 37 $134,592 4 $20,455 0 $0 4 $123,388 5 $43,912 APPLICATIONS DENIED 25 $171,029 34 $118,295 209 $162,145 52 $72,135 0 $0 17 $108,536 14 $42,711 APPLICATIONS WITHDRAWN 22 $166,369 33 $157,179 96 $165,627 8 $66,579 0 $0 8 $175,566 2 $74,000 FILES CLOSED FOR INCOMPLETENESS 2 $155,225 3 $199,413 28 $178,305 2 $30,520 0 $0 2 $142,865 0 $0
Aggregated Statistics For Year 2007(Based on 5 partial tracts) A) FHA, FSA/RHS & VA B) Conventional C) Refinancings D) Home Improvement Loans E) Loans on Dwellings For 5+ Families F) Non-occupant Loans on G) Loans On Manufactured Number Average Value Number Average Value Number Average Value Number Average Value Number Average Value Number Average Value Number Average Value
LOANS ORIGINATED 71 $176,500 352 $155,324 345 $147,068 66 $40,153 1 $4,311,000 71 $103,503 17 $43,901 APPLICATIONS APPROVED, NOT ACCEPTED 7 $195,401 38 $136,827 59 $127,529 12 $56,217 0 $0 8 $103,325 3 $65,207 APPLICATIONS DENIED 12 $196,571 68 $136,721 254 $148,055 67 $82,003 0 $0 17 $112,776 15 $48,821 APPLICATIONS WITHDRAWN 8 $173,250 51 $147,183 124 $158,881 18 $89,890 0 $0 12 $130,666 1 $33,500 FILES CLOSED FOR INCOMPLETENESS 1 $153,530 14 $143,693 42 $181,485 2 $149,940 0 $0 2 $116,210 0 $0
Aggregated Statistics For Year 2006(Based on 5 partial tracts) A) FHA, FSA/RHS & VA B) Conventional C) Refinancings D) Home Improvement Loans F) Non-occupant Loans on G) Loans On Manufactured Number Average Value Number Average Value Number Average Value Number Average Value Number Average Value Number Average Value
LOANS ORIGINATED 89 $174,290 594 $127,839 433 $131,707 84 $49,003 122 $105,580 12 $34,817 APPLICATIONS APPROVED, NOT ACCEPTED 8 $159,071 90 $118,425 78 $144,080 14 $34,974 17 $94,261 7 $54,290 APPLICATIONS DENIED 7 $145,844 123 $110,226 282 $138,101 68 $59,787 25 $81,517 33 $52,555 APPLICATIONS WITHDRAWN 11 $194,953 83 $126,483 180 $140,460 19 $110,144 17 $91,184 2 $68,540 FILES CLOSED FOR INCOMPLETENESS 0 $0 23 $134,260 58 $163,980 3 $83,733 4 $112,605 0 $0
Aggregated Statistics For Year 2005(Based on 5 partial tracts) A) FHA, FSA/RHS & VA B) Conventional C) Refinancings D) Home Improvement Loans E) Loans on Dwellings For 5+ Families F) Non-occupant Loans on G) Loans On Manufactured Number Average Value Number Average Value Number Average Value Number Average Value Number Average Value Number Average Value Number Average Value
LOANS ORIGINATED 87 $155,491 588 $131,397 434 $131,026 78 $47,927 0 $0 121 $93,878 12 $40,601 APPLICATIONS APPROVED, NOT ACCEPTED 6 $157,225 73 $125,638 70 $129,198 14 $29,789 0 $0 14 $82,162 10 $45,682 APPLICATIONS DENIED 6 $118,362 122 $97,880 281 $124,168 55 $43,464 0 $0 18 $93,751 53 $54,656 APPLICATIONS WITHDRAWN 8 $152,052 64 $135,635 148 $141,821 24 $109,100 1 $621,740 13 $104,362 3 $70,737 FILES CLOSED FOR INCOMPLETENESS 0 $0 24 $122,988 92 $143,321 2 $35,365 0 $0 5 $113,648 1 $109,240
Aggregated Statistics For Year 2004(Based on 5 partial tracts) A) FHA, FSA/RHS & VA B) Conventional C) Refinancings D) Home Improvement Loans E) Loans on Dwellings For 5+ Families F) Non-occupant Loans on G) Loans On Manufactured Number Average Value Number Average Value Number Average Value Number Average Value Number Average Value Number Average Value Number Average Value
LOANS ORIGINATED 106 $144,089 513 $133,976 476 $124,838 64 $40,307 0 $0 102 $96,588 16 $50,242 APPLICATIONS APPROVED, NOT ACCEPTED 10 $145,044 55 $111,978 62 $127,176 13 $17,289 0 $0 8 $85,365 12 $43,676 APPLICATIONS DENIED 8 $115,962 114 $106,781 251 $114,576 53 $36,280 1 $113,850 16 $128,593 48 $50,812 APPLICATIONS WITHDRAWN 11 $139,635 43 $125,942 164 $137,294 18 $59,591 0 $0 12 $84,023 4 $59,020 FILES CLOSED FOR INCOMPLETENESS 1 $207,540 12 $154,672 73 $135,951 8 $39,838 0 $0 2 $182,145 0 $0
Aggregated Statistics For Year 2003(Based on 5 partial tracts) A) FHA, FSA/RHS & VA B) Conventional C) Refinancings D) Home Improvement Loans F) Non-occupant Loans on Number Average Value Number Average Value Number Average Value Number Average Value Number Average Value
LOANS ORIGINATED 133 $135,912 376 $132,361 926 $120,771 46 $14,703 89 $91,005 APPLICATIONS APPROVED, NOT ACCEPTED 10 $75,702 62 $86,853 111 $118,854 5 $17,160 5 $74,798 APPLICATIONS DENIED 21 $78,476 175 $64,848 294 $107,529 30 $34,349 10 $74,267 APPLICATIONS WITHDRAWN 9 $136,599 59 $149,874 162 $121,138 4 $19,875 13 $95,368 FILES CLOSED FOR INCOMPLETENESS 3 $84,900 9 $126,479 45 $122,001 6 $32,850 2 $69,960
Aggregated Statistics For Year 2002(Based on 5 partial tracts) A) FHA, FSA/RHS & VA B) Conventional C) Refinancings D) Home Improvement Loans E) Loans on Dwellings For 5+ Families F) Non-occupant Loans on Number Average Value Number Average Value Number Average Value Number Average Value Number Average Value Number Average Value
LOANS ORIGINATED 114 $135,738 355 $127,627 619 $118,134 34 $21,292 1 $84,580 69 $89,062 APPLICATIONS APPROVED, NOT ACCEPTED 3 $144,930 32 $84,012 92 $108,191 5 $37,956 0 $0 5 $115,202 APPLICATIONS DENIED 6 $97,615 81 $79,087 202 $93,683 21 $13,470 0 $0 14 $55,439 APPLICATIONS WITHDRAWN 8 $158,281 42 $143,509 123 $102,301 4 $31,840 0 $0 9 $74,042 FILES CLOSED FOR INCOMPLETENESS 0 $0 16 $136,277 26 $88,961 1 $67,990 0 $0 1 $57,990
Aggregated Statistics For Year 2001(Based on 5 partial tracts) A) FHA, FSA/RHS & VA B) Conventional C) Refinancings D) Home Improvement Loans E) Loans on Dwellings For 5+ Families F) Non-occupant Loans on Number Average Value Number Average Value Number Average Value Number Average Value Number Average Value Number Average Value
LOANS ORIGINATED 162 $124,933 341 $124,984 455 $113,826 58 $15,798 1 $641,110 39 $68,179 APPLICATIONS APPROVED, NOT ACCEPTED 5 $132,842 48 $71,670 59 $89,753 9 $25,867 0 $0 5 $52,230 APPLICATIONS DENIED 5 $138,568 109 $49,599 185 $80,428 32 $13,725 0 $0 6 $36,947 APPLICATIONS WITHDRAWN 13 $124,685 31 $115,778 136 $93,407 8 $14,436 0 $0 3 $68,000 FILES CLOSED FOR INCOMPLETENESS 0 $0 6 $168,880 29 $83,708 1 $14,310 0 $0 0 $0
Aggregated Statistics For Year 2000(Based on 5 partial tracts) A) FHA, FSA/RHS & VA B) Conventional C) Refinancings D) Home Improvement Loans F) Non-occupant Loans on Number Average Value Number Average Value Number Average Value Number Average Value Number Average Value
LOANS ORIGINATED 158 $112,493 327 $108,441 133 $80,026 50 $11,031 42 $83,638 APPLICATIONS APPROVED, NOT ACCEPTED 22 $60,927 59 $66,822 34 $66,909 13 $30,705 4 $53,918 APPLICATIONS DENIED 20 $70,820 167 $59,235 150 $64,465 31 $24,553 10 $49,037 APPLICATIONS WITHDRAWN 14 $107,470 32 $116,748 68 $66,430 6 $22,588 4 $77,390 FILES CLOSED FOR INCOMPLETENESS 1 $87,460 7 $90,904 11 $83,945 1 $32,410 1 $23,120
Aggregated Statistics For Year 1999(Based on 5 partial tracts) A) FHA, FSA/RHS & VA B) Conventional C) Refinancings D) Home Improvement Loans F) Non-occupant Loans on Number Average Value Number Average Value Number Average Value Number Average Value Number Average Value
LOANS ORIGINATED 128 $100,586 295 $101,620 176 $84,901 40 $14,953 32 $67,080 APPLICATIONS APPROVED, NOT ACCEPTED 5 $98,174 56 $61,579 62 $62,494 14 $16,014 6 $72,187 APPLICATIONS DENIED 10 $94,672 203 $52,105 147 $62,928 27 $18,412 11 $58,975 APPLICATIONS WITHDRAWN 16 $102,291 21 $96,926 74 $66,952 3 $23,613 5 $67,934 FILES CLOSED FOR INCOMPLETENESS 1 $53,090 6 $68,227 29 $64,139 4 $21,545 1 $28,010
Detailed HMDA statistics for the following Tracts:
0207.03
, 0207.05 , 0207.06 , 0208.02 , 0208.03
Private Mortgage Insurance Companies Aggregated Statistics For Year 2008(Based on 4 partial tracts) A) Conventional B) Refinancings C) Non-occupant Loans on Number Average Value Number Average Value Number Average Value
LOANS ORIGINATED 47 $160,737 35 $182,533 6 $125,227 APPLICATIONS APPROVED, NOT ACCEPTED 16 $209,795 11 $171,497 3 $163,933 APPLICATIONS DENIED 6 $135,643 3 $173,317 1 $137,800 APPLICATIONS WITHDRAWN 2 $155,060 3 $250,213 1 $124,190 FILES CLOSED FOR INCOMPLETENESS 0 $0 1 $97,730 0 $0
Aggregated Statistics For Year 2007(Based on 5 partial tracts) A) Conventional B) Refinancings C) Non-occupant Loans on Number Average Value Number Average Value Number Average Value
LOANS ORIGINATED 124 $174,691 52 $178,319 5 $117,628 APPLICATIONS APPROVED, NOT ACCEPTED 15 $169,065 12 $224,776 1 $74,910 APPLICATIONS DENIED 2 $151,860 1 $139,060 0 $0 APPLICATIONS WITHDRAWN 6 $202,452 5 $157,170 1 $135,160 FILES CLOSED FOR INCOMPLETENESS 1 $129,060 0 $0 1 $129,060
Aggregated Statistics For Year 2006(Based on 4 partial tracts) A) Conventional B) Refinancings C) Non-occupant Loans on Number Average Value Number Average Value Number Average Value
LOANS ORIGINATED 93 $164,409 41 $171,901 9 $107,764 APPLICATIONS APPROVED, NOT ACCEPTED 12 $155,861 8 $167,195 1 $117,930 APPLICATIONS DENIED 1 $52,160 0 $0 0 $0 APPLICATIONS WITHDRAWN 3 $124,747 3 $130,937 0 $0 FILES CLOSED FOR INCOMPLETENESS 0 $0 0 $0 0 $0
Aggregated Statistics For Year 2005(Based on 4 partial tracts) A) Conventional B) Refinancings C) Non-occupant Loans on Number Average Value Number Average Value Number Average Value
LOANS ORIGINATED 123 $161,625 55 $158,256 19 $110,368 APPLICATIONS APPROVED, NOT ACCEPTED 7 $192,359 9 $172,820 1 $81,490 APPLICATIONS DENIED 4 $149,795 0 $0 1 $150,240 APPLICATIONS WITHDRAWN 7 $155,661 2 $115,670 2 $81,470 FILES CLOSED FOR INCOMPLETENESS 1 $90,120 0 $0 0 $0
Aggregated Statistics For Year 2004(Based on 4 partial tracts) A) Conventional B) Refinancings C) Non-occupant Loans on D) Loans On Manufactured Number Average Value Number Average Value Number Average Value Number Average Value
LOANS ORIGINATED 118 $147,463 52 $129,246 22 $101,792 2 $81,095 APPLICATIONS APPROVED, NOT ACCEPTED 14 $169,480 24 $140,399 1 $39,550 0 $0 APPLICATIONS DENIED 1 $56,650 0 $0 0 $0 0 $0 APPLICATIONS WITHDRAWN 6 $129,625 6 $161,627 1 $31,620 0 $0 FILES CLOSED FOR INCOMPLETENESS 0 $0 0 $0 0 $0 0 $0
Aggregated Statistics For Year 2003(Based on 5 partial tracts) A) Conventional B) Refinancings C) Non-occupant Loans on Number Average Value Number Average Value Number Average Value
LOANS ORIGINATED 150 $146,400 185 $142,782 22 $95,033 APPLICATIONS APPROVED, NOT ACCEPTED 17 $165,174 44 $141,007 3 $83,107 APPLICATIONS DENIED 1 $142,570 2 $141,130 0 $0 APPLICATIONS WITHDRAWN 9 $157,352 11 $182,368 1 $102,740 FILES CLOSED FOR INCOMPLETENESS 1 $111,230 1 $128,650 0 $0
Aggregated Statistics For Year 2002(Based on 4 partial tracts) A) Conventional B) Refinancings C) Non-occupant Loans on Number Average Value Number Average Value Number Average Value
LOANS ORIGINATED 151 $146,916 115 $134,535 11 $90,609 APPLICATIONS APPROVED, NOT ACCEPTED 12 $160,271 25 $123,663 1 $42,760 APPLICATIONS DENIED 1 $142,940 2 $138,690 0 $0 APPLICATIONS WITHDRAWN 13 $166,189 6 $107,170 1 $169,150 FILES CLOSED FOR INCOMPLETENESS 1 $211,020 1 $154,200 0 $0
Aggregated Statistics For Year 2001(Based on 5 partial tracts) A) Conventional B) Refinancings C) Non-occupant Loans on Number Average Value Number Average Value Number Average Value
LOANS ORIGINATED 136 $147,855 89 $132,989 7 $82,766 APPLICATIONS APPROVED, NOT ACCEPTED 15 $174,656 12 $119,263 3 $212,413 APPLICATIONS DENIED 1 $231,540 5 $112,262 1 $198,820 APPLICATIONS WITHDRAWN 0 $0 5 $110,044 0 $0 FILES CLOSED FOR INCOMPLETENESS 0 $0 0 $0 0 $0
Aggregated Statistics For Year 2000(Based on 5 partial tracts) A) Conventional B) Refinancings C) Non-occupant Loans on Number Average Value Number Average Value Number Average Value
LOANS ORIGINATED 134 $137,331 10 $98,968 9 $97,056 APPLICATIONS APPROVED, NOT ACCEPTED 7 $197,210 1 $117,830 1 $500,960 APPLICATIONS DENIED 2 $205,455 0 $0 0 $0 APPLICATIONS WITHDRAWN 5 $140,056 0 $0 0 $0 FILES CLOSED FOR INCOMPLETENESS 1 $94,180 0 $0 0 $0
Aggregated Statistics For Year 1999(Based on 4 partial tracts) A) Conventional B) Refinancings C) Non-occupant Loans on Number Average Value Number Average Value Number Average Value
LOANS ORIGINATED 114 $124,556 24 $103,066 6 $76,460 APPLICATIONS APPROVED, NOT ACCEPTED 12 $129,585 3 $102,960 1 $140,440 APPLICATIONS DENIED 2 $122,815 1 $162,480 1 $21,130 APPLICATIONS WITHDRAWN 2 $138,940 2 $97,155 0 $0 FILES CLOSED FOR INCOMPLETENESS 1 $30,180 0 $0 0 $0
Detailed PMIC statistics for the following Tracts:
0207.03
, 0207.05 , 0207.06 , 0208.02 , 0208.03 Fire-safe hotels and motels in Goose Creek, South Carolina:
Quality Inn, 103 Redbank Rd, Goose Creek, South Carolina 29445 Phone: (843) 572-9500, Fax: (803) 553-2827
Econo Lodge, 401 Goose Creek Blvd, Goose Creek, South Carolina 29445 Phone: (843) 797-8200, Fax: (843) 797-6639
All 2 fire-safe hotels and motels in Goose Creek, South Carolina
Most common first names in Goose Creek, SC among deceased individuals Name Count Lived (average)
James 102 68.2 years John 88 69.0 years Robert 83 65.1 years William 73 70.3 years Mary 69 70.9 years Charles 45 70.1 years Dorothy 33 74.4 years George 32 70.0 years Joseph 31 69.9 years Elizabeth 28 74.2 years
Most common last names in Goose Creek, SC among deceased individuals Last name Count Lived (average)
Smith 34 68.9 years Brown 29 69.5 years Johnson 29 67.1 years Williams 28 73.3 years Wilson 22 66.2 years Davis 21 68.4 years Jones 18 68.8 years Robinson 18 66.9 years Morris 15 65.7 years Martin 14 71.0 years
Goose Creek compared to South Carolina state average:
Unemployed percentage significantly below state average. Hispanic race population percentage above state average. Median age below state average. Foreign-born population percentage above state average. Length of stay since moving in significantly above state average. House age below state average. Goose Creek on our top lists :
#43 on the list of "Top 101 cities with the largest percentage of people in military transient quarters for temporary residents (population 1,000+)"
#65 on the list of "Top 101 cities with the largest percentage of people in military barracks, etc. (population 1,000+)"
#94 on the list of "Top 101 cities with the most people walking to work (population 5,000+)"
#23 on the list of "Top 101 counties with the highest percentage of residents relocating from other counties between 2010 and 2011 (pop. 50,000+)"
#38 on the list of "Top 101 counties with the lowest percentage of residents that visited a dentist within the past year"
#38 on the list of "Top 101 counties with the highest average weight of females"
#42 on the list of "Top 101 counties with the smallest number of people without health insurance coverage in 2000 (pop. 50,000+)"
#43 on the list of "Top 101 counties with the highest percentage of residents relocating to other counties in 2011 (pop. 50,000+)"
Top Patent Applicants
Brian Thompson (4)
Jeffrey R. Welling (4)
Dennis Flessate (3)
Mark E. Jansen (2)
Mark Rutter (2)
Jane Dobbins (2)
Thomas E. Borders (2)
John Murphy (2)
Andrew T. Bickford (2)
Edward R. Barnes, Jr. (2)
Total of 57 patent applications in 2008-2024.


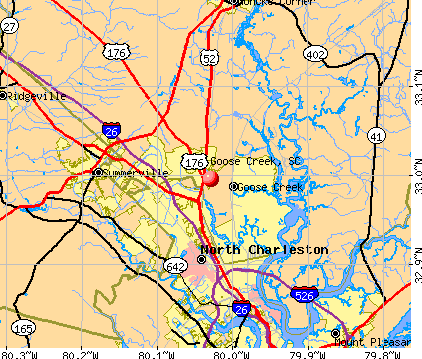


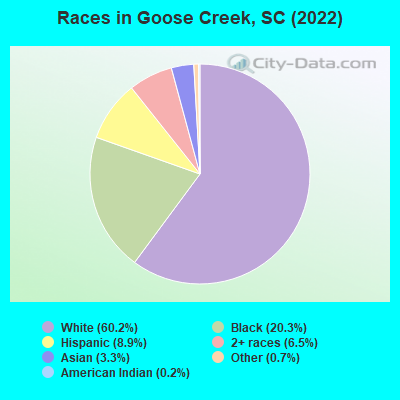
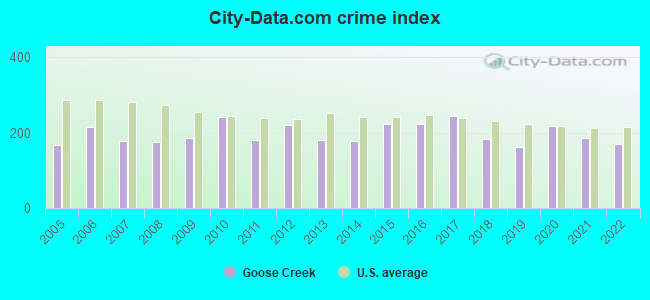
 Recent articles from our blog. Our writers, many of them Ph.D. graduates or candidates, create easy-to-read articles on a wide variety of topics.

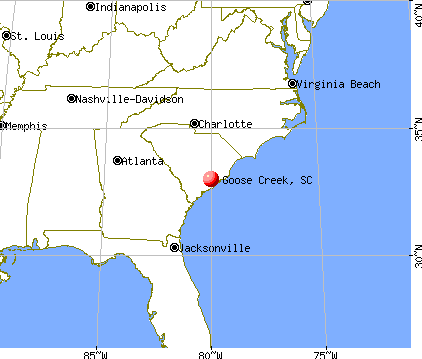
 (7.7 miles
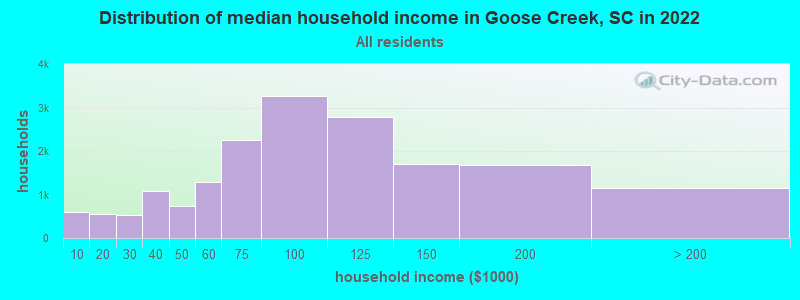
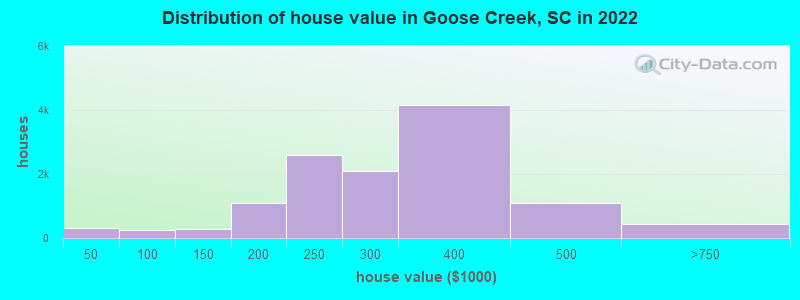
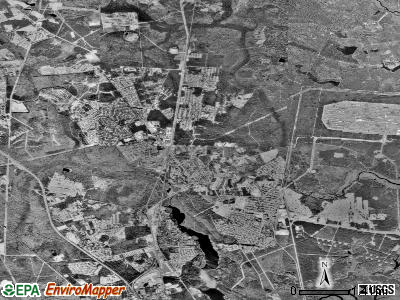
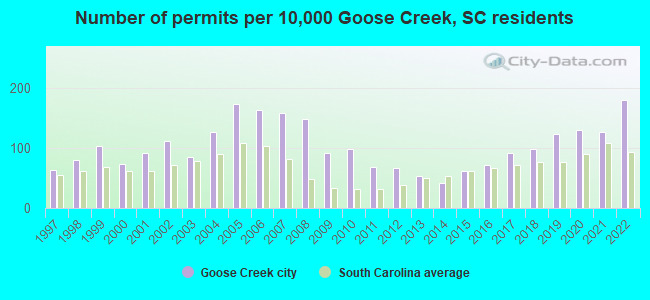
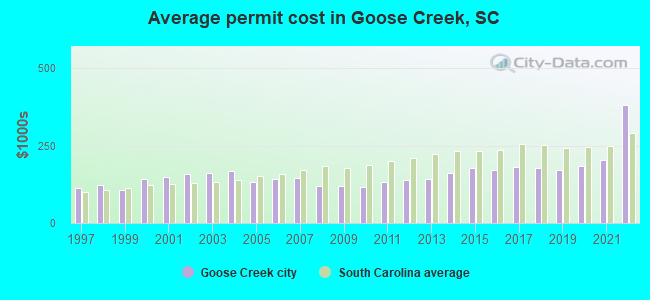
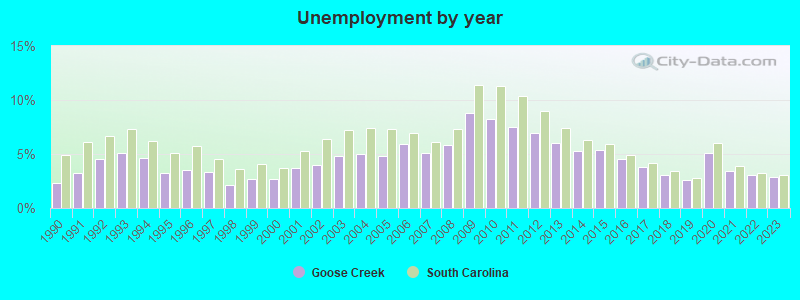


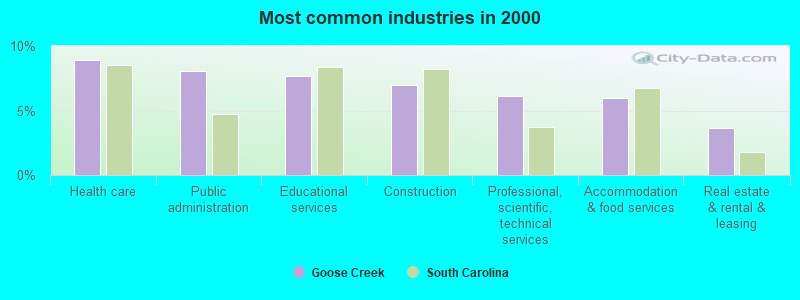
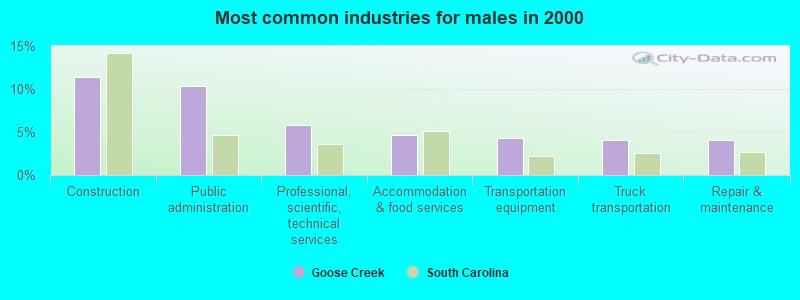
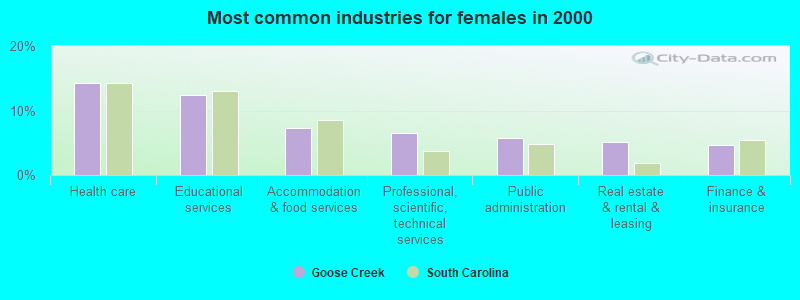
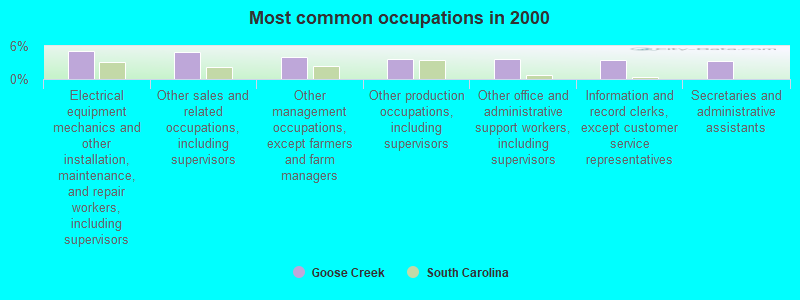
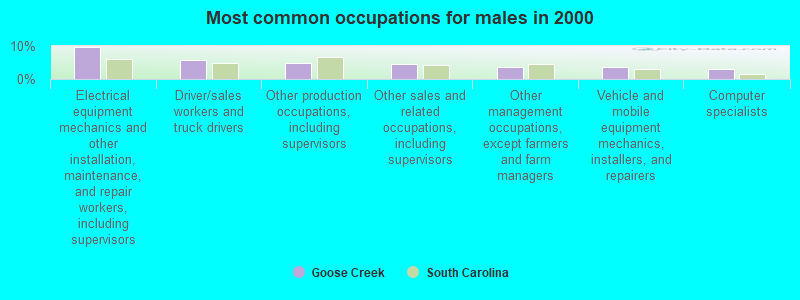
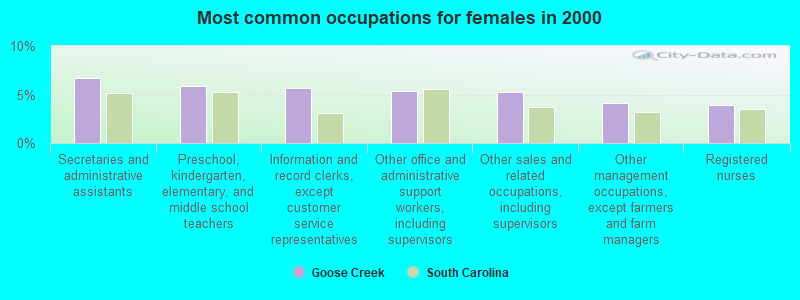
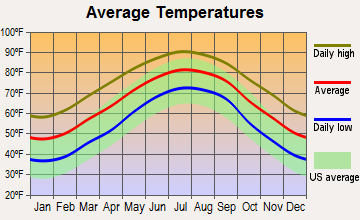
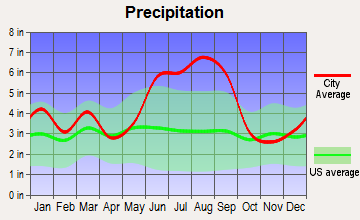
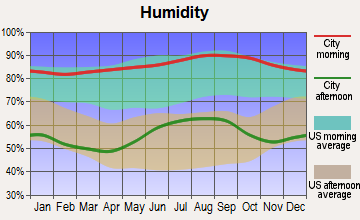
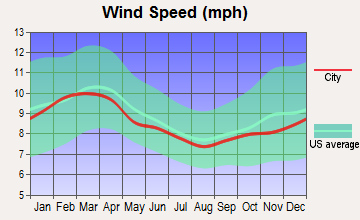
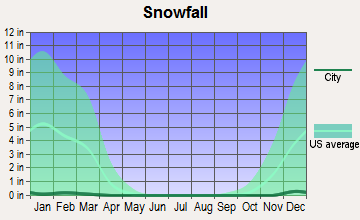
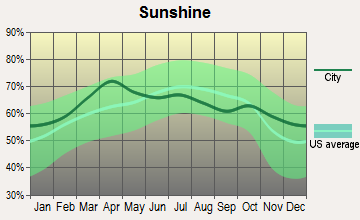
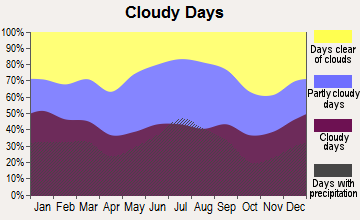
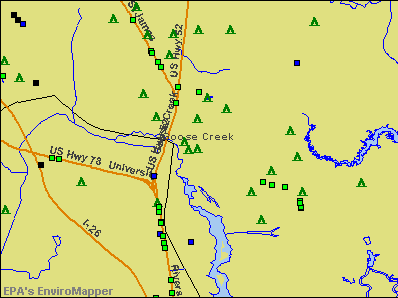

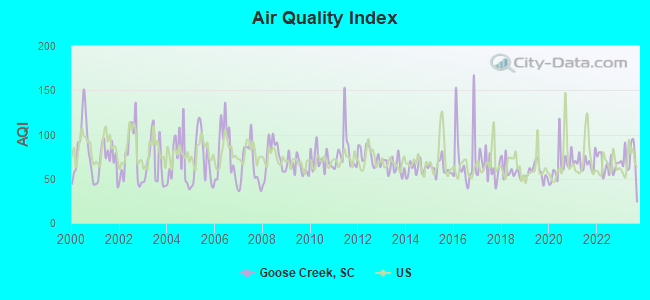
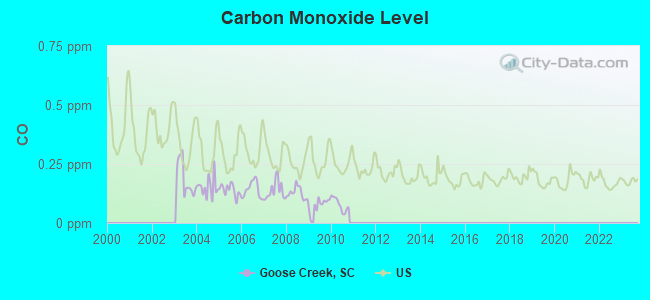

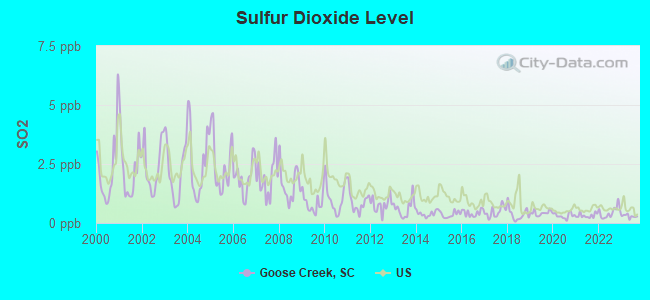
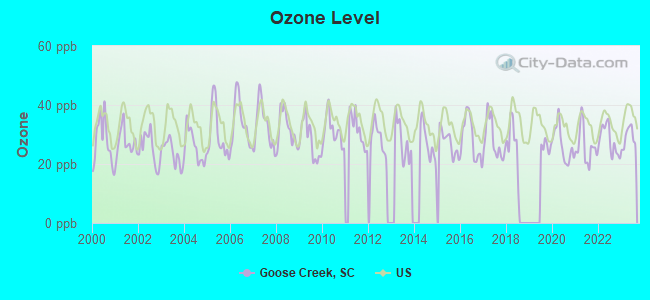
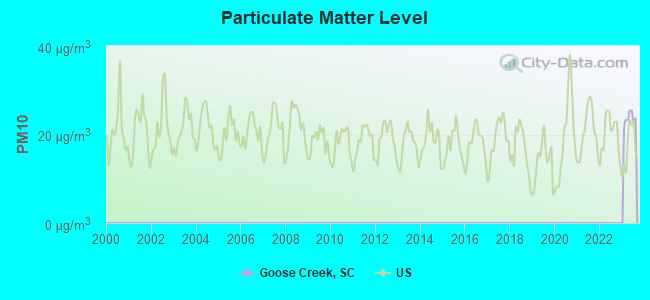
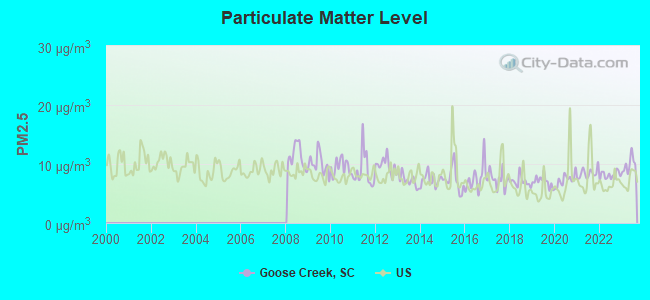
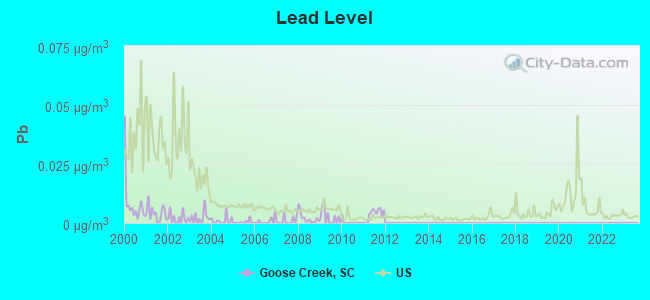

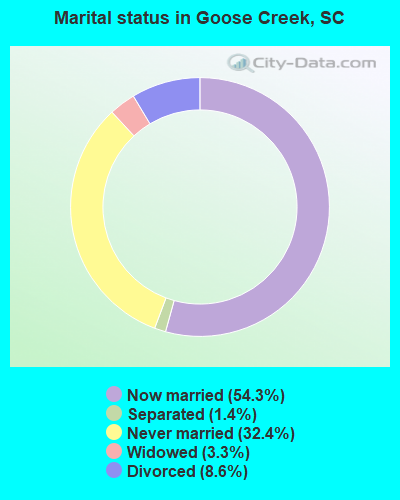
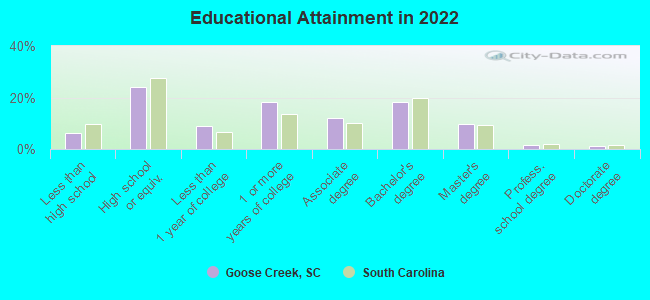
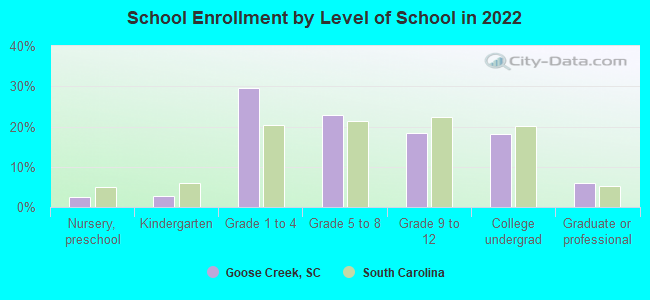
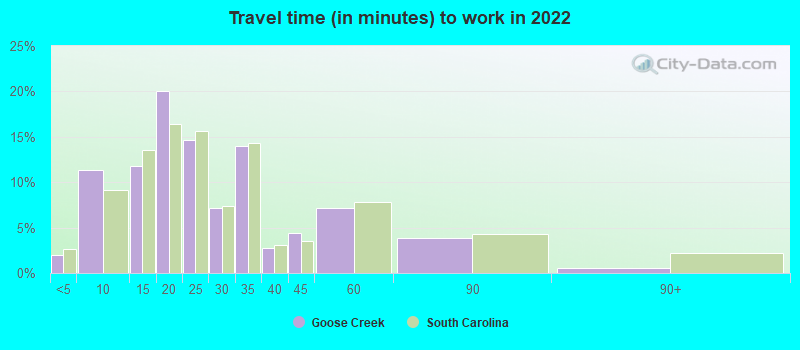

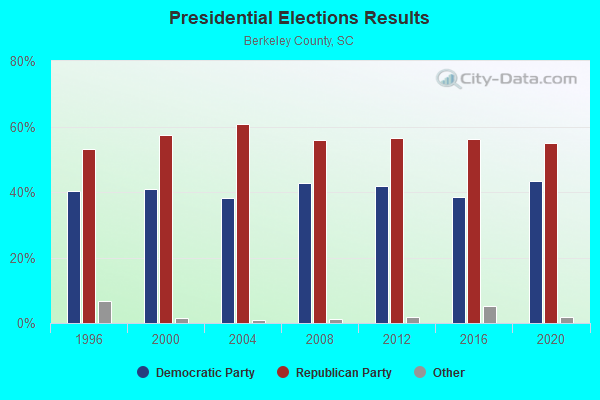
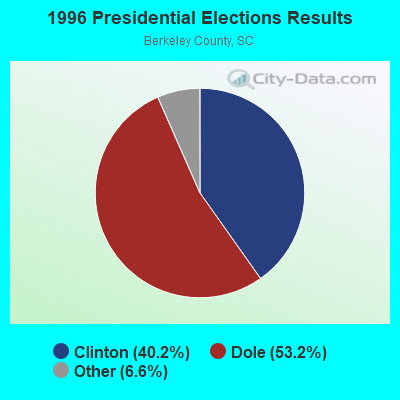
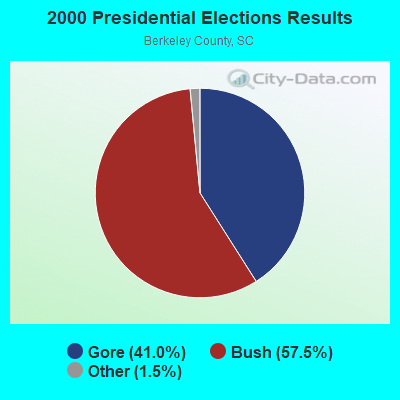
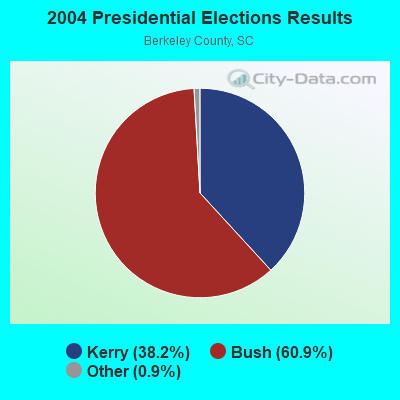
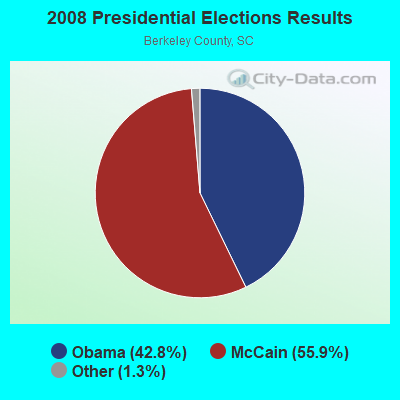
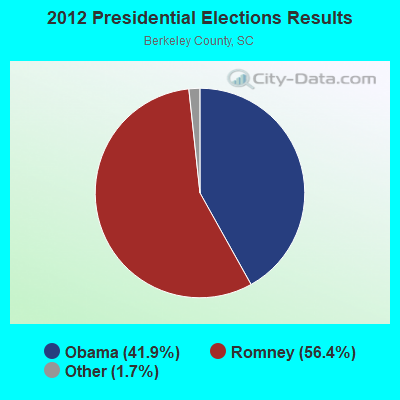
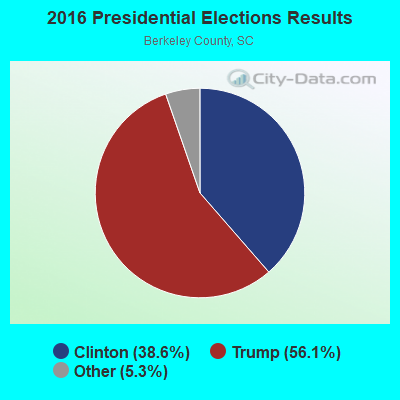
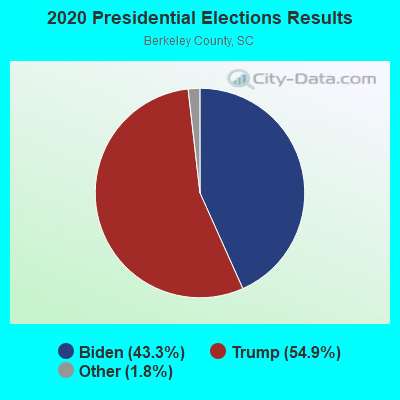
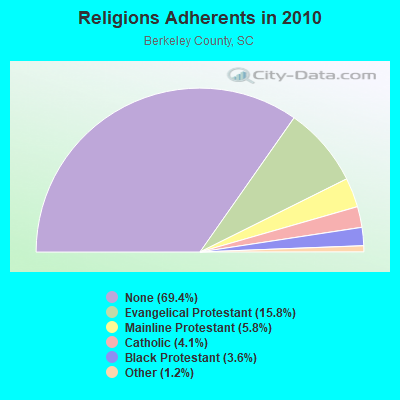
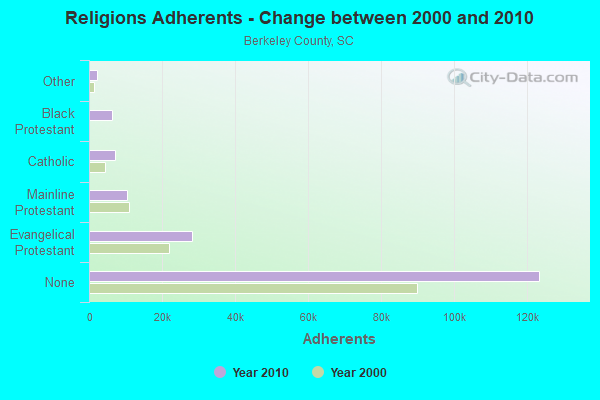
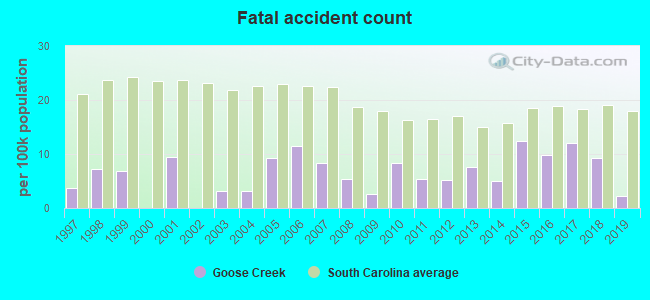
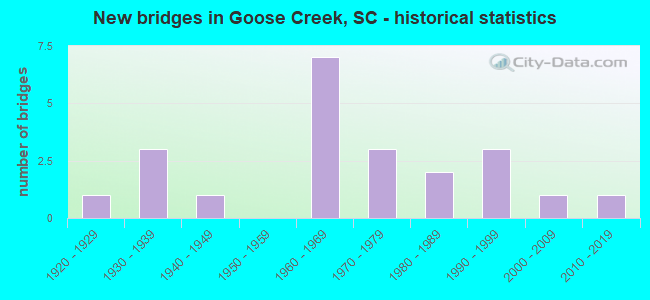
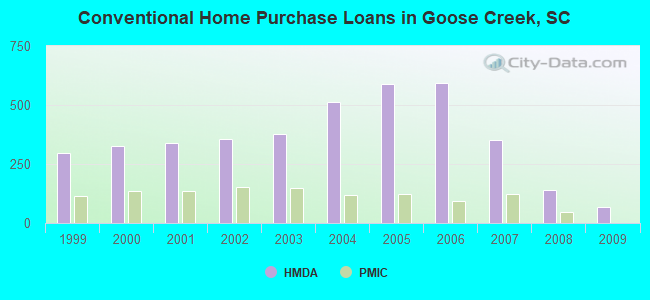
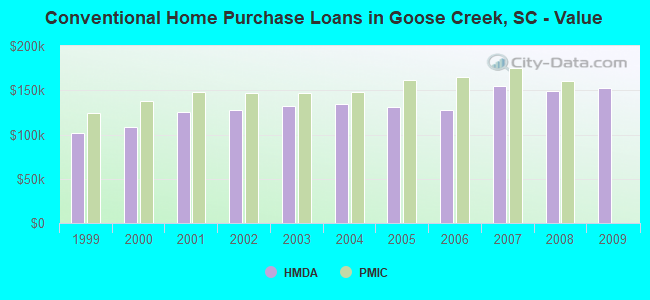
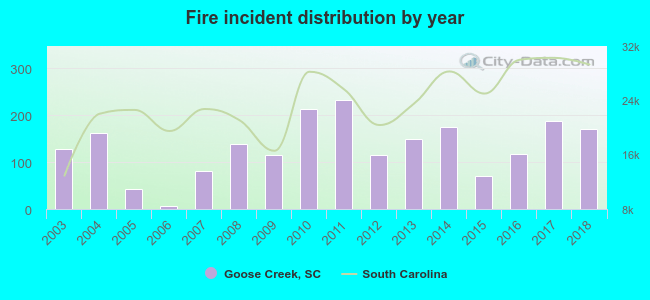 Based on the data from the years 2003 - 2018 the average number of fires per year is 132. The highest number of fires - 232 took place in 2011, and the least - 6 in 2006. The data has a rising trend.
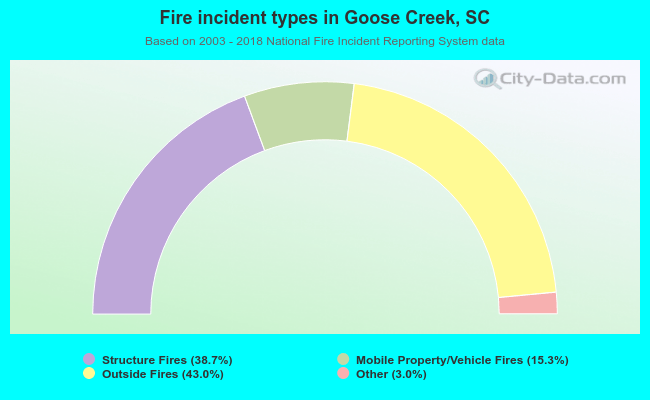 When looking into fire subcategories, the most incidents belonged to: Outside Fires (43.0%), and Structure Fires (38.7%).