Ladson, South Carolina Submit your own pictures of this place and show them to the world
OSM Map
General Map
Google Map
MSN Map
OSM Map
General Map
Google Map
MSN Map
OSM Map
General Map
Google Map
MSN Map
OSM Map
General Map
Google Map
MSN Map
Please wait while loading the map...
Population in 2010: 13,790. Population change since 2000: +4.0%Males: 7,322 Females: 6,468
March 2022 cost of living index in Ladson: 91.9 (less than average, U.S. average is 100) Percentage of residents living in poverty in 2022: 13.0%for White Non-Hispanic residents , 11.8% for Black residents , 19.7% for Hispanic or Latino residents , 24.7% for other race residents , 25.7% for two or more races residents )
Profiles of local businesses
Business Search - 14 Million verified businesses
Data:
Median household income ($)
Median household income (% change since 2000)
Household income diversity
Ratio of average income to average house value (%)
Ratio of average income to average rent
Median household income ($) - White
Median household income ($) - Black or African American
Median household income ($) - Asian
Median household income ($) - Hispanic or Latino
Median household income ($) - American Indian and Alaska Native
Median household income ($) - Multirace
Median household income ($) - Other Race
Median household income for houses/condos with a mortgage ($)
Median household income for apartments without a mortgage ($)
Races - White alone (%)
Races - White alone (% change since 2000)
Races - Black alone (%)
Races - Black alone (% change since 2000)
Races - American Indian alone (%)
Races - American Indian alone (% change since 2000)
Races - Asian alone (%)
Races - Asian alone (% change since 2000)
Races - Hispanic (%)
Races - Hispanic (% change since 2000)
Races - Native Hawaiian and Other Pacific Islander alone (%)
Races - Native Hawaiian and Other Pacific Islander alone (% change since 2000)
Races - Two or more races (%)
Races - Two or more races (% change since 2000)
Races - Other race alone (%)
Races - Other race alone (% change since 2000)
Racial diversity
Unemployment (%)
Unemployment (% change since 2000)
Unemployment (%) - White
Unemployment (%) - Black or African American
Unemployment (%) - Asian
Unemployment (%) - Hispanic or Latino
Unemployment (%) - American Indian and Alaska Native
Unemployment (%) - Multirace
Unemployment (%) - Other Race
Population density (people per square mile)
Population - Males (%)
Population - Females (%)
Population - Males (%) - White
Population - Males (%) - Black or African American
Population - Males (%) - Asian
Population - Males (%) - Hispanic or Latino
Population - Males (%) - American Indian and Alaska Native
Population - Males (%) - Multirace
Population - Males (%) - Other Race
Population - Females (%) - White
Population - Females (%) - Black or African American
Population - Females (%) - Asian
Population - Females (%) - Hispanic or Latino
Population - Females (%) - American Indian and Alaska Native
Population - Females (%) - Multirace
Population - Females (%) - Other Race
Coronavirus confirmed cases (Apr 27, 2024)
Deaths caused by coronavirus (Apr 27, 2024)
Coronavirus confirmed cases (per 100k population) (Apr 27, 2024)
Deaths caused by coronavirus (per 100k population) (Apr 27, 2024)
Daily increase in number of cases (Apr 27, 2024)
Weekly increase in number of cases (Apr 27, 2024)
Cases doubled (in days) (Apr 27, 2024)
Hospitalized patients (Apr 18, 2022)
Negative test results (Apr 18, 2022)
Total test results (Apr 18, 2022)
COVID Vaccine doses distributed (per 100k population) (Sep 19, 2023)
COVID Vaccine doses administered (per 100k population) (Sep 19, 2023)
COVID Vaccine doses distributed (Sep 19, 2023)
COVID Vaccine doses administered (Sep 19, 2023)
Likely homosexual households (%)
Likely homosexual households (% change since 2000)
Likely homosexual households - Lesbian couples (%)
Likely homosexual households - Lesbian couples (% change since 2000)
Likely homosexual households - Gay men (%)
Likely homosexual households - Gay men (% change since 2000)
Cost of living index
Median gross rent ($)
Median contract rent ($)
Median monthly housing costs ($)
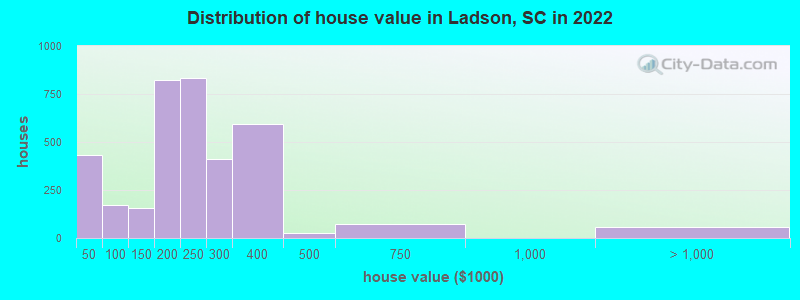
Median house or condo value ($)
Median house or condo value ($ change since 2000)
Mean house or condo value by units in structure - 1, detached ($)
Mean house or condo value by units in structure - 1, attached ($)
Mean house or condo value by units in structure - 2 ($)
Mean house or condo value by units in structure by units in structure - 3 or 4 ($)
Mean house or condo value by units in structure - 5 or more ($)
Mean house or condo value by units in structure - Boat, RV, van, etc. ($)
Mean house or condo value by units in structure - Mobile home ($)
Median house or condo value ($) - White
Median house or condo value ($) - Black or African American
Median house or condo value ($) - Asian
Median house or condo value ($) - Hispanic or Latino
Median house or condo value ($) - American Indian and Alaska Native
Median house or condo value ($) - Multirace
Median house or condo value ($) - Other Race
Median resident age
Resident age diversity
Median resident age - Males
Median resident age - Females
Median resident age - White
Median resident age - Black or African American
Median resident age - Asian
Median resident age - Hispanic or Latino
Median resident age - American Indian and Alaska Native
Median resident age - Multirace
Median resident age - Other Race
Median resident age - Males - White
Median resident age - Males - Black or African American
Median resident age - Males - Asian
Median resident age - Males - Hispanic or Latino
Median resident age - Males - American Indian and Alaska Native
Median resident age - Males - Multirace
Median resident age - Males - Other Race
Median resident age - Females - White
Median resident age - Females - Black or African American
Median resident age - Females - Asian
Median resident age - Females - Hispanic or Latino
Median resident age - Females - American Indian and Alaska Native
Median resident age - Females - Multirace
Median resident age - Females - Other Race
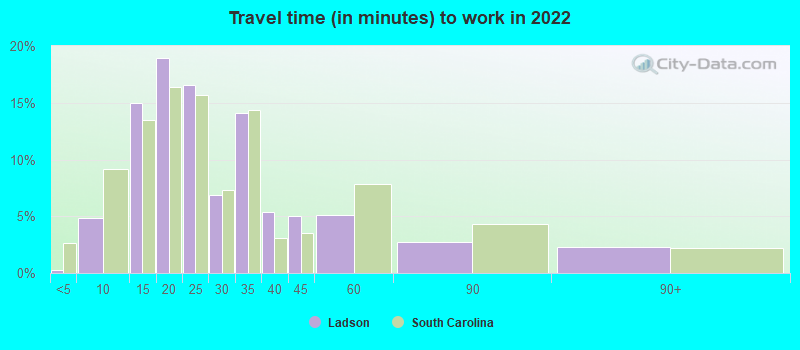
Commute - mean travel time to work (minutes)
Travel time to work - Less than 5 minutes (%)
Travel time to work - Less than 5 minutes (% change since 2000)
Travel time to work - 5 to 9 minutes (%)
Travel time to work - 5 to 9 minutes (% change since 2000)
Travel time to work - 10 to 19 minutes (%)
Travel time to work - 10 to 19 minutes (% change since 2000)
Travel time to work - 20 to 29 minutes (%)
Travel time to work - 20 to 29 minutes (% change since 2000)
Travel time to work - 30 to 39 minutes (%)
Travel time to work - 30 to 39 minutes (% change since 2000)
Travel time to work - 40 to 59 minutes (%)
Travel time to work - 40 to 59 minutes (% change since 2000)
Travel time to work - 60 to 89 minutes (%)
Travel time to work - 60 to 89 minutes (% change since 2000)
Travel time to work - 90 or more minutes (%)
Travel time to work - 90 or more minutes (% change since 2000)
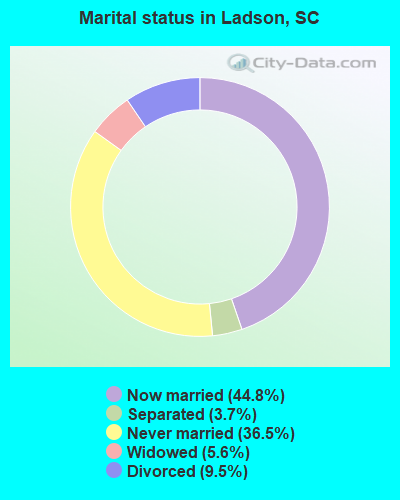
Marital status - Never married (%)
Marital status - Now married (%)
Marital status - Separated (%)
Marital status - Widowed (%)
Marital status - Divorced (%)
Median family income ($)
Median family income (% change since 2000)
Median non-family income ($)
Median non-family income (% change since 2000)
Median per capita income ($)
Median per capita income (% change since 2000)
Median family income ($) - White
Median family income ($) - Black or African American
Median family income ($) - Asian
Median family income ($) - Hispanic or Latino
Median family income ($) - American Indian and Alaska Native
Median family income ($) - Multirace
Median family income ($) - Other Race
Median year house/condo built
Median year apartment built
Year house built - Built 2005 or later (%)
Year house built - Built 2000 to 2004 (%)
Year house built - Built 1990 to 1999 (%)
Year house built - Built 1980 to 1989 (%)
Year house built - Built 1970 to 1979 (%)
Year house built - Built 1960 to 1969 (%)
Year house built - Built 1950 to 1959 (%)
Year house built - Built 1940 to 1949 (%)
Year house built - Built 1939 or earlier (%)
Average household size
Household density (households per square mile)
Average household size - White
Average household size - Black or African American
Average household size - Asian
Average household size - Hispanic or Latino
Average household size - American Indian and Alaska Native
Average household size - Multirace
Average household size - Other Race
Occupied housing units (%)
Vacant housing units (%)
Owner occupied housing units (%)
Renter occupied housing units (%)
Vacancy status - For rent (%)
Vacancy status - For sale only (%)
Vacancy status - Rented or sold, not occupied (%)
Vacancy status - For seasonal, recreational, or occasional use (%)
Vacancy status - For migrant workers (%)
Vacancy status - Other vacant (%)
Residents with income below the poverty level (%)
Residents with income below 50% of the poverty level (%)
Children below poverty level (%)
Poor families by family type - Married-couple family (%)
Poor families by family type - Male, no wife present (%)
Poor families by family type - Female, no husband present (%)
Poverty status for native-born residents (%)
Poverty status for foreign-born residents (%)
Poverty among high school graduates not in families (%)
Poverty among people who did not graduate high school not in families (%)
Residents with income below the poverty level (%) - White
Residents with income below the poverty level (%) - Black or African American
Residents with income below the poverty level (%) - Asian
Residents with income below the poverty level (%) - Hispanic or Latino
Residents with income below the poverty level (%) - American Indian and Alaska Native
Residents with income below the poverty level (%) - Multirace
Residents with income below the poverty level (%) - Other Race
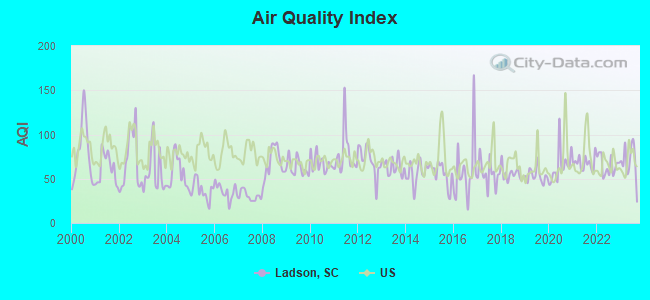
Air pollution - Air Quality Index (AQI)
Air pollution - CO
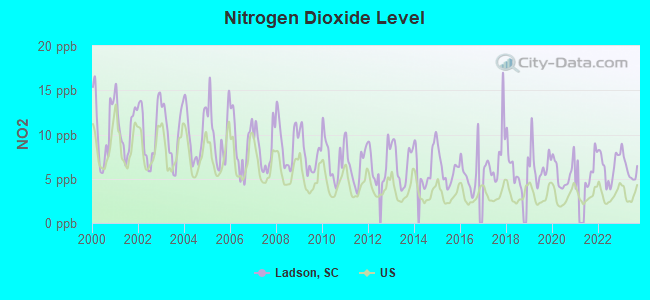
Air pollution - NO2
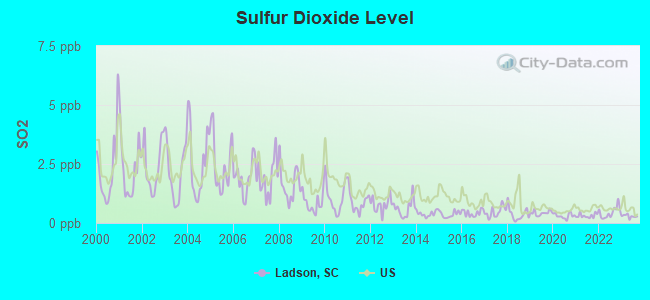
Air pollution - SO2
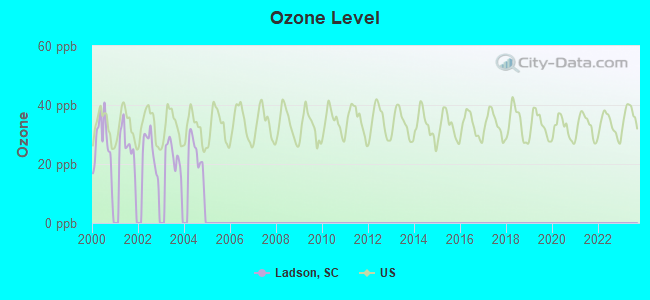
Air pollution - Ozone
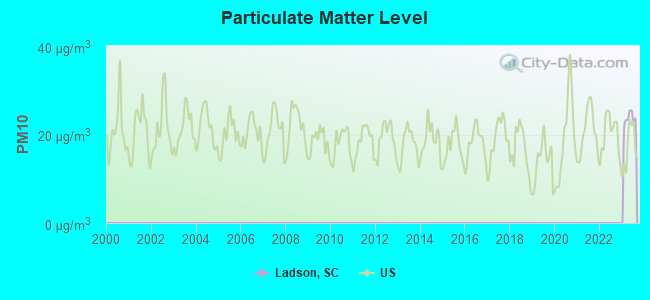
Air pollution - PM10
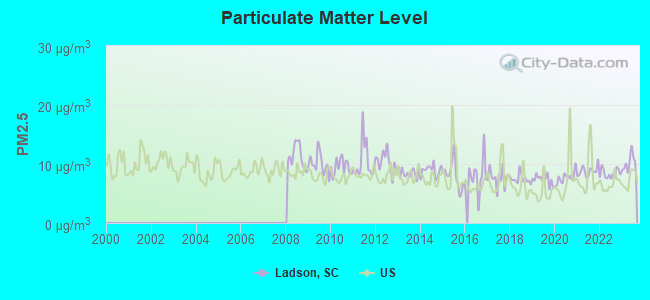
Air pollution - PM25
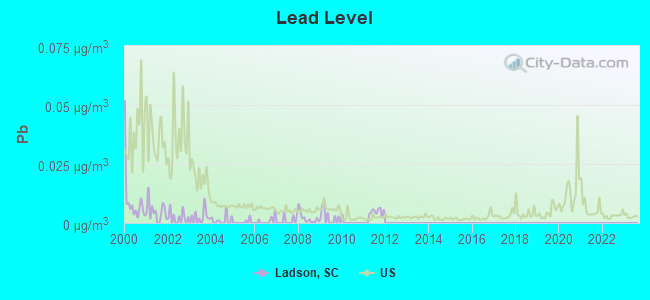
Air pollution - Pb
Crime - Murders per 100,000 population
Crime - Rapes per 100,000 population
Crime - Robberies per 100,000 population
Crime - Assaults per 100,000 population
Crime - Burglaries per 100,000 population
Crime - Thefts per 100,000 population
Crime - Auto thefts per 100,000 population
Crime - Arson per 100,000 population
Crime - City-data.com crime index
Crime - Violent crime index
Crime - Property crime index
Crime - Murders per 100,000 population (5 year average)
Crime - Rapes per 100,000 population (5 year average)
Crime - Robberies per 100,000 population (5 year average)
Crime - Assaults per 100,000 population (5 year average)
Crime - Burglaries per 100,000 population (5 year average)
Crime - Thefts per 100,000 population (5 year average)
Crime - Auto thefts per 100,000 population (5 year average)
Crime - Arson per 100,000 population (5 year average)
Crime - City-data.com crime index (5 year average)
Crime - Violent crime index (5 year average)
Crime - Property crime index (5 year average)
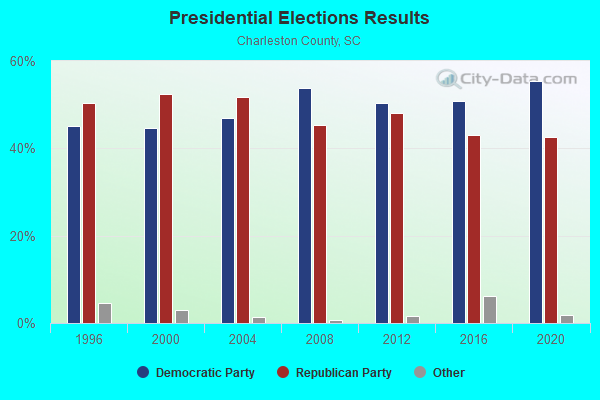
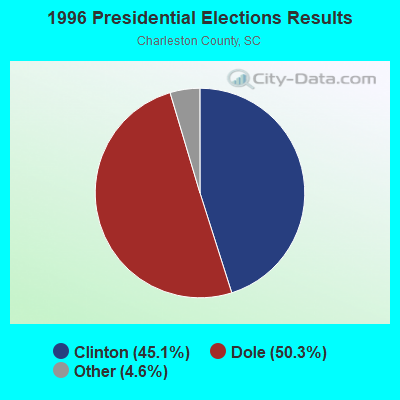
1996 Presidential Elections Results (%) - Democratic Party (Clinton)
1996 Presidential Elections Results (%) - Republican Party (Dole)
1996 Presidential Elections Results (%) - Other
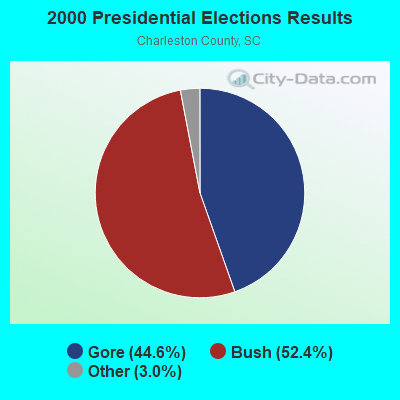
2000 Presidential Elections Results (%) - Democratic Party (Gore)
2000 Presidential Elections Results (%) - Republican Party (Bush)
2000 Presidential Elections Results (%) - Other
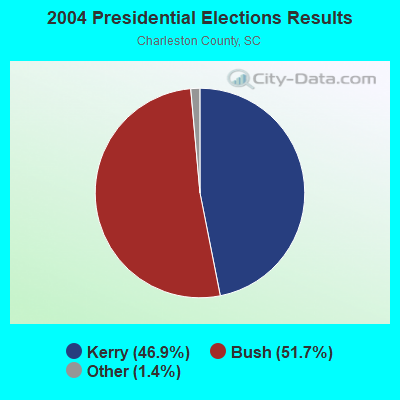
2004 Presidential Elections Results (%) - Democratic Party (Kerry)
2004 Presidential Elections Results (%) - Republican Party (Bush)
2004 Presidential Elections Results (%) - Other
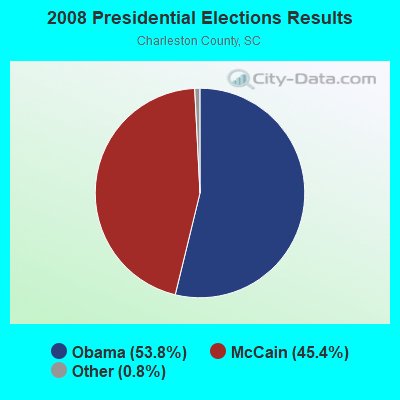
2008 Presidential Elections Results (%) - Democratic Party (Obama)
2008 Presidential Elections Results (%) - Republican Party (McCain)
2008 Presidential Elections Results (%) - Other
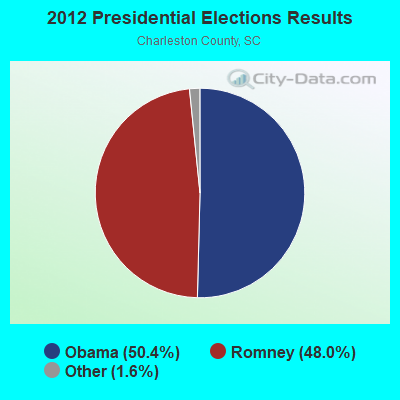
2012 Presidential Elections Results (%) - Democratic Party (Obama)
2012 Presidential Elections Results (%) - Republican Party (Romney)
2012 Presidential Elections Results (%) - Other
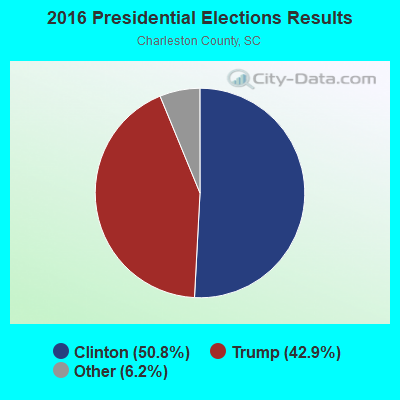
2016 Presidential Elections Results (%) - Democratic Party (Clinton)
2016 Presidential Elections Results (%) - Republican Party (Trump)
2016 Presidential Elections Results (%) - Other
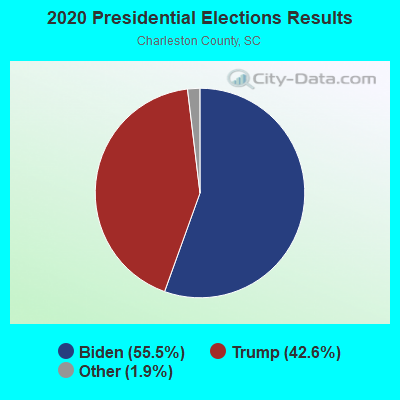
2020 Presidential Elections Results (%) - Democratic Party (Biden)
2020 Presidential Elections Results (%) - Republican Party (Trump)
2020 Presidential Elections Results (%) - Other
Ancestries Reported - Arab (%)
Ancestries Reported - Czech (%)
Ancestries Reported - Danish (%)
Ancestries Reported - Dutch (%)
Ancestries Reported - English (%)
Ancestries Reported - French (%)
Ancestries Reported - French Canadian (%)
Ancestries Reported - German (%)
Ancestries Reported - Greek (%)
Ancestries Reported - Hungarian (%)
Ancestries Reported - Irish (%)
Ancestries Reported - Italian (%)
Ancestries Reported - Lithuanian (%)
Ancestries Reported - Norwegian (%)
Ancestries Reported - Polish (%)
Ancestries Reported - Portuguese (%)
Ancestries Reported - Russian (%)
Ancestries Reported - Scotch-Irish (%)
Ancestries Reported - Scottish (%)
Ancestries Reported - Slovak (%)
Ancestries Reported - Subsaharan African (%)
Ancestries Reported - Swedish (%)
Ancestries Reported - Swiss (%)
Ancestries Reported - Ukrainian (%)
Ancestries Reported - United States (%)
Ancestries Reported - Welsh (%)
Ancestries Reported - West Indian (%)
Ancestries Reported - Other (%)
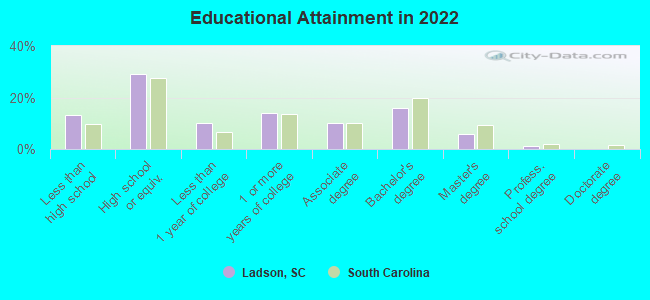
Educational Attainment - No schooling completed (%)
Educational Attainment - Less than high school (%)
Educational Attainment - High school or equivalent (%)
Educational Attainment - Less than 1 year of college (%)
Educational Attainment - 1 or more years of college (%)
Educational Attainment - Associate degree (%)
Educational Attainment - Bachelor's degree (%)
Educational Attainment - Master's degree (%)
Educational Attainment - Professional school degree (%)
Educational Attainment - Doctorate degree (%)
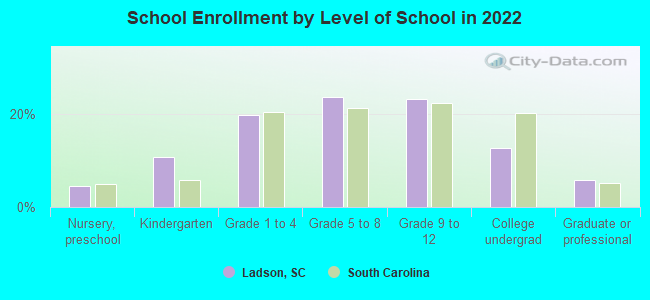
School Enrollment - Nursery, preschool (%)
School Enrollment - Kindergarten (%)
School Enrollment - Grade 1 to 4 (%)
School Enrollment - Grade 5 to 8 (%)
School Enrollment - Grade 9 to 12 (%)
School Enrollment - College undergrad (%)
School Enrollment - Graduate or professional (%)
School Enrollment - Not enrolled in school (%)
School enrollment - Public schools (%)
School enrollment - Private schools (%)
School enrollment - Not enrolled (%)
Median number of rooms in houses and condos
Median number of rooms in apartments
Housing units lacking complete plumbing facilities (%)
Housing units lacking complete kitchen facilities (%)
Density of houses
Urban houses (%)
Rural houses (%)
Households with people 60 years and over (%)
Households with people 65 years and over (%)
Households with people 75 years and over (%)
Households with one or more nonrelatives (%)
Households with no nonrelatives (%)
Population in households (%)
Family households (%)
Nonfamily households (%)
Population in families (%)
Family households with own children (%)
Median number of bedrooms in owner occupied houses
Mean number of bedrooms in owner occupied houses
Median number of bedrooms in renter occupied houses
Mean number of bedrooms in renter occupied houses
Median number of vehichles in owner occupied houses
Mean number of vehichles in owner occupied houses
Median number of vehichles in renter occupied houses
Mean number of vehichles in renter occupied houses
Mortgage status - with mortgage (%)
Mortgage status - with second mortgage (%)
Mortgage status - with home equity loan (%)
Mortgage status - with both second mortgage and home equity loan (%)
Mortgage status - without a mortgage (%)
Average family size
Average family size - White
Average family size - Black or African American
Average family size - Asian
Average family size - Hispanic or Latino
Average family size - American Indian and Alaska Native
Average family size - Multirace
Average family size - Other Race
Geographical mobility - Same house 1 year ago (%)
Geographical mobility - Moved within same county (%)
Geographical mobility - Moved from different county within same state (%)
Geographical mobility - Moved from different state (%)
Geographical mobility - Moved from abroad (%)
Place of birth - Born in state of residence (%)
Place of birth - Born in other state (%)
Place of birth - Native, outside of US (%)
Place of birth - Foreign born (%)
Housing units in structures - 1, detached (%)
Housing units in structures - 1, attached (%)
Housing units in structures - 2 (%)
Housing units in structures - 3 or 4 (%)
Housing units in structures - 5 to 9 (%)
Housing units in structures - 10 to 19 (%)
Housing units in structures - 20 to 49 (%)
Housing units in structures - 50 or more (%)
Housing units in structures - Mobile home (%)
Housing units in structures - Boat, RV, van, etc. (%)
House/condo owner moved in on average (years ago)
Renter moved in on average (years ago)
Year householder moved into unit - Moved in 1999 to March 2000 (%)
Year householder moved into unit - Moved in 1995 to 1998 (%)
Year householder moved into unit - Moved in 1990 to 1994 (%)
Year householder moved into unit - Moved in 1980 to 1989 (%)
Year householder moved into unit - Moved in 1970 to 1979 (%)
Year householder moved into unit - Moved in 1969 or earlier (%)
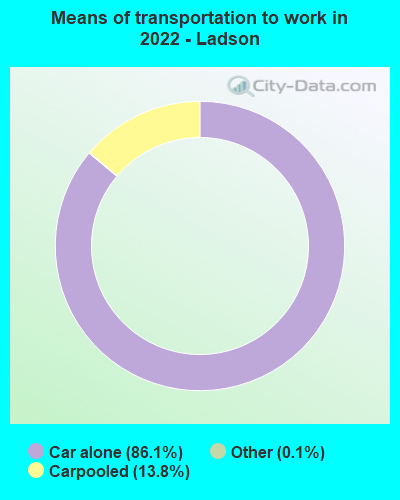
Means of transportation to work - Drove car alone (%)
Means of transportation to work - Carpooled (%)
Means of transportation to work - Public transportation (%)
Means of transportation to work - Bus or trolley bus (%)
Means of transportation to work - Streetcar or trolley car (%)
Means of transportation to work - Subway or elevated (%)
Means of transportation to work - Railroad (%)
Means of transportation to work - Ferryboat (%)
Means of transportation to work - Taxicab (%)
Means of transportation to work - Motorcycle (%)
Means of transportation to work - Bicycle (%)
Means of transportation to work - Walked (%)
Means of transportation to work - Other means (%)
Working at home (%)
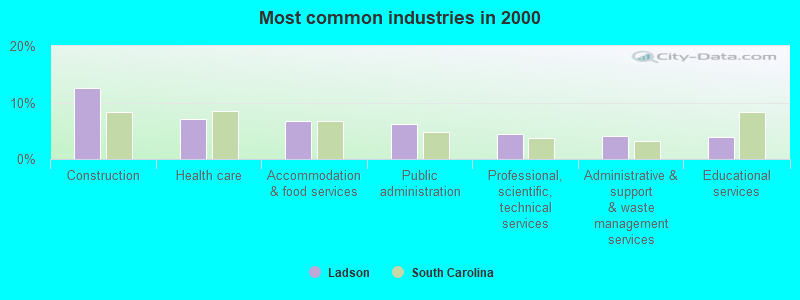
Industry diversity
Most Common Industries - Agriculture, forestry, fishing and hunting, and mining (%)
Most Common Industries - Agriculture, forestry, fishing and hunting (%)
Most Common Industries - Mining, quarrying, and oil and gas extraction (%)
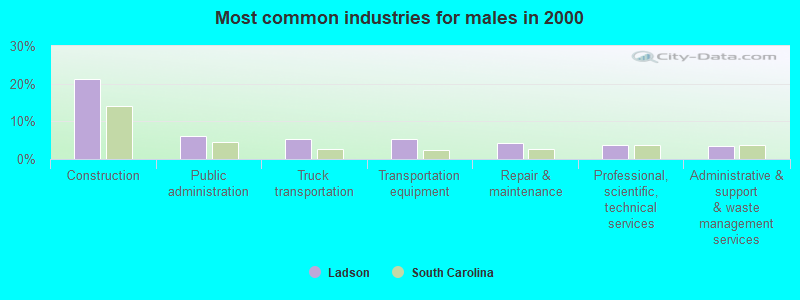
Most Common Industries - Construction (%)
Most Common Industries - Manufacturing (%)
Most Common Industries - Wholesale trade (%)
Most Common Industries - Retail trade (%)
Most Common Industries - Transportation and warehousing, and utilities (%)
Most Common Industries - Transportation and warehousing (%)
Most Common Industries - Utilities (%)
Most Common Industries - Information (%)
Most Common Industries - Finance and insurance, and real estate and rental and leasing (%)
Most Common Industries - Finance and insurance (%)
Most Common Industries - Real estate and rental and leasing (%)
Most Common Industries - Professional, scientific, and management, and administrative and waste management services (%)
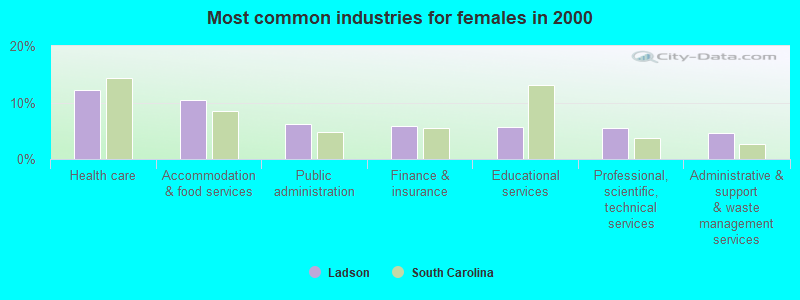
Most Common Industries - Professional, scientific, and technical services (%)
Most Common Industries - Management of companies and enterprises (%)
Most Common Industries - Administrative and support and waste management services (%)
Most Common Industries - Educational services, and health care and social assistance (%)
Most Common Industries - Educational services (%)
Most Common Industries - Health care and social assistance (%)
Most Common Industries - Arts, entertainment, and recreation, and accommodation and food services (%)
Most Common Industries - Arts, entertainment, and recreation (%)
Most Common Industries - Accommodation and food services (%)
Most Common Industries - Other services, except public administration (%)
Most Common Industries - Public administration (%)
Occupation diversity
Most Common Occupations - Management, business, science, and arts occupations (%)
Most Common Occupations - Management, business, and financial occupations (%)
Most Common Occupations - Management occupations (%)
Most Common Occupations - Business and financial operations occupations (%)
Most Common Occupations - Computer, engineering, and science occupations (%)
Most Common Occupations - Computer and mathematical occupations (%)
Most Common Occupations - Architecture and engineering occupations (%)
Most Common Occupations - Life, physical, and social science occupations (%)
Most Common Occupations - Education, legal, community service, arts, and media occupations (%)
Most Common Occupations - Community and social service occupations (%)
Most Common Occupations - Legal occupations (%)
Most Common Occupations - Education, training, and library occupations (%)
Most Common Occupations - Arts, design, entertainment, sports, and media occupations (%)
Most Common Occupations - Healthcare practitioners and technical occupations (%)
Most Common Occupations - Health diagnosing and treating practitioners and other technical occupations (%)
Most Common Occupations - Health technologists and technicians (%)
Most Common Occupations - Service occupations (%)
Most Common Occupations - Healthcare support occupations (%)
Most Common Occupations - Protective service occupations (%)
Most Common Occupations - Fire fighting and prevention, and other protective service workers including supervisors (%)
Most Common Occupations - Law enforcement workers including supervisors (%)
Most Common Occupations - Food preparation and serving related occupations (%)
Most Common Occupations - Building and grounds cleaning and maintenance occupations (%)
Most Common Occupations - Personal care and service occupations (%)
Most Common Occupations - Sales and office occupations (%)
Most Common Occupations - Sales and related occupations (%)
Most Common Occupations - Office and administrative support occupations (%)
Most Common Occupations - Natural resources, construction, and maintenance occupations (%)
Most Common Occupations - Farming, fishing, and forestry occupations (%)
Most Common Occupations - Construction and extraction occupations (%)
Most Common Occupations - Installation, maintenance, and repair occupations (%)
Most Common Occupations - Production, transportation, and material moving occupations (%)
Most Common Occupations - Production occupations (%)
Most Common Occupations - Transportation occupations (%)
Most Common Occupations - Material moving occupations (%)
People in Group quarters - Institutionalized population (%)
People in Group quarters - Correctional institutions (%)
People in Group quarters - Federal prisons and detention centers (%)
People in Group quarters - Halfway houses (%)
People in Group quarters - Local jails and other confinement facilities (including police lockups) (%)
People in Group quarters - Military disciplinary barracks (%)
People in Group quarters - State prisons (%)
People in Group quarters - Other types of correctional institutions (%)
People in Group quarters - Nursing homes (%)
People in Group quarters - Hospitals/wards, hospices, and schools for the handicapped (%)
People in Group quarters - Hospitals/wards and hospices for chronically ill (%)
People in Group quarters - Hospices or homes for chronically ill (%)
People in Group quarters - Military hospitals or wards for chronically ill (%)
People in Group quarters - Other hospitals or wards for chronically ill (%)
People in Group quarters - Hospitals or wards for drug/alcohol abuse (%)
People in Group quarters - Mental (Psychiatric) hospitals or wards (%)
People in Group quarters - Schools, hospitals, or wards for the mentally retarded (%)
People in Group quarters - Schools, hospitals, or wards for the physically handicapped (%)
People in Group quarters - Institutions for the deaf (%)
People in Group quarters - Institutions for the blind (%)
People in Group quarters - Orthopedic wards and institutions for the physically handicapped (%)
People in Group quarters - Wards in general hospitals for patients who have no usual home elsewhere (%)
People in Group quarters - Wards in military hospitals for patients who have no usual home elsewhere (%)
People in Group quarters - Juvenile institutions (%)
People in Group quarters - Long-term care (%)
People in Group quarters - Homes for abused, dependent, and neglected children (%)
People in Group quarters - Residential treatment centers for emotionally disturbed children (%)
People in Group quarters - Training schools for juvenile delinquents (%)
People in Group quarters - Short-term care, detention or diagnostic centers for delinquent children (%)
People in Group quarters - Type of juvenile institution unknown (%)
People in Group quarters - Noninstitutionalized population (%)
People in Group quarters - College dormitories (includes college quarters off campus) (%)
People in Group quarters - Military quarters (%)
People in Group quarters - On base (%)
People in Group quarters - Barracks, unaccompanied personnel housing (UPH), (Enlisted/Officer), ;and similar group living quarters for military personnel (%)
People in Group quarters - Transient quarters for temporary residents (%)
People in Group quarters - Military ships (%)
People in Group quarters - Group homes (%)
People in Group quarters - Homes or halfway houses for drug/alcohol abuse (%)
People in Group quarters - Homes for the mentally ill (%)
People in Group quarters - Homes for the mentally retarded (%)
People in Group quarters - Homes for the physically handicapped (%)
People in Group quarters - Other group homes (%)
People in Group quarters - Religious group quarters (%)
People in Group quarters - Dormitories (%)
People in Group quarters - Agriculture workers' dormitories on farms (%)
People in Group quarters - Job Corps and vocational training facilities (%)
People in Group quarters - Other workers' dormitories (%)
People in Group quarters - Crews of maritime vessels (%)
People in Group quarters - Other nonhousehold living situations (%)
People in Group quarters - Other noninstitutional group quarters (%)
Residents speaking English at home (%)
Residents speaking English at home - Born in the United States (%)
Residents speaking English at home - Native, born elsewhere (%)
Residents speaking English at home - Foreign born (%)
Residents speaking Spanish at home (%)
Residents speaking Spanish at home - Born in the United States (%)
Residents speaking Spanish at home - Native, born elsewhere (%)
Residents speaking Spanish at home - Foreign born (%)
Residents speaking other language at home (%)
Residents speaking other language at home - Born in the United States (%)
Residents speaking other language at home - Native, born elsewhere (%)
Residents speaking other language at home - Foreign born (%)
Class of Workers - Employee of private company (%)
Class of Workers - Self-employed in own incorporated business (%)
Class of Workers - Private not-for-profit wage and salary workers (%)
Class of Workers - Local government workers (%)
Class of Workers - State government workers (%)
Class of Workers - Federal government workers (%)
Class of Workers - Self-employed workers in own not incorporated business and Unpaid family workers (%)
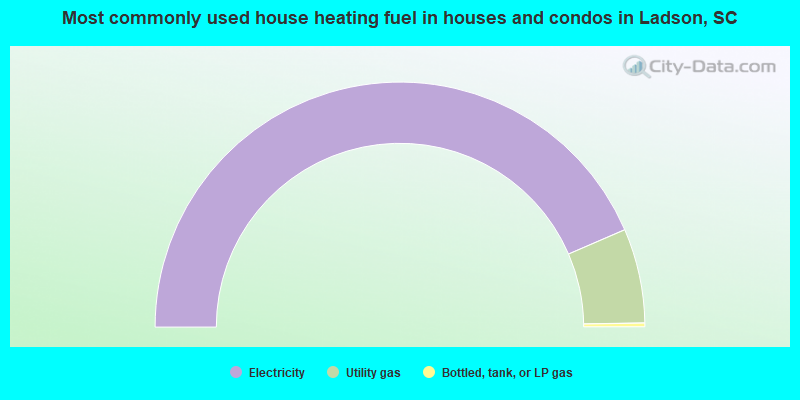
House heating fuel used in houses and condos - Utility gas (%)
House heating fuel used in houses and condos - Bottled, tank, or LP gas (%)
House heating fuel used in houses and condos - Electricity (%)
House heating fuel used in houses and condos - Fuel oil, kerosene, etc. (%)
House heating fuel used in houses and condos - Coal or coke (%)
House heating fuel used in houses and condos - Wood (%)
House heating fuel used in houses and condos - Solar energy (%)
House heating fuel used in houses and condos - Other fuel (%)
House heating fuel used in houses and condos - No fuel used (%)
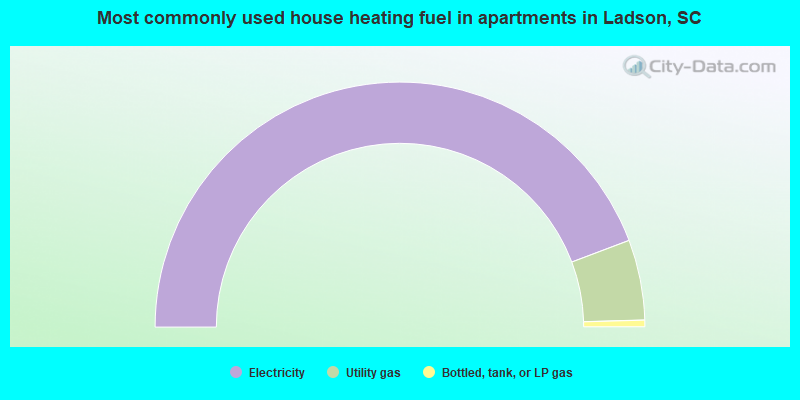
House heating fuel used in apartments - Utility gas (%)
House heating fuel used in apartments - Bottled, tank, or LP gas (%)
House heating fuel used in apartments - Electricity (%)
House heating fuel used in apartments - Fuel oil, kerosene, etc. (%)
House heating fuel used in apartments - Coal or coke (%)
House heating fuel used in apartments - Wood (%)
House heating fuel used in apartments - Solar energy (%)
House heating fuel used in apartments - Other fuel (%)
House heating fuel used in apartments - No fuel used (%)
Armed forces status - In Armed Forces (%)
Armed forces status - Civilian (%)
Armed forces status - Civilian - Veteran (%)
Armed forces status - Civilian - Nonveteran (%)
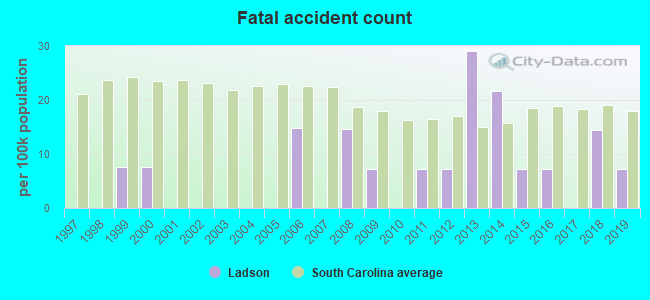
Fatal accidents locations in years 2005-2021
Fatal accidents locations in 2005
Fatal accidents locations in 2006
Fatal accidents locations in 2007
Fatal accidents locations in 2008
Fatal accidents locations in 2009
Fatal accidents locations in 2010
Fatal accidents locations in 2011
Fatal accidents locations in 2012
Fatal accidents locations in 2013
Fatal accidents locations in 2014
Fatal accidents locations in 2015
Fatal accidents locations in 2016
Fatal accidents locations in 2017
Fatal accidents locations in 2018
Fatal accidents locations in 2019
Fatal accidents locations in 2020
Fatal accidents locations in 2021
Alcohol use - People drinking some alcohol every month (%)
Alcohol use - People not drinking at all (%)
Alcohol use - Average days/month drinking alcohol
Alcohol use - Average drinks/week
Alcohol use - Average days/year people drink much
Audiometry - Average condition of hearing (%)
Audiometry - People that can hear a whisper from across a quiet room (%)
Audiometry - People that can hear normal voice from across a quiet room (%)
Audiometry - Ears ringing, roaring, buzzing (%)
Audiometry - Had a job exposure to loud noise (%)
Audiometry - Had off-work exposure to loud noise (%)
Blood Pressure & Cholesterol - Has high blood pressure (%)
Blood Pressure & Cholesterol - Checking blood pressure at home (%)
Blood Pressure & Cholesterol - Frequently checking blood cholesterol (%)
Blood Pressure & Cholesterol - Has high cholesterol level (%)
Consumer Behavior - Money monthly spent on food at supermarket/grocery store
Consumer Behavior - Money monthly spent on food at other stores
Consumer Behavior - Money monthly spent on eating out
Consumer Behavior - Money monthly spent on carryout/delivered foods
Consumer Behavior - Income spent on food at supermarket/grocery store (%)
Consumer Behavior - Income spent on food at other stores (%)
Consumer Behavior - Income spent on eating out (%)
Consumer Behavior - Income spent on carryout/delivered foods (%)
Current Health Status - General health condition (%)
Current Health Status - Blood donors (%)
Current Health Status - Has blood ever tested for HIV virus (%)
Current Health Status - Left-handed people (%)
Dermatology - People using sunscreen (%)
Diabetes - Diabetics (%)
Diabetes - Had a blood test for high blood sugar (%)
Diabetes - People taking insulin (%)
Diet Behavior & Nutrition - Diet health (%)
Diet Behavior & Nutrition - Milk product consumption (# of products/month)
Diet Behavior & Nutrition - Meals not home prepared (#/week)
Diet Behavior & Nutrition - Meals from fast food or pizza place (#/week)
Diet Behavior & Nutrition - Ready-to-eat foods (#/month)
Diet Behavior & Nutrition - Frozen meals/pizza (#/month)
Drug Use - People that ever used marijuana or hashish (%)
Drug Use - Ever used hard drugs (%)
Drug Use - Ever used any form of cocaine (%)
Drug Use - Ever used heroin (%)
Drug Use - Ever used methamphetamine (%)
Health Insurance - People covered by health insurance (%)
Kidney Conditions-Urology - Avg. # of times urinating at night
Medical Conditions - People with asthma (%)
Medical Conditions - People with anemia (%)
Medical Conditions - People with psoriasis (%)
Medical Conditions - People with overweight (%)
Medical Conditions - Elderly people having difficulties in thinking or remembering (%)
Medical Conditions - People who ever received blood transfusion (%)
Medical Conditions - People having trouble seeing even with glass/contacts (%)
Medical Conditions - People with arthritis (%)
Medical Conditions - People with gout (%)
Medical Conditions - People with congestive heart failure (%)
Medical Conditions - People with coronary heart disease (%)
Medical Conditions - People with angina pectoris (%)
Medical Conditions - People who ever had heart attack (%)
Medical Conditions - People who ever had stroke (%)
Medical Conditions - People with emphysema (%)
Medical Conditions - People with thyroid problem (%)
Medical Conditions - People with chronic bronchitis (%)
Medical Conditions - People with any liver condition (%)
Medical Conditions - People who ever had cancer or malignancy (%)
Mental Health - People who have little interest in doing things (%)
Mental Health - People feeling down, depressed, or hopeless (%)
Mental Health - People who have trouble sleeping or sleeping too much (%)
Mental Health - People feeling tired or having little energy (%)
Mental Health - People with poor appetite or overeating (%)
Mental Health - People feeling bad about themself (%)
Mental Health - People who have trouble concentrating on things (%)
Mental Health - People moving or speaking slowly or too fast (%)
Mental Health - People having thoughts they would be better off dead (%)
Oral Health - Average years since last visit a dentist
Oral Health - People embarrassed because of mouth (%)
Oral Health - People with gum disease (%)
Oral Health - General health of teeth and gums (%)
Oral Health - Average days a week using dental floss/device
Oral Health - Average days a week using mouthwash for dental problem
Oral Health - Average number of teeth
Pesticide Use - Households using pesticides to control insects (%)
Pesticide Use - Households using pesticides to kill weeds (%)
Physical Activity - People doing vigorous-intensity work activities (%)
Physical Activity - People doing moderate-intensity work activities (%)
Physical Activity - People walking or bicycling (%)
Physical Activity - People doing vigorous-intensity recreational activities (%)
Physical Activity - People doing moderate-intensity recreational activities (%)
Physical Activity - Average hours a day doing sedentary activities
Physical Activity - Average hours a day watching TV or videos
Physical Activity - Average hours a day using computer
Physical Functioning - People having limitations keeping them from working (%)
Physical Functioning - People limited in amount of work they can do (%)
Physical Functioning - People that need special equipment to walk (%)
Physical Functioning - People experiencing confusion/memory problems (%)
Physical Functioning - People requiring special healthcare equipment (%)
Prescription Medications - Average number of prescription medicines taking
Preventive Aspirin Use - Adults 40+ taking low-dose aspirin (%)
Reproductive Health - Vaginal deliveries (%)
Reproductive Health - Cesarean deliveries (%)
Reproductive Health - Deliveries resulted in a live birth (%)
Reproductive Health - Pregnancies resulted in a delivery (%)
Reproductive Health - Women breastfeeding newborns (%)
Reproductive Health - Women that had a hysterectomy (%)
Reproductive Health - Women that had both ovaries removed (%)
Reproductive Health - Women that have ever taken birth control pills (%)
Reproductive Health - Women taking birth control pills (%)
Reproductive Health - Women that have ever used Depo-Provera or injectables (%)
Reproductive Health - Women that have ever used female hormones (%)
Sexual Behavior - People 18+ that ever had sex (vaginal, anal, or oral) (%)
Sexual Behavior - Males 18+ that ever had vaginal sex with a woman (%)
Sexual Behavior - Males 18+ that ever performed oral sex on a woman (%)
Sexual Behavior - Males 18+ that ever had anal sex with a woman (%)
Sexual Behavior - Males 18+ that ever had any sex with a man (%)
Sexual Behavior - Females 18+ that ever had vaginal sex with a man (%)
Sexual Behavior - Females 18+ that ever performed oral sex on a man (%)
Sexual Behavior - Females 18+ that ever had anal sex with a man (%)
Sexual Behavior - Females 18+ that ever had any kind of sex with a woman (%)
Sexual Behavior - Average age people first had sex
Sexual Behavior - Average number of female sex partners in lifetime (males 18+)
Sexual Behavior - Average number of female vaginal sex partners in lifetime (males 18+)
Sexual Behavior - Average age people first performed oral sex on a woman (18+)
Sexual Behavior - Average number of woman performed oral sex on in lifetime (18+)
Sexual Behavior - Average number of male sex partners in lifetime (males 18+)
Sexual Behavior - Average number of male anal sex partners in lifetime (males 18+)
Sexual Behavior - Average age people first performed oral sex on a man (18+)
Sexual Behavior - Average number of male oral sex partners in lifetime (18+)
Sexual Behavior - People using protection when performing oral sex (%)
Sexual Behavior - Average number of times people have vaginal or anal sex a year
Sexual Behavior - People having sex without condom (%)
Sexual Behavior - Average number of male sex partners in lifetime (females 18+)
Sexual Behavior - Average number of male vaginal sex partners in lifetime (females 18+)
Sexual Behavior - Average number of female sex partners in lifetime (females 18+)
Sexual Behavior - Circumcised males 18+ (%)
Sleep Disorders - Average hours sleeping at night
Sleep Disorders - People that has trouble sleeping (%)
Smoking-Cigarette Use - People smoking cigarettes (%)
Taste & Smell - People 40+ having problems with smell (%)
Taste & Smell - People 40+ having problems with taste (%)
Taste & Smell - People 40+ that ever had wisdom teeth removed (%)
Taste & Smell - People 40+ that ever had tonsils teeth removed (%)
Taste & Smell - People 40+ that ever had a loss of consciousness because of a head injury (%)
Taste & Smell - People 40+ that ever had a broken nose or other serious injury to face or skull (%)
Taste & Smell - People 40+ that ever had two or more sinus infections (%)
Weight - Average height (inches)
Weight - Average weight (pounds)
Weight - Average BMI
Weight - People that are obese (%)
Weight - People that ever were obese (%)
Weight - People trying to lose weight (%)
Latest news from Ladson, SC collected exclusively by city-data.com from local newspapers, TV, and radio stations
Ancestries: American (14.4%), German (5.3%), English (3.6%), Scotch-Irish (3.5%), European (2.6%), Italian (2.2%).
Current Local Time:
Land area: 8.61 square miles.
Population density: 1,602 people per square mile (low).
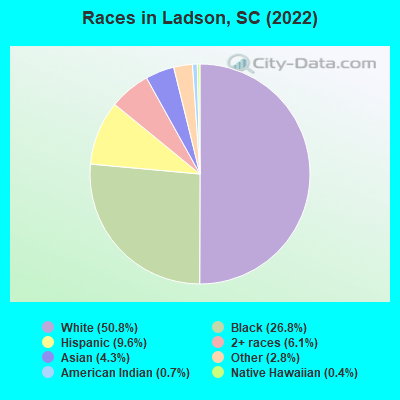
1,198 residents are foreign born (3.7% Asia , 1.9% Latin America , 1.2% Europe , 0.9% Africa ).
This place:
7.7%South Carolina:
5.3%
Median real estate property taxes paid for housing units with mortgages in 2022: $1,067 (0.4%)Median real estate property taxes paid for housing units with no mortgage in 2022: $921 (0.4%)
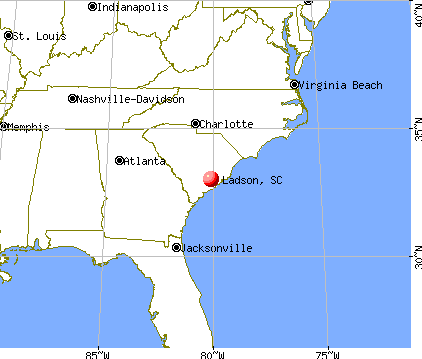
Nearest city with pop. 50,000+: North Charleston, SC
Nearest city with pop. 200,000+: Charlotte, NC
Nearest city with pop. 1,000,000+: Philadelphia, PA
Nearest cities:
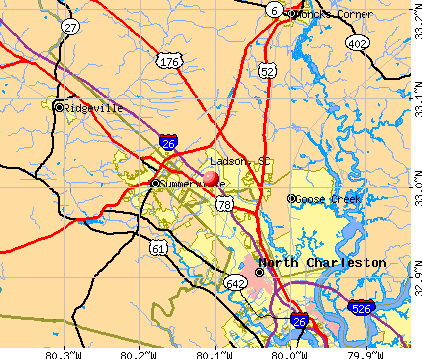
Latitude: 33.01 N, Longitude: 80.11 W
Daytime population change due to commuting: -3,209 (-20.5%)Workers who live and work in this place: 878 (12.5%)
Area code commonly used in this area: 843
Unemployment in December 2023: Here:
2.4%South Carolina:
3.1%
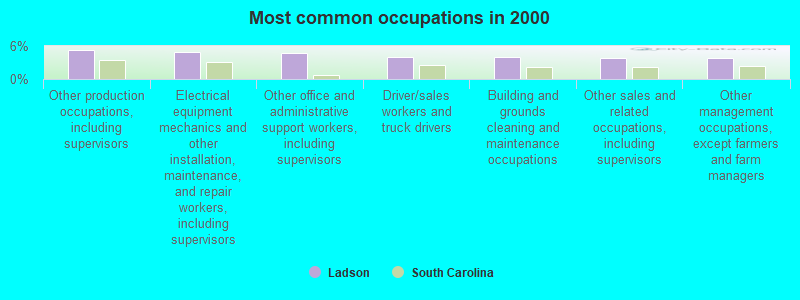
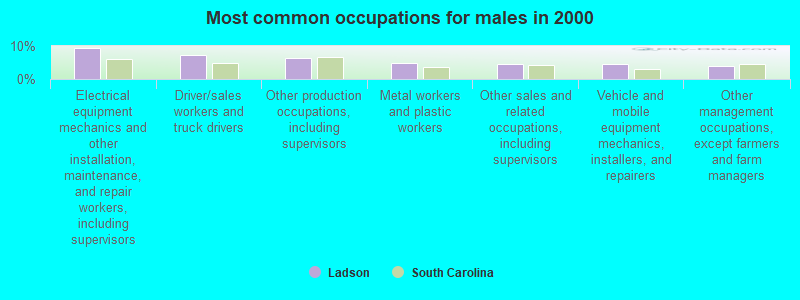
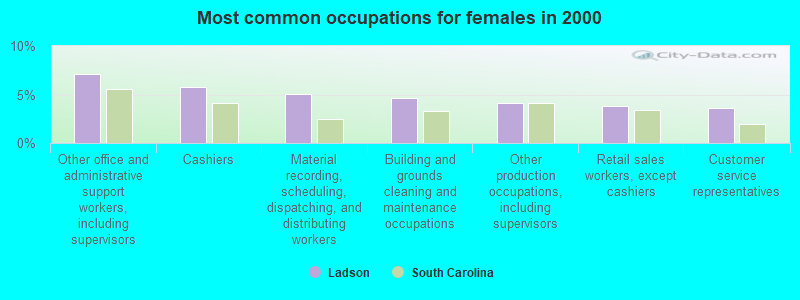
Most common occupations in Ladson, SC (%)
Both Males Females
Other production occupations, including supervisors (5.2%)
Electrical equipment mechanics and other installation, maintenance, and repair workers, including supervisors (4.9%)
Other office and administrative support workers, including supervisors (4.6%)
Driver/sales workers and truck drivers (4.1%)
Building and grounds cleaning and maintenance occupations (4.0%)
Other sales and related occupations, including supervisors (3.9%)
Other management occupations, except farmers and farm managers (3.8%)
Electrical equipment mechanics and other installation, maintenance, and repair workers, including supervisors (9.4%)
Driver/sales workers and truck drivers (7.3%)
Other production occupations, including supervisors (6.3%)
Metal workers and plastic workers (5.0%)
Other sales and related occupations, including supervisors (4.6%)
Vehicle and mobile equipment mechanics, installers, and repairers (4.5%)
Other management occupations, except farmers and farm managers (4.1%)
Other office and administrative support workers, including supervisors (7.1%)
Cashiers (5.8%)
Material recording, scheduling, dispatching, and distributing workers (5.1%)
Building and grounds cleaning and maintenance occupations (4.6%)
Other production occupations, including supervisors (4.1%)
Retail sales workers, except cashiers (3.8%)
Customer service representatives (3.6%)
Tornado activity:
Ladson-area historical tornado activity is below South Carolina state average. It is 33% smaller than the overall U.S. average.
On 9/11/1960, a category F3 (max. wind speeds 158-206 mph) tornado 16.2 miles away from the Ladson place center injured 10 people and caused between $500,000 and $5,000,000 in damages.
On 5/10/1998, a category F2 (max. wind speeds 113-157 mph) tornado 4.4 miles away from the place center killed one person and injured 7 people and caused $5 million in damages.
Earthquake activity:
Ladson-area historical earthquake activity is significantly above South Carolina state average. It is 49% smaller than the overall U.S. average. On 11/22/1974 at 05:25:55, a magnitude 4.7 (4.7 MB, Class: Light, Intensity: IV - V) earthquake occurred 7.9 miles away from the city center On 8/21/1992 at 16:31:55, a magnitude 4.4 (4.1 MB, 4.1 LG, 4.4 LG, Depth: 6.2 mi) earthquake occurred 2.9 miles away from the city center On 8/2/1974 at 08:52:09, a magnitude 4.9 (4.3 MB, 4.9 LG) earthquake occurred 149.9 miles away from the city center On 8/23/2011 at 17:51:04, a magnitude 5.8 (5.8 MW, Depth: 3.7 mi, Class: Moderate, Intensity: VI - VII) earthquake occurred 360.3 miles away from the city center On 8/9/2020 at 12:07:37, a magnitude 5.1 (5.1 MW, Depth: 4.7 mi) earthquake occurred 246.2 miles away from Ladson center On 4/17/1995 at 13:45:57, a magnitude 3.9 (3.9 LG, Depth: 6.2 mi, Class: Light, Intensity: II - III) earthquake occurred 4.8 miles away from the city center Magnitude types: regional Lg-wave magnitude (LG), body-wave magnitude (MB), moment magnitude (MW) Natural disasters: The number of natural disasters in Charleston County (17) is near the US average (15).Major Disasters (Presidential) Declared: 7Emergencies Declared: 6Hurricanes: 9, Floods: 2, Storms: 2, Tropical Storms: 2, Winter Storms: 2, Drought: 1, Other: 1 (Note: some incidents may be assigned to more than one category). Hospitals and medical centers in Ladson: COASTAL CENTER D3 (JAMISON RD)
Other hospitals and medical centers near Ladson: DCI GOOSE CREEK INC (Dialysis Facility, about 2 miles away; GOOSE CREEK, SC)
TRIDENT MEDICAL CENTER (about 3 miles away; CHARLESTON, SC)
TRIDENT MEDICAL SKILLED NURSING CARE CENTER (Nursing Home, about 3 miles away; CHARLESTON, SC)
RAI CARE CENTERS N CHARLESTON (Dialysis Facility, about 3 miles away; CHARLESTON, SC)
INTREPID USA HEALTHCARE SERVICES (Home Health Center, about 3 miles away; N CHARLESTON, SC)
HEALTHSOUTH OF CHARLESTON, INC (Hospital, about 4 miles away; NORTH CHARLESTON, SC)
CHARLESTON RENAL CARE LLC GOOSE CREEK (Dialysis Facility, about 4 miles away; GOOSE CREEK, SC)
Amtrak station near Ladson: 12 miles: CHARLESTON (N. CHARLESTON, 4565 GAYNOR AVE.) Services: ticket office, fully wheelchair accessible, enclosed waiting area, public restrooms, public payphones, vending machines, free short-term parking, free long-term parking, call for car rental service, call for taxi service.
Colleges/universities with over 2000 students nearest to Ladson:
Charleston Southern University (about 3 miles; Charleston, SC ; Full-time enrollment: 3,012)
Trident Technical College (about 8 miles; Charleston, SC ; FT enrollment: 13,125)
Citadel Military College of South Carolina (about 17 miles; Charleston, SC ; FT enrollment: 3,683)
Medical University of South Carolina (about 19 miles; Charleston, SC ; FT enrollment: 2,138)
College of Charleston (about 19 miles; Charleston, SC ; FT enrollment: 10,974)
South Carolina State University (about 55 miles; Orangeburg, SC ; FT enrollment: 3,481)
Orangeburg Calhoun Technical College (about 56 miles; Orangeburg, SC ; FT enrollment: 2,113)
Public elementary/middle schools in Ladson: OAKBROOK ELEMENTARY Students: 1,152, Location: 306 OLD FORT DRIVE, Grades: PK-5)COLLEGE PARK ELEMENTARY Students: 1,050, Location: 100 DAVIDSON DRIVE, Grades: PK-5)OAKBROOK MIDDLE Students: 924, Location: 286 OLD FORT ROAD, Grades: 6-8)SANGAREE MIDDLE Students: 707, Location: 1050 DISCOVERY DRIVE, Grades: 6-8)COLLEGE PARK MIDDLE Students: 680, Location: 713 COLLEGE PARK ROAD, Grades: 6-8)LADSON ELEMENTARY Students: 673, Location: 3321 LADSON ROAD, Grades: PK-5)JOSEPH R. PYE ELEMENTARY Location: 9701 PATRIOT BOULEVARD, Grades: PK-5)
See full list of schools located in Ladson
Notable locations in Ladson: (A) , College Park Business Center (B) , C and B Rural Volunteer Fire Department (C) , Caromi Rural Fire Department (D) . Display/hide their locations on the map
Churches in Ladson include: (A) , Philadelphia Church (B) , Ridge Baptist Church (C) . Display/hide their locations on the map
Cemeteries: (1) , Cherry Hill Cemetery (2) , Pear Cemetery (3) . Display/hide their locations on the map
Swamps: (A) . Display/hide its location on the map
Streams, rivers, and creeks: (A) , Limehouse Branch (B) . Display/hide their locations on the map
Hotels:
Birthplace of: Harold Green (American football) - Football player.
Charleston County has a predicted average indoor radon screening level less than 2 pCi/L (pico curies per liter) - Low Potential Average household size: This place:
3.0 peopleSouth Carolina:
2.5 people
Percentage of family households: This place:
76.4%Whole state:
67.5%
Percentage of households with unmarried partners: This place:
8.5%Whole state:
6.0%
Likely homosexual households (counted as self-reported same-sex unmarried-partner households)
Lesbian couples: 0.4% of all households Gay men: 0.4% of all households
3 people in group homes intended for adults in 2010people in homes for the mentally retarded in 2000
For population 15 years and over in Ladson:
Never married: 36.5%Now married: 44.8%Separated: 3.7%Widowed: 5.6%Divorced: 9.5% For population 25 years and over in Ladson:
High school or higher: 86.3%Bachelor's degree or higher: 21.7%Graduate or professional degree: 6.6%Unemployed: 3.8%Mean travel time to work (commute): 27.4 minutes
Education Gini index (Inequality in education) Here:
10.7South Carolina average:
11.1
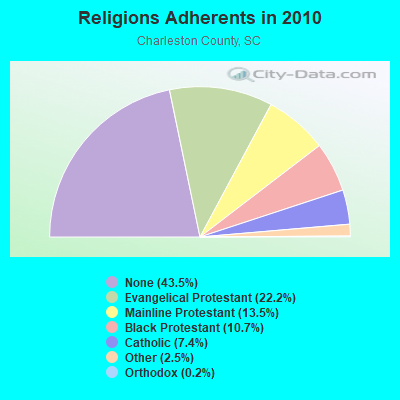
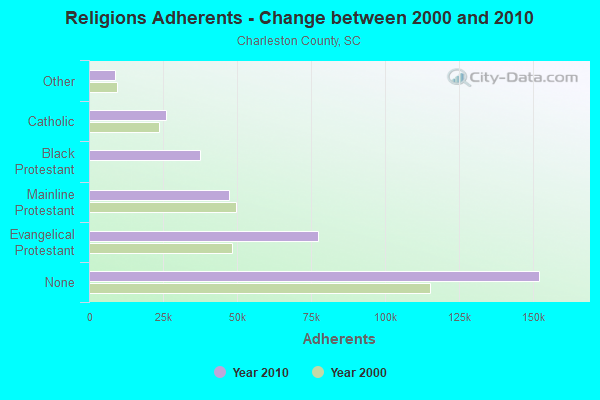
Religion statistics for Ladson, SC (based on Charleston County data)
Religion Adherents Congregations Evangelical Protestant 77,602 223 Mainline Protestant 47,209 106 Black Protestant 37,531 103 Catholic 26,003 19 Other 8,688 24 Orthodox 850 2 None 152,326 -
Source: Clifford Grammich, Kirk Hadaway, Richard Houseal, Dale E.Jones, Alexei Krindatch, Richie Stanley and Richard H.Taylor. 2012. 2010 U.S.Religion Census: Religious Congregations & Membership Study. Association of Statisticians of American Religious Bodies. Jones, Dale E., et al. 2002. Congregations and Membership in the United States 2000. Nashville, TN: Glenmary Research Center. Graphs represent county-level data
Food Environment Statistics: Number of grocery stores : 88This county :
2.56 / 10,000 pop.State :
1.99 / 10,000 pop.
Number of supercenters and club stores : 5Charleston County :
0.15 / 10,000 pop.South Carolina :
0.15 / 10,000 pop.
Number of convenience stores (no gas) : 19This county :
0.55 / 10,000 pop.South Carolina :
0.85 / 10,000 pop.
Number of convenience stores (with gas) : 140Charleston County :
4.08 / 10,000 pop.State :
5.38 / 10,000 pop.
Number of full-service restaurants : 393Charleston County :
11.44 / 10,000 pop.State :
7.75 / 10,000 pop.
Adult diabetes rate : Charleston County :
8.8%South Carolina :
10.6%
Adult obesity rate : This county :
25.5%South Carolina :
29.4%
Low-income preschool obesity rate : Here :
13.7%South Carolina :
13.4%
Health and Nutrition: Healthy diet rate : Ladson:
47.0%South Carolina:
49.2%
Average overall health of teeth and gums : Here:
42.6%South Carolina:
46.2%
People feeling badly about themselves : People not drinking alcohol at all : Here:
12.6%South Carolina:
11.0%
Average hours sleeping at night : Overweight people : This city:
33.3%South Carolina:
34.4%
General health condition : Ladson:
54.8%South Carolina:
55.6%
Average condition of hearing : This city:
80.0%South Carolina:
79.9%
More about Health and Nutrition of Ladson, SC Residents
10.38% of this county's 2021 resident taxpayers lived in other counties in 2020 ($106,855 average adjusted gross income )
Here:
10.38%South Carolina average:
8.89%
0.04% of residents moved from foreign countries ($264 average AGI )Charleston County:
0.04%South Carolina average:
0.04%
Top counties from which taxpayers relocated into this county between 2020 and 2021:
9.80% of this county's 2020 resident taxpayers moved to other counties in 2021 ($68,552 average adjusted gross income )
Here:
9.80%South Carolina average:
7.46%
0.05% of residents moved to foreign countries ($339 average AGI )Charleston County:
0.05%South Carolina average:
0.03%
Top counties to which taxpayers relocated from this county between 2020 and 2021:
Businesses in Ladson, SC
Name Count Name Count
Ace Hardware 1 KFC 1 Advance Auto Parts 1 McDonald's 1 Best Western 1 Subway 1 Burger King 1 Taco Bell 1 CVS 1 U-Haul 1 Cricket Wireless 1 UPS 3 Days Inn 1 Waffle House 1 FedEx 2
Strongest AM radio stations in Ladson:
WIQB (1050 AM; 25 kW; CONWAY, SC; Owner: CUMULUS LICENSING CORP.)
WQTK (950 AM; 10 kW; MONCKS CORNER, SC; Owner: KIRKMAN BROADCASTING, INC.)
WAZS (980 AM; 1 kW; SUMMERVILLE, SC; Owner: THOMAS B. DANIELS)
WSCC (730 AM; 5 kW; CHARLESTON, SC; Owner: CITICASTERS LICENSES, L.P.)
WXTC (1390 AM; 5 kW; CHARLESTON, SC)
WTMA (1250 AM; 5 kW; CHARLESTON, SC; Owner: CITADEL BROADCASTING COMPANY)
WQIZ (810 AM; daytime; 5 kW; ST. GEORGE, SC; Owner: RADIO PROPERTIES, LLC)
WCEO (840 AM; daytime; 50 kW; COLUMBIA, SC; Owner: EASTERN BROADCASTING GROUP, INC.)
WBAJ (890 AM; daytime; 50 kW; BLYTHEWOOD, SC; Owner: FAMILY FIRST)
WTMZ (910 AM; 0 kW; DORCHESTER TERR.-BRE, SC; Owner: CITADEL BROADCASTING COMPANY)
WQSC (1340 AM; 1 kW; CHARLESTON, SC; Owner: KIRKMAN BROADCASTING, INC,)
WQNT (1450 AM; 1 kW; CHARLESTON, SC; Owner: KIRKMAN BROADCASTING, INC.)
WLFJ (660 AM; daytime; 50 kW; GREENVILLE, SC; Owner: CLEAR CHANNEL BROADCASTING LICENSES, INC.)
Strongest FM radio stations in Ladson:
WKCL (91.5 FM; LADSON, SC; Owner: CHAPEL HOLY SPIRIT CHURCH & BIBLE CO)
WJNI (106.3 FM; LADSON, SC; Owner: THOMAS B. DANIELS)
WYFH (90.7 FM; NORTH CHARLESTON, SC; Owner: BIBLE BROADCASTING NETWORK, INC.)
W220CM (91.9 FM; SUMMERVILLE, SC; Owner: RADIO TRAINING NETWORK, INC.)
WSUY (96.9 FM; CHARLESTON, SC; Owner: CITADEL BROADCASTING COMPANY)
WNKT (107.5 FM; ST. GEORGE, SC; Owner: CITADEL BROADCASTING COMPANY)
WAVF (96.1 FM; HANAHAN, SC; Owner: APEX BROADCASTING, INC.)
WSSP (94.3 FM; GOOSE CREEK, SC; Owner: CLEAR CHANNEL BROADCASTING LICENSES, INC.)
WSCI (89.3 FM; CHARLESTON, SC; Owner: SOUTH CAROLINA EDUCATIONAL TV COMMISSION)
WEZL (103.5 FM; CHARLESTON, SC; Owner: CITICASTERS LICENSES, L.P.)
WSSX-FM (95.1 FM; CHARLESTON, SC; Owner: CITADEL BROADCASTING COMPANY)
WXLY (102.5 FM; NORTH CHARLESTON, SC; Owner: CITICASTERS LICENSES, L.P.)
WWWZ (93.3 FM; SUMMERVILLE, SC; Owner: CITADEL BROADCASTING COMPANY)
WCSQ (92.5 FM; MONCKS CORNER, SC; Owner: APEX BROADCASTING, INC.)
WMGL (101.7 FM; RAVENEL, SC; Owner: CITADEL BROADCASTING COMPANY)
WRFQ (104.5 FM; MOUNT PLEASANT, SC; Owner: CITICASTERS LICENSES, L.P.)
WALC (100.5 FM; CHARLESTON, SC; Owner: CITICASTERS LICENSES, L.P.)
WPAL-FM (100.9 FM; RIDGEVILLE, SC; Owner: GRESHAM COMMUNICATIONS, INC.)
WJWJ-FM (89.9 FM; BEAUFORT, SC; Owner: SOUTH CAROLINA EDUCATIONAL TV COMMISSION)
W205BJ (88.9 FM; CHARLESTON, SC; Owner: CALVARY CHAPEL OF TWIN FALLS, INC.)
TV broadcast stations around Ladson:
W26CF (Channel 26; SUMMERVILLE, SC; Owner: DOVE BROADCASTING, INC.)
WCBD-TV (Channel 2; CHARLESTON, SC; Owner: MEDIA GENERAL COMMUNICATIONS, INC.)
WCSC-TV (Channel 5; CHARLESTON, SC; Owner: WCSC, INC.)
WITV (Channel 7; CHARLESTON, SC; Owner: SOUTH CAROLINA EDUCATIONAL TV COMMISSION)
WCIV (Channel 4; CHARLESTON, SC; Owner: WCIV, LLC)
WJNI-LP (Channel 57; NORTH CHARLESTON, SC; Owner: THOMAS B. DANIELS)
WTBD-LP (Channel 22; NORTH CHARLESTON, SC; Owner: THOMAS B. DANIELS)
WMMP (Channel 36; CHARLESTON, SC; Owner: WMMP LICENSEE L.P.)
WTAT-TV (Channel 24; CHARLESTON, SC; Owner: WTAT LICENSEE, LLC)
WJWJ-TV (Channel 16; BEAUFORT, SC; Owner: SOUTH CAROLINA EDUCATIONAL TV COMMISSION)
WJEA-LP (Channel 12; CHARLESTON, SC; Owner: CHARLES S. NAMEY)
W21BX (Channel 21; CHARLESTON, SC; Owner: TRINITY BROADCASTING NETWORK)
WJRB-LP (Channel 18; CHARLESTON, SC; Owner: RAUL INFANTE, JR.)
WCHD-LP (Channel 49; CHARLESTON, SC; Owner: IZZO LIVING TRUST)
National Bridge Inventory (NBI) Statistics 8 Number of bridges85ft / 26.0m Total length $1,868,000 Total costs242,525 Total average daily traffic6,958 Total average daily truck traffic
FCC Registered Antenna Towers: 81 (
See the full list of FCC Registered Antenna Towers in Ladson )
FCC Registered Broadcast Land Mobile Towers: 25 (
See the full list of FCC Registered Broadcast Land Mobile Towers in Ladson, SC )
FCC Registered Microwave Towers: 4
STATE RD, Off Hwy 176 (Lat: 33.132972 Lon: -80.145639), Type: Ltower, Structure height: 53.3 m, Call Sign: WQNL923, Assigned Frequencies: 5945.20 MHz, 6345.49 MHz, 10995.0 MHz, Grant Date: 01/05/2021, Expiration Date: 03/18/2031, Certifier: Dennis A Grant, Registrant: Berkeley Electric Cooperative, 414 Highway 52 North, Moncks Corner, SC 29461, Phone: (843) 899-8437, Fax: (843) 203-5717, Email:
EXCHANGE, 3227 Benchmark Drive (Lat: 32.994222 Lon: -80.110556), Type: Pole, Structure height: 45.7 m, Overall height: 50.3 m, Call Sign: WQWJ816, Assigned Frequencies: 17815.0 MHz, 17915.0 MHz, 17820.0 MHz, 17900.0 MHz, 17820.0 MHz, 17900.0 MHz, 17820.0 MHz, 17900.0 MHz, 17820.0 MHz, 17900.0 MHz... (+24 more), Grant Date: 09/16/2015, Expiration Date: 09/16/2025, Certifier: Gregory M Romano, Registrant: Verizon, 5055 North Point Pkwy, Alpharetta, GA 30022, Phone: (770) 797-1070, Email:
CAROLINA FAIR COW, 9850 Us 78 (Lat: 32.999111 Lon: -80.109000), Type: Mast, Structure height: 19.8 m, Call Sign: WQWJ817, Assigned Frequencies: 19375.0 MHz, 19475.0 MHz, 19380.0 MHz, 19460.0 MHz, 19380.0 MHz, 19460.0 MHz, 19380.0 MHz, 19460.0 MHz, 19380.0 MHz, 19460.0 MHz... (+24 more), Grant Date: 09/16/2015, Expiration Date: 09/16/2025, Certifier: Gregory M Romano, Registrant: Verizon, 5055 North Point Pkwy, Alpharetta, GA 30022, Phone: (770) 797-1070, Email:
MERCEDES, 8501 Palmetto Commerce Pkwy (Lat: 32.961056 Lon: -80.103500), Type: Building, Structure height: 21.4 m, Call Sign: WRKI208, Assigned Frequencies: 18040.0 MHz, 18080.0 MHz, 18040.0 MHz, 18080.0 MHz, 18040.0 MHz, 18080.0 MHz, 18040.0 MHz, 18080.0 MHz, 18040.0 MHz, 18080.0 MHz... (+4 more), Grant Date: 01/07/2021, Expiration Date: 01/07/2031, Certifier: Christophe Le Scanve, Registrant: Cellco Partnership, 5055 North Point Pkwy, Np2ne Network Engineering, Alpharetta, GA 30022, Phone: (770) 797-1070, Email:
FCC Registered Amateur Radio Licenses: 141 (
See the full list of FCC Registered Amateur Radio Licenses in Ladson )
FAA Registered Aircraft: 11 (
See the full list of FAA Registered Aircraft in Ladson )
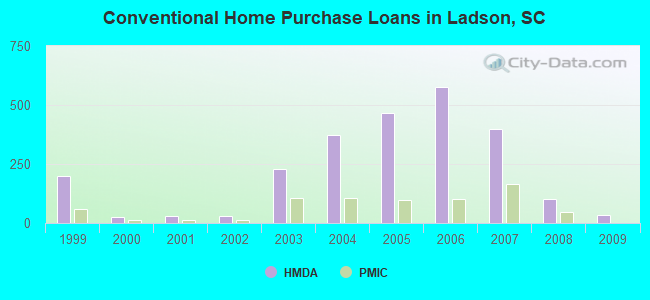
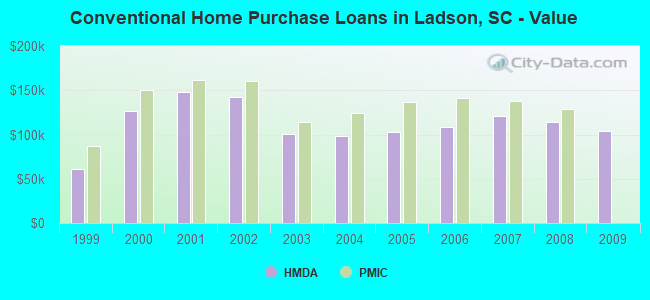
Home Mortgage Disclosure Act Aggregated Statistics For Year 2009(Based on 1 full and 3 partial tracts) A) FHA, FSA/RHS & VA B) Conventional C) Refinancings D) Home Improvement Loans E) Loans on Dwellings For 5+ Families F) Non-occupant Loans on G) Loans On Manufactured Number Average Value Number Average Value Number Average Value Number Average Value Number Average Value Number Average Value Number Average Value
LOANS ORIGINATED 109 $131,150 34 $104,484 258 $145,187 22 $34,207 0 $0 18 $114,135 11 $43,577 APPLICATIONS APPROVED, NOT ACCEPTED 4 $136,220 2 $94,065 26 $121,602 0 $0 0 $0 2 $70,295 1 $43,420 APPLICATIONS DENIED 21 $137,637 5 $123,322 154 $143,991 12 $30,923 0 $0 9 $102,052 3 $93,343 APPLICATIONS WITHDRAWN 15 $135,782 8 $121,508 91 $136,936 6 $80,172 1 $26,488,000 2 $88,575 4 $66,282 FILES CLOSED FOR INCOMPLETENESS 1 $241,040 3 $129,693 27 $136,514 1 $148,000 0 $0 0 $0 1 $41,460
Aggregated Statistics For Year 2008(Based on 1 full and 3 partial tracts) A) FHA, FSA/RHS & VA B) Conventional C) Refinancings D) Home Improvement Loans E) Loans on Dwellings For 5+ Families F) Non-occupant Loans on G) Loans On Manufactured Number Average Value Number Average Value Number Average Value Number Average Value Number Average Value Number Average Value Number Average Value
LOANS ORIGINATED 135 $150,821 102 $114,022 235 $134,165 45 $30,490 0 $0 44 $96,960 12 $64,838 APPLICATIONS APPROVED, NOT ACCEPTED 9 $176,099 11 $140,820 37 $120,653 3 $33,057 0 $0 3 $93,757 8 $73,811 APPLICATIONS DENIED 27 $148,830 23 $92,688 221 $143,512 44 $73,173 1 $216,000 13 $97,833 13 $39,769 APPLICATIONS WITHDRAWN 20 $166,198 21 $128,873 107 $146,264 7 $70,429 0 $0 11 $144,755 1 $51,450 FILES CLOSED FOR INCOMPLETENESS 2 $77,135 2 $102,515 22 $166,680 0 $0 0 $0 1 $104,660 0 $0
Aggregated Statistics For Year 2007(Based on 1 full and 3 partial tracts) A) FHA, FSA/RHS & VA B) Conventional C) Refinancings D) Home Improvement Loans F) Non-occupant Loans on G) Loans On Manufactured Number Average Value Number Average Value Number Average Value Number Average Value Number Average Value Number Average Value
LOANS ORIGINATED 81 $156,970 399 $120,746 279 $121,082 62 $48,467 101 $106,467 14 $60,206 APPLICATIONS APPROVED, NOT ACCEPTED 6 $130,028 34 $119,179 64 $112,229 10 $43,804 9 $83,789 2 $56,615 APPLICATIONS DENIED 28 $160,706 114 $115,261 299 $127,124 85 $60,925 33 $118,469 17 $62,419 APPLICATIONS WITHDRAWN 19 $196,602 84 $129,688 140 $127,485 15 $97,713 16 $117,450 6 $53,130 FILES CLOSED FOR INCOMPLETENESS 1 $138,000 11 $97,979 34 $151,454 2 $31,055 4 $115,185 0 $0
Aggregated Statistics For Year 2006(Based on 1 full and 3 partial tracts) A) FHA, FSA/RHS & VA B) Conventional C) Refinancings D) Home Improvement Loans F) Non-occupant Loans on G) Loans On Manufactured Number Average Value Number Average Value Number Average Value Number Average Value Number Average Value Number Average Value
LOANS ORIGINATED 89 $167,578 577 $108,822 356 $109,465 70 $33,920 160 $91,017 28 $53,317 APPLICATIONS APPROVED, NOT ACCEPTED 8 $167,032 84 $99,515 78 $106,794 8 $46,295 25 $98,198 14 $53,471 APPLICATIONS DENIED 9 $145,852 135 $98,438 304 $118,837 69 $57,727 33 $98,485 48 $54,173 APPLICATIONS WITHDRAWN 17 $158,372 102 $112,647 177 $110,708 26 $93,026 38 $95,188 2 $44,570 FILES CLOSED FOR INCOMPLETENESS 0 $0 19 $93,151 55 $127,851 2 $75,510 3 $113,760 1 $104,000
Aggregated Statistics For Year 2005(Based on 1 full and 3 partial tracts) A) FHA, FSA/RHS & VA B) Conventional C) Refinancings D) Home Improvement Loans E) Loans on Dwellings For 5+ Families F) Non-occupant Loans on G) Loans On Manufactured Number Average Value Number Average Value Number Average Value Number Average Value Number Average Value Number Average Value Number Average Value
LOANS ORIGINATED 101 $161,572 465 $102,995 322 $102,586 67 $41,952 2 $7,503,000 134 $91,611 27 $44,532 APPLICATIONS APPROVED, NOT ACCEPTED 4 $78,060 39 $81,269 66 $88,066 5 $54,614 0 $0 6 $71,885 13 $46,946 APPLICATIONS DENIED 13 $122,322 117 $76,517 305 $105,106 78 $46,876 0 $0 23 $84,104 66 $54,518 APPLICATIONS WITHDRAWN 6 $170,890 62 $105,008 163 $109,073 24 $99,118 2 $7,444,955 23 $77,398 7 $68,817 FILES CLOSED FOR INCOMPLETENESS 0 $0 14 $88,878 73 $115,719 2 $44,355 0 $0 3 $104,533 1 $90,070
Aggregated Statistics For Year 2004(Based on 1 full and 3 partial tracts) A) FHA, FSA/RHS & VA B) Conventional C) Refinancings D) Home Improvement Loans F) Non-occupant Loans on G) Loans On Manufactured Number Average Value Number Average Value Number Average Value Number Average Value Number Average Value Number Average Value
LOANS ORIGINATED 138 $137,182 373 $98,762 321 $94,376 51 $31,192 71 $80,096 23 $58,477 APPLICATIONS APPROVED, NOT ACCEPTED 9 $141,553 50 $85,693 59 $95,296 6 $24,405 6 $79,778 18 $67,468 APPLICATIONS DENIED 18 $127,197 136 $74,068 290 $92,833 47 $38,244 15 $79,793 80 $55,629 APPLICATIONS WITHDRAWN 21 $147,849 42 $107,906 138 $105,921 14 $56,911 12 $80,079 4 $79,915 FILES CLOSED FOR INCOMPLETENESS 0 $0 13 $91,176 59 $101,232 3 $33,030 2 $102,930 1 $87,100
Aggregated Statistics For Year 2003(Based on 1 full and 3 partial tracts) A) FHA, FSA/RHS & VA B) Conventional C) Refinancings D) Home Improvement Loans F) Non-occupant Loans on Number Average Value Number Average Value Number Average Value Number Average Value Number Average Value
LOANS ORIGINATED 135 $128,365 230 $100,682 511 $89,863 28 $18,855 79 $76,612 APPLICATIONS APPROVED, NOT ACCEPTED 7 $115,829 24 $84,906 74 $92,243 2 $10,395 5 $63,790 APPLICATIONS DENIED 9 $92,867 60 $74,377 240 $86,132 28 $17,703 9 $73,057 APPLICATIONS WITHDRAWN 11 $148,785 33 $106,755 127 $89,678 4 $11,662 13 $73,702 FILES CLOSED FOR INCOMPLETENESS 2 $78,635 5 $84,946 17 $92,706 4 $15,108 4 $54,758
Aggregated Statistics For Year 2002(Based on 1 partial tract) A) FHA, FSA/RHS & VA B) Conventional C) Refinancings D) Home Improvement Loans F) Non-occupant Loans on Number Average Value Number Average Value Number Average Value Number Average Value Number Average Value
LOANS ORIGINATED 7 $149,753 28 $142,101 54 $126,805 3 $21,353 6 $74,967 APPLICATIONS APPROVED, NOT ACCEPTED 0 $0 2 $99,365 6 $132,068 1 $21,180 0 $0 APPLICATIONS DENIED 0 $0 5 $109,430 15 $103,453 1 $16,770 1 $68,220 APPLICATIONS WITHDRAWN 0 $0 4 $156,395 9 $107,760 0 $0 1 $46,660 FILES CLOSED FOR INCOMPLETENESS 0 $0 1 $170,870 1 $135,680 0 $0 0 $0
Aggregated Statistics For Year 2001(Based on 1 partial tract) A) FHA, FSA/RHS & VA B) Conventional C) Refinancings D) Home Improvement Loans F) Non-occupant Loans on Number Average Value Number Average Value Number Average Value Number Average Value Number Average Value
LOANS ORIGINATED 11 $131,270 30 $147,596 37 $121,782 5 $18,208 3 $80,537 APPLICATIONS APPROVED, NOT ACCEPTED 0 $0 3 $88,817 4 $98,705 1 $15,760 1 $26,730 APPLICATIONS DENIED 0 $0 5 $52,458 12 $89,058 2 $14,060 0 $0 APPLICATIONS WITHDRAWN 1 $126,860 3 $121,223 10 $101,901 1 $10,090 0 $0 FILES CLOSED FOR INCOMPLETENESS 0 $0 1 $113,360 2 $93,440 0 $0 0 $0
Aggregated Statistics For Year 2000(Based on 1 partial tract) A) FHA, FSA/RHS & VA B) Conventional C) Refinancings D) Home Improvement Loans F) Non-occupant Loans on Number Average Value Number Average Value Number Average Value Number Average Value Number Average Value
LOANS ORIGINATED 11 $119,165 25 $127,013 11 $88,958 4 $11,728 4 $89,845 APPLICATIONS APPROVED, NOT ACCEPTED 1 $61,920 4 $59,455 2 $73,960 1 $34,800 0 $0 APPLICATIONS DENIED 1 $37,700 9 $71,849 10 $73,642 2 $32,785 1 $36,060 APPLICATIONS WITHDRAWN 1 $83,100 3 $107,480 5 $64,564 0 $0 0 $0 FILES CLOSED FOR INCOMPLETENESS 0 $0 1 $66,580 1 $55,480 0 $0 0 $0
Aggregated Statistics For Year 1999(Based on 4 partial tracts) A) FHA, FSA/RHS & VA B) Conventional C) Refinancings D) Home Improvement Loans F) Non-occupant Loans on Number Average Value Number Average Value Number Average Value Number Average Value Number Average Value
LOANS ORIGINATED 143 $80,403 201 $60,800 192 $63,030 47 $11,982 42 $53,954 APPLICATIONS APPROVED, NOT ACCEPTED 4 $89,198 44 $49,653 48 $63,082 17 $25,658 7 $53,356 APPLICATIONS DENIED 7 $77,184 209 $42,552 190 $58,847 48 $18,475 10 $48,150 APPLICATIONS WITHDRAWN 9 $81,726 24 $67,311 93 $62,331 9 $14,971 5 $66,524 FILES CLOSED FOR INCOMPLETENESS 1 $60,680 5 $60,884 35 $65,743 1 $20,730 1 $36,730
Detailed HMDA statistics for the following Tracts:
0031.06
, 0031.07 , 0207.06 , 0207.09
Private Mortgage Insurance Companies Aggregated Statistics For Year 2008(Based on 1 full and 3 partial tracts) A) Conventional B) Refinancings C) Non-occupant Loans on Number Average Value Number Average Value Number Average Value
LOANS ORIGINATED 48 $129,014 33 $157,472 16 $111,263 APPLICATIONS APPROVED, NOT ACCEPTED 20 $151,482 6 $157,650 1 $144,490 APPLICATIONS DENIED 1 $215,480 1 $75,150 1 $70,210 APPLICATIONS WITHDRAWN 0 $0 3 $181,967 0 $0 FILES CLOSED FOR INCOMPLETENESS 1 $231,630 1 $216,000 0 $0
Aggregated Statistics For Year 2007(Based on 1 full and 3 partial tracts) A) Conventional B) Refinancings C) Non-occupant Loans on Number Average Value Number Average Value Number Average Value
LOANS ORIGINATED 164 $137,490 46 $153,428 22 $120,630 APPLICATIONS APPROVED, NOT ACCEPTED 21 $141,880 9 $163,280 1 $146,630 APPLICATIONS DENIED 7 $118,526 2 $169,365 7 $102,923 APPLICATIONS WITHDRAWN 12 $150,217 3 $186,260 2 $134,270 FILES CLOSED FOR INCOMPLETENESS 1 $163,190 0 $0 0 $0
Aggregated Statistics For Year 2006(Based on 1 full and 3 partial tracts) A) Conventional B) Refinancings C) Non-occupant Loans on D) Loans On Manufactured Number Average Value Number Average Value Number Average Value Number Average Value
LOANS ORIGINATED 103 $141,342 27 $144,689 13 $112,017 4 $102,750 APPLICATIONS APPROVED, NOT ACCEPTED 12 $168,623 4 $116,128 4 $159,690 0 $0 APPLICATIONS DENIED 0 $0 1 $120,000 0 $0 0 $0 APPLICATIONS WITHDRAWN 7 $147,933 3 $149,363 0 $0 0 $0 FILES CLOSED FOR INCOMPLETENESS 0 $0 0 $0 0 $0 0 $0
Aggregated Statistics For Year 2005(Based on 1 full and 3 partial tracts) A) Conventional B) Refinancings C) Non-occupant Loans on Number Average Value Number Average Value Number Average Value
LOANS ORIGINATED 96 $137,229 27 $127,847 17 $100,499 APPLICATIONS APPROVED, NOT ACCEPTED 14 $143,646 12 $122,328 2 $111,000 APPLICATIONS DENIED 0 $0 0 $0 0 $0 APPLICATIONS WITHDRAWN 8 $151,141 3 $177,133 1 $121,370 FILES CLOSED FOR INCOMPLETENESS 0 $0 0 $0 0 $0
Aggregated Statistics For Year 2004(Based on 1 full and 3 partial tracts) A) Conventional B) Refinancings C) Non-occupant Loans on Number Average Value Number Average Value Number Average Value
LOANS ORIGINATED 106 $123,928 43 $102,959 10 $90,824 APPLICATIONS APPROVED, NOT ACCEPTED 10 $126,362 11 $133,593 1 $131,100 APPLICATIONS DENIED 2 $80,725 0 $0 1 $83,450 APPLICATIONS WITHDRAWN 5 $109,064 3 $104,827 1 $128,970 FILES CLOSED FOR INCOMPLETENESS 0 $0 1 $84,000 0 $0
Aggregated Statistics For Year 2003(Based on 1 full and 3 partial tracts) A) Conventional B) Refinancings C) Non-occupant Loans on Number Average Value Number Average Value Number Average Value
LOANS ORIGINATED 105 $114,007 85 $108,636 18 $85,322 APPLICATIONS APPROVED, NOT ACCEPTED 11 $112,676 28 $108,378 1 $96,250 APPLICATIONS DENIED 2 $69,000 1 $66,020 0 $0 APPLICATIONS WITHDRAWN 4 $141,185 8 $112,692 0 $0 FILES CLOSED FOR INCOMPLETENESS 2 $72,000 1 $205,840 0 $0
Aggregated Statistics For Year 2002(Based on 1 partial tract) A) Conventional B) Refinancings C) Non-occupant Loans on Number Average Value Number Average Value Number Average Value
LOANS ORIGINATED 13 $160,738 9 $142,311 1 $81,590 APPLICATIONS APPROVED, NOT ACCEPTED 1 $167,330 2 $134,675 0 $0 APPLICATIONS DENIED 0 $0 0 $0 0 $0 APPLICATIONS WITHDRAWN 2 $139,530 0 $0 0 $0 FILES CLOSED FOR INCOMPLETENESS 0 $0 0 $0 0 $0
Aggregated Statistics For Year 2001(Based on 1 partial tract) A) Conventional B) Refinancings C) Non-occupant Loans on Number Average Value Number Average Value Number Average Value
LOANS ORIGINATED 12 $161,818 7 $138,764 1 $45,400 APPLICATIONS APPROVED, NOT ACCEPTED 1 $233,540 1 $113,620 0 $0 APPLICATIONS DENIED 0 $0 0 $0 0 $0 APPLICATIONS WITHDRAWN 0 $0 1 $52,710 0 $0 FILES CLOSED FOR INCOMPLETENESS 0 $0 0 $0 0 $0
Aggregated Statistics For Year 2000(Based on 1 partial tract) A) Conventional B) Refinancings C) Non-occupant Loans on Number Average Value Number Average Value Number Average Value
LOANS ORIGINATED 13 $150,806 1 $78,180 1 $87,510 APPLICATIONS APPROVED, NOT ACCEPTED 1 $93,310 0 $0 0 $0 APPLICATIONS DENIED 0 $0 0 $0 0 $0 APPLICATIONS WITHDRAWN 1 $70,620 0 $0 0 $0 FILES CLOSED FOR INCOMPLETENESS 0 $0 0 $0 0 $0
Aggregated Statistics For Year 1999(Based on 4 partial tracts) A) Conventional B) Refinancings C) Non-occupant Loans on Number Average Value Number Average Value Number Average Value
LOANS ORIGINATED 61 $87,245 18 $76,097 8 $62,104 APPLICATIONS APPROVED, NOT ACCEPTED 3 $133,173 5 $75,058 0 $0 APPLICATIONS DENIED 1 $94,810 2 $85,950 1 $39,050 APPLICATIONS WITHDRAWN 1 $63,370 0 $0 0 $0 FILES CLOSED FOR INCOMPLETENESS 0 $0 1 $59,450 0 $0
Detailed PMIC statistics for the following Tracts:
0031.06
, 0031.07 , 0207.06 , 0207.09
Most common first names in Ladson, SC among deceased individuals Name Count Lived (average)
William 55 70.2 years John 48 68.6 years James 45 64.5 years Mary 35 67.4 years Robert 35 67.3 years Charles 28 70.5 years Dorothy 27 74.0 years David 19 65.0 years Thomas 18 59.7 years Richard 18 55.7 years
Most common last names in Ladson, SC among deceased individuals Last name Count Lived (average)
Brown 24 63.9 years Smith 22 68.3 years Jones 21 65.7 years Davis 16 63.2 years Craven 16 76.6 years King 11 65.7 years Johnson 11 72.7 years Jenkins 10 66.1 years Jackson 9 63.4 years Wright 9 75.1 years
Ladson compared to South Carolina state average:
Unemployed percentage significantly below state average. Hispanic race population percentage above state average. Median age below state average. Foreign-born population percentage above state average. Length of stay since moving in significantly above state average.
Top Patent Applicants
Jeffrey J. Homan (3)
Rebecca Cook (2)
Tyler Emerson Berkey (2)
Brian Duncan (2)
Bryan White (2)
Andrew John Nosti (2)
Mark R. Brei (2)
Paul Forrest Harris, Jr. (2)
Andrew Oxford (2)
Paul F. Harris, Jr. (2)
Total of 37 patent applications in 2008-2024.


 Recent articles from our blog. Our writers, many of them Ph.D. graduates or candidates, create easy-to-read articles on a wide variety of topics.

 (10.0 miles
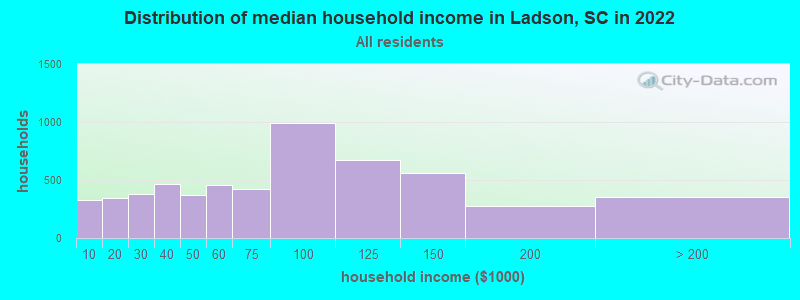


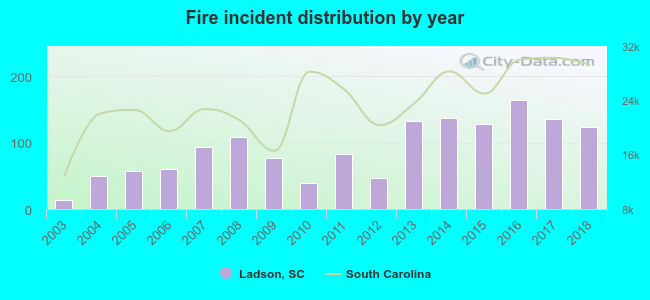 Based on the data from the years 2003 - 2018 the average number of fires per year is 91. The highest number of fires - 164 took place in 2016, and the least - 13 in 2003. The data has a growing trend.
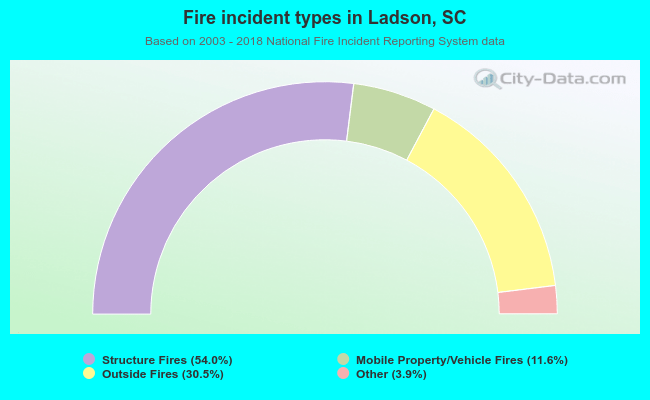 When looking into fire subcategories, the most reports belonged to: Structure Fires (54.0%), and Outside Fires (30.5%).