Mount Pleasant, South Carolina Submit your own pictures of this town and show them to the world
OSM Map
General Map
Google Map
MSN Map
OSM Map
General Map
Google Map
MSN Map
OSM Map
General Map
Google Map
MSN Map
OSM Map
General Map
Google Map
MSN Map
Please wait while loading the map...
Population in 2022: 94,545 (99% urban, 1% rural). Population change since 2000: +98.6%Males: 46,346 Females: 48,199
March 2022 cost of living index in Mount Pleasant: 95.6 (near average, U.S. average is 100) Percentage of residents living in poverty in 2022: 5.1%for White Non-Hispanic residents , 11.8% for Black residents , 10.8% for Hispanic or Latino residents , 71.5% for American Indian residents , 84.5% for Native Hawaiian and other Pacific Islander residents , 25.5% for other race residents , 9.8% for two or more races residents )
Profiles of local businesses
Business Search - 14 Million verified businesses
Data:
Median household income ($)
Median household income (% change since 2000)
Household income diversity
Ratio of average income to average house value (%)
Ratio of average income to average rent
Median household income ($) - White
Median household income ($) - Black or African American
Median household income ($) - Asian
Median household income ($) - Hispanic or Latino
Median household income ($) - American Indian and Alaska Native
Median household income ($) - Multirace
Median household income ($) - Other Race
Median household income for houses/condos with a mortgage ($)
Median household income for apartments without a mortgage ($)
Races - White alone (%)
Races - White alone (% change since 2000)
Races - Black alone (%)
Races - Black alone (% change since 2000)
Races - American Indian alone (%)
Races - American Indian alone (% change since 2000)
Races - Asian alone (%)
Races - Asian alone (% change since 2000)
Races - Hispanic (%)
Races - Hispanic (% change since 2000)
Races - Native Hawaiian and Other Pacific Islander alone (%)
Races - Native Hawaiian and Other Pacific Islander alone (% change since 2000)
Races - Two or more races (%)
Races - Two or more races (% change since 2000)
Races - Other race alone (%)
Races - Other race alone (% change since 2000)
Racial diversity
Unemployment (%)
Unemployment (% change since 2000)
Unemployment (%) - White
Unemployment (%) - Black or African American
Unemployment (%) - Asian
Unemployment (%) - Hispanic or Latino
Unemployment (%) - American Indian and Alaska Native
Unemployment (%) - Multirace
Unemployment (%) - Other Race
Population density (people per square mile)
Population - Males (%)
Population - Females (%)
Population - Males (%) - White
Population - Males (%) - Black or African American
Population - Males (%) - Asian
Population - Males (%) - Hispanic or Latino
Population - Males (%) - American Indian and Alaska Native
Population - Males (%) - Multirace
Population - Males (%) - Other Race
Population - Females (%) - White
Population - Females (%) - Black or African American
Population - Females (%) - Asian
Population - Females (%) - Hispanic or Latino
Population - Females (%) - American Indian and Alaska Native
Population - Females (%) - Multirace
Population - Females (%) - Other Race
Coronavirus confirmed cases (Apr 27, 2024)
Deaths caused by coronavirus (Apr 27, 2024)
Coronavirus confirmed cases (per 100k population) (Apr 27, 2024)
Deaths caused by coronavirus (per 100k population) (Apr 27, 2024)
Daily increase in number of cases (Apr 27, 2024)
Weekly increase in number of cases (Apr 27, 2024)
Cases doubled (in days) (Apr 27, 2024)
Hospitalized patients (Apr 18, 2022)
Negative test results (Apr 18, 2022)
Total test results (Apr 18, 2022)
COVID Vaccine doses distributed (per 100k population) (Sep 19, 2023)
COVID Vaccine doses administered (per 100k population) (Sep 19, 2023)
COVID Vaccine doses distributed (Sep 19, 2023)
COVID Vaccine doses administered (Sep 19, 2023)
Likely homosexual households (%)
Likely homosexual households (% change since 2000)
Likely homosexual households - Lesbian couples (%)
Likely homosexual households - Lesbian couples (% change since 2000)
Likely homosexual households - Gay men (%)
Likely homosexual households - Gay men (% change since 2000)
Cost of living index
Median gross rent ($)
Median contract rent ($)
Median monthly housing costs ($)
Median house or condo value ($)
Median house or condo value ($ change since 2000)
Mean house or condo value by units in structure - 1, detached ($)
Mean house or condo value by units in structure - 1, attached ($)
Mean house or condo value by units in structure - 2 ($)
Mean house or condo value by units in structure by units in structure - 3 or 4 ($)
Mean house or condo value by units in structure - 5 or more ($)
Mean house or condo value by units in structure - Boat, RV, van, etc. ($)
Mean house or condo value by units in structure - Mobile home ($)
Median house or condo value ($) - White
Median house or condo value ($) - Black or African American
Median house or condo value ($) - Asian
Median house or condo value ($) - Hispanic or Latino
Median house or condo value ($) - American Indian and Alaska Native
Median house or condo value ($) - Multirace
Median house or condo value ($) - Other Race
Median resident age
Resident age diversity
Median resident age - Males
Median resident age - Females
Median resident age - White
Median resident age - Black or African American
Median resident age - Asian
Median resident age - Hispanic or Latino
Median resident age - American Indian and Alaska Native
Median resident age - Multirace
Median resident age - Other Race
Median resident age - Males - White
Median resident age - Males - Black or African American
Median resident age - Males - Asian
Median resident age - Males - Hispanic or Latino
Median resident age - Males - American Indian and Alaska Native
Median resident age - Males - Multirace
Median resident age - Males - Other Race
Median resident age - Females - White
Median resident age - Females - Black or African American
Median resident age - Females - Asian
Median resident age - Females - Hispanic or Latino
Median resident age - Females - American Indian and Alaska Native
Median resident age - Females - Multirace
Median resident age - Females - Other Race
Commute - mean travel time to work (minutes)
Travel time to work - Less than 5 minutes (%)
Travel time to work - Less than 5 minutes (% change since 2000)
Travel time to work - 5 to 9 minutes (%)
Travel time to work - 5 to 9 minutes (% change since 2000)
Travel time to work - 10 to 19 minutes (%)
Travel time to work - 10 to 19 minutes (% change since 2000)
Travel time to work - 20 to 29 minutes (%)
Travel time to work - 20 to 29 minutes (% change since 2000)
Travel time to work - 30 to 39 minutes (%)
Travel time to work - 30 to 39 minutes (% change since 2000)
Travel time to work - 40 to 59 minutes (%)
Travel time to work - 40 to 59 minutes (% change since 2000)
Travel time to work - 60 to 89 minutes (%)
Travel time to work - 60 to 89 minutes (% change since 2000)
Travel time to work - 90 or more minutes (%)
Travel time to work - 90 or more minutes (% change since 2000)
Marital status - Never married (%)
Marital status - Now married (%)
Marital status - Separated (%)
Marital status - Widowed (%)
Marital status - Divorced (%)
Median family income ($)
Median family income (% change since 2000)
Median non-family income ($)
Median non-family income (% change since 2000)
Median per capita income ($)
Median per capita income (% change since 2000)
Median family income ($) - White
Median family income ($) - Black or African American
Median family income ($) - Asian
Median family income ($) - Hispanic or Latino
Median family income ($) - American Indian and Alaska Native
Median family income ($) - Multirace
Median family income ($) - Other Race
Median year house/condo built
Median year apartment built
Year house built - Built 2005 or later (%)
Year house built - Built 2000 to 2004 (%)
Year house built - Built 1990 to 1999 (%)
Year house built - Built 1980 to 1989 (%)
Year house built - Built 1970 to 1979 (%)
Year house built - Built 1960 to 1969 (%)
Year house built - Built 1950 to 1959 (%)
Year house built - Built 1940 to 1949 (%)
Year house built - Built 1939 or earlier (%)
Average household size
Household density (households per square mile)
Average household size - White
Average household size - Black or African American
Average household size - Asian
Average household size - Hispanic or Latino
Average household size - American Indian and Alaska Native
Average household size - Multirace
Average household size - Other Race
Occupied housing units (%)
Vacant housing units (%)
Owner occupied housing units (%)
Renter occupied housing units (%)
Vacancy status - For rent (%)
Vacancy status - For sale only (%)
Vacancy status - Rented or sold, not occupied (%)
Vacancy status - For seasonal, recreational, or occasional use (%)
Vacancy status - For migrant workers (%)
Vacancy status - Other vacant (%)
Residents with income below the poverty level (%)
Residents with income below 50% of the poverty level (%)
Children below poverty level (%)
Poor families by family type - Married-couple family (%)
Poor families by family type - Male, no wife present (%)
Poor families by family type - Female, no husband present (%)
Poverty status for native-born residents (%)
Poverty status for foreign-born residents (%)
Poverty among high school graduates not in families (%)
Poverty among people who did not graduate high school not in families (%)
Residents with income below the poverty level (%) - White
Residents with income below the poverty level (%) - Black or African American
Residents with income below the poverty level (%) - Asian
Residents with income below the poverty level (%) - Hispanic or Latino
Residents with income below the poverty level (%) - American Indian and Alaska Native
Residents with income below the poverty level (%) - Multirace
Residents with income below the poverty level (%) - Other Race
Air pollution - Air Quality Index (AQI)
Air pollution - CO
Air pollution - NO2
Air pollution - SO2
Air pollution - Ozone
Air pollution - PM10
Air pollution - PM25
Air pollution - Pb
Crime - Murders per 100,000 population
Crime - Rapes per 100,000 population
Crime - Robberies per 100,000 population
Crime - Assaults per 100,000 population
Crime - Burglaries per 100,000 population
Crime - Thefts per 100,000 population
Crime - Auto thefts per 100,000 population
Crime - Arson per 100,000 population
Crime - City-data.com crime index
Crime - Violent crime index
Crime - Property crime index
Crime - Murders per 100,000 population (5 year average)
Crime - Rapes per 100,000 population (5 year average)
Crime - Robberies per 100,000 population (5 year average)
Crime - Assaults per 100,000 population (5 year average)
Crime - Burglaries per 100,000 population (5 year average)
Crime - Thefts per 100,000 population (5 year average)
Crime - Auto thefts per 100,000 population (5 year average)
Crime - Arson per 100,000 population (5 year average)
Crime - City-data.com crime index (5 year average)
Crime - Violent crime index (5 year average)
Crime - Property crime index (5 year average)
1996 Presidential Elections Results (%) - Democratic Party (Clinton)
1996 Presidential Elections Results (%) - Republican Party (Dole)
1996 Presidential Elections Results (%) - Other
2000 Presidential Elections Results (%) - Democratic Party (Gore)
2000 Presidential Elections Results (%) - Republican Party (Bush)
2000 Presidential Elections Results (%) - Other
2004 Presidential Elections Results (%) - Democratic Party (Kerry)
2004 Presidential Elections Results (%) - Republican Party (Bush)
2004 Presidential Elections Results (%) - Other
2008 Presidential Elections Results (%) - Democratic Party (Obama)
2008 Presidential Elections Results (%) - Republican Party (McCain)
2008 Presidential Elections Results (%) - Other
2012 Presidential Elections Results (%) - Democratic Party (Obama)
2012 Presidential Elections Results (%) - Republican Party (Romney)
2012 Presidential Elections Results (%) - Other
2016 Presidential Elections Results (%) - Democratic Party (Clinton)
2016 Presidential Elections Results (%) - Republican Party (Trump)
2016 Presidential Elections Results (%) - Other
2020 Presidential Elections Results (%) - Democratic Party (Biden)
2020 Presidential Elections Results (%) - Republican Party (Trump)
2020 Presidential Elections Results (%) - Other
Ancestries Reported - Arab (%)
Ancestries Reported - Czech (%)
Ancestries Reported - Danish (%)
Ancestries Reported - Dutch (%)
Ancestries Reported - English (%)
Ancestries Reported - French (%)
Ancestries Reported - French Canadian (%)
Ancestries Reported - German (%)
Ancestries Reported - Greek (%)
Ancestries Reported - Hungarian (%)
Ancestries Reported - Irish (%)
Ancestries Reported - Italian (%)
Ancestries Reported - Lithuanian (%)
Ancestries Reported - Norwegian (%)
Ancestries Reported - Polish (%)
Ancestries Reported - Portuguese (%)
Ancestries Reported - Russian (%)
Ancestries Reported - Scotch-Irish (%)
Ancestries Reported - Scottish (%)
Ancestries Reported - Slovak (%)
Ancestries Reported - Subsaharan African (%)
Ancestries Reported - Swedish (%)
Ancestries Reported - Swiss (%)
Ancestries Reported - Ukrainian (%)
Ancestries Reported - United States (%)
Ancestries Reported - Welsh (%)
Ancestries Reported - West Indian (%)
Ancestries Reported - Other (%)
Educational Attainment - No schooling completed (%)
Educational Attainment - Less than high school (%)
Educational Attainment - High school or equivalent (%)
Educational Attainment - Less than 1 year of college (%)
Educational Attainment - 1 or more years of college (%)
Educational Attainment - Associate degree (%)
Educational Attainment - Bachelor's degree (%)
Educational Attainment - Master's degree (%)
Educational Attainment - Professional school degree (%)
Educational Attainment - Doctorate degree (%)
School Enrollment - Nursery, preschool (%)
School Enrollment - Kindergarten (%)
School Enrollment - Grade 1 to 4 (%)
School Enrollment - Grade 5 to 8 (%)
School Enrollment - Grade 9 to 12 (%)
School Enrollment - College undergrad (%)
School Enrollment - Graduate or professional (%)
School Enrollment - Not enrolled in school (%)
School enrollment - Public schools (%)
School enrollment - Private schools (%)
School enrollment - Not enrolled (%)
Median number of rooms in houses and condos
Median number of rooms in apartments
Housing units lacking complete plumbing facilities (%)
Housing units lacking complete kitchen facilities (%)
Density of houses
Urban houses (%)
Rural houses (%)
Households with people 60 years and over (%)
Households with people 65 years and over (%)
Households with people 75 years and over (%)
Households with one or more nonrelatives (%)
Households with no nonrelatives (%)
Population in households (%)
Family households (%)
Nonfamily households (%)
Population in families (%)
Family households with own children (%)
Median number of bedrooms in owner occupied houses
Mean number of bedrooms in owner occupied houses
Median number of bedrooms in renter occupied houses
Mean number of bedrooms in renter occupied houses
Median number of vehichles in owner occupied houses
Mean number of vehichles in owner occupied houses
Median number of vehichles in renter occupied houses
Mean number of vehichles in renter occupied houses
Mortgage status - with mortgage (%)
Mortgage status - with second mortgage (%)
Mortgage status - with home equity loan (%)
Mortgage status - with both second mortgage and home equity loan (%)
Mortgage status - without a mortgage (%)
Average family size
Average family size - White
Average family size - Black or African American
Average family size - Asian
Average family size - Hispanic or Latino
Average family size - American Indian and Alaska Native
Average family size - Multirace
Average family size - Other Race
Geographical mobility - Same house 1 year ago (%)
Geographical mobility - Moved within same county (%)
Geographical mobility - Moved from different county within same state (%)
Geographical mobility - Moved from different state (%)
Geographical mobility - Moved from abroad (%)
Place of birth - Born in state of residence (%)
Place of birth - Born in other state (%)
Place of birth - Native, outside of US (%)
Place of birth - Foreign born (%)
Housing units in structures - 1, detached (%)
Housing units in structures - 1, attached (%)
Housing units in structures - 2 (%)
Housing units in structures - 3 or 4 (%)
Housing units in structures - 5 to 9 (%)
Housing units in structures - 10 to 19 (%)
Housing units in structures - 20 to 49 (%)
Housing units in structures - 50 or more (%)
Housing units in structures - Mobile home (%)
Housing units in structures - Boat, RV, van, etc. (%)
House/condo owner moved in on average (years ago)
Renter moved in on average (years ago)
Year householder moved into unit - Moved in 1999 to March 2000 (%)
Year householder moved into unit - Moved in 1995 to 1998 (%)
Year householder moved into unit - Moved in 1990 to 1994 (%)
Year householder moved into unit - Moved in 1980 to 1989 (%)
Year householder moved into unit - Moved in 1970 to 1979 (%)
Year householder moved into unit - Moved in 1969 or earlier (%)
Means of transportation to work - Drove car alone (%)
Means of transportation to work - Carpooled (%)
Means of transportation to work - Public transportation (%)
Means of transportation to work - Bus or trolley bus (%)
Means of transportation to work - Streetcar or trolley car (%)
Means of transportation to work - Subway or elevated (%)
Means of transportation to work - Railroad (%)
Means of transportation to work - Ferryboat (%)
Means of transportation to work - Taxicab (%)
Means of transportation to work - Motorcycle (%)
Means of transportation to work - Bicycle (%)
Means of transportation to work - Walked (%)
Means of transportation to work - Other means (%)
Working at home (%)
Industry diversity
Most Common Industries - Agriculture, forestry, fishing and hunting, and mining (%)
Most Common Industries - Agriculture, forestry, fishing and hunting (%)
Most Common Industries - Mining, quarrying, and oil and gas extraction (%)
Most Common Industries - Construction (%)
Most Common Industries - Manufacturing (%)
Most Common Industries - Wholesale trade (%)
Most Common Industries - Retail trade (%)
Most Common Industries - Transportation and warehousing, and utilities (%)
Most Common Industries - Transportation and warehousing (%)
Most Common Industries - Utilities (%)
Most Common Industries - Information (%)
Most Common Industries - Finance and insurance, and real estate and rental and leasing (%)
Most Common Industries - Finance and insurance (%)
Most Common Industries - Real estate and rental and leasing (%)
Most Common Industries - Professional, scientific, and management, and administrative and waste management services (%)
Most Common Industries - Professional, scientific, and technical services (%)
Most Common Industries - Management of companies and enterprises (%)
Most Common Industries - Administrative and support and waste management services (%)
Most Common Industries - Educational services, and health care and social assistance (%)
Most Common Industries - Educational services (%)
Most Common Industries - Health care and social assistance (%)
Most Common Industries - Arts, entertainment, and recreation, and accommodation and food services (%)
Most Common Industries - Arts, entertainment, and recreation (%)
Most Common Industries - Accommodation and food services (%)
Most Common Industries - Other services, except public administration (%)
Most Common Industries - Public administration (%)
Occupation diversity
Most Common Occupations - Management, business, science, and arts occupations (%)
Most Common Occupations - Management, business, and financial occupations (%)
Most Common Occupations - Management occupations (%)
Most Common Occupations - Business and financial operations occupations (%)
Most Common Occupations - Computer, engineering, and science occupations (%)
Most Common Occupations - Computer and mathematical occupations (%)
Most Common Occupations - Architecture and engineering occupations (%)
Most Common Occupations - Life, physical, and social science occupations (%)
Most Common Occupations - Education, legal, community service, arts, and media occupations (%)
Most Common Occupations - Community and social service occupations (%)
Most Common Occupations - Legal occupations (%)
Most Common Occupations - Education, training, and library occupations (%)
Most Common Occupations - Arts, design, entertainment, sports, and media occupations (%)
Most Common Occupations - Healthcare practitioners and technical occupations (%)
Most Common Occupations - Health diagnosing and treating practitioners and other technical occupations (%)
Most Common Occupations - Health technologists and technicians (%)
Most Common Occupations - Service occupations (%)
Most Common Occupations - Healthcare support occupations (%)
Most Common Occupations - Protective service occupations (%)
Most Common Occupations - Fire fighting and prevention, and other protective service workers including supervisors (%)
Most Common Occupations - Law enforcement workers including supervisors (%)
Most Common Occupations - Food preparation and serving related occupations (%)
Most Common Occupations - Building and grounds cleaning and maintenance occupations (%)
Most Common Occupations - Personal care and service occupations (%)
Most Common Occupations - Sales and office occupations (%)
Most Common Occupations - Sales and related occupations (%)
Most Common Occupations - Office and administrative support occupations (%)
Most Common Occupations - Natural resources, construction, and maintenance occupations (%)
Most Common Occupations - Farming, fishing, and forestry occupations (%)
Most Common Occupations - Construction and extraction occupations (%)
Most Common Occupations - Installation, maintenance, and repair occupations (%)
Most Common Occupations - Production, transportation, and material moving occupations (%)
Most Common Occupations - Production occupations (%)
Most Common Occupations - Transportation occupations (%)
Most Common Occupations - Material moving occupations (%)
People in Group quarters - Institutionalized population (%)
People in Group quarters - Correctional institutions (%)
People in Group quarters - Federal prisons and detention centers (%)
People in Group quarters - Halfway houses (%)
People in Group quarters - Local jails and other confinement facilities (including police lockups) (%)
People in Group quarters - Military disciplinary barracks (%)
People in Group quarters - State prisons (%)
People in Group quarters - Other types of correctional institutions (%)
People in Group quarters - Nursing homes (%)
People in Group quarters - Hospitals/wards, hospices, and schools for the handicapped (%)
People in Group quarters - Hospitals/wards and hospices for chronically ill (%)
People in Group quarters - Hospices or homes for chronically ill (%)
People in Group quarters - Military hospitals or wards for chronically ill (%)
People in Group quarters - Other hospitals or wards for chronically ill (%)
People in Group quarters - Hospitals or wards for drug/alcohol abuse (%)
People in Group quarters - Mental (Psychiatric) hospitals or wards (%)
People in Group quarters - Schools, hospitals, or wards for the mentally retarded (%)
People in Group quarters - Schools, hospitals, or wards for the physically handicapped (%)
People in Group quarters - Institutions for the deaf (%)
People in Group quarters - Institutions for the blind (%)
People in Group quarters - Orthopedic wards and institutions for the physically handicapped (%)
People in Group quarters - Wards in general hospitals for patients who have no usual home elsewhere (%)
People in Group quarters - Wards in military hospitals for patients who have no usual home elsewhere (%)
People in Group quarters - Juvenile institutions (%)
People in Group quarters - Long-term care (%)
People in Group quarters - Homes for abused, dependent, and neglected children (%)
People in Group quarters - Residential treatment centers for emotionally disturbed children (%)
People in Group quarters - Training schools for juvenile delinquents (%)
People in Group quarters - Short-term care, detention or diagnostic centers for delinquent children (%)
People in Group quarters - Type of juvenile institution unknown (%)
People in Group quarters - Noninstitutionalized population (%)
People in Group quarters - College dormitories (includes college quarters off campus) (%)
People in Group quarters - Military quarters (%)
People in Group quarters - On base (%)
People in Group quarters - Barracks, unaccompanied personnel housing (UPH), (Enlisted/Officer), ;and similar group living quarters for military personnel (%)
People in Group quarters - Transient quarters for temporary residents (%)
People in Group quarters - Military ships (%)
People in Group quarters - Group homes (%)
People in Group quarters - Homes or halfway houses for drug/alcohol abuse (%)
People in Group quarters - Homes for the mentally ill (%)
People in Group quarters - Homes for the mentally retarded (%)
People in Group quarters - Homes for the physically handicapped (%)
People in Group quarters - Other group homes (%)
People in Group quarters - Religious group quarters (%)
People in Group quarters - Dormitories (%)
People in Group quarters - Agriculture workers' dormitories on farms (%)
People in Group quarters - Job Corps and vocational training facilities (%)
People in Group quarters - Other workers' dormitories (%)
People in Group quarters - Crews of maritime vessels (%)
People in Group quarters - Other nonhousehold living situations (%)
People in Group quarters - Other noninstitutional group quarters (%)
Residents speaking English at home (%)
Residents speaking English at home - Born in the United States (%)
Residents speaking English at home - Native, born elsewhere (%)
Residents speaking English at home - Foreign born (%)
Residents speaking Spanish at home (%)
Residents speaking Spanish at home - Born in the United States (%)
Residents speaking Spanish at home - Native, born elsewhere (%)
Residents speaking Spanish at home - Foreign born (%)
Residents speaking other language at home (%)
Residents speaking other language at home - Born in the United States (%)
Residents speaking other language at home - Native, born elsewhere (%)
Residents speaking other language at home - Foreign born (%)
Class of Workers - Employee of private company (%)
Class of Workers - Self-employed in own incorporated business (%)
Class of Workers - Private not-for-profit wage and salary workers (%)
Class of Workers - Local government workers (%)
Class of Workers - State government workers (%)
Class of Workers - Federal government workers (%)
Class of Workers - Self-employed workers in own not incorporated business and Unpaid family workers (%)
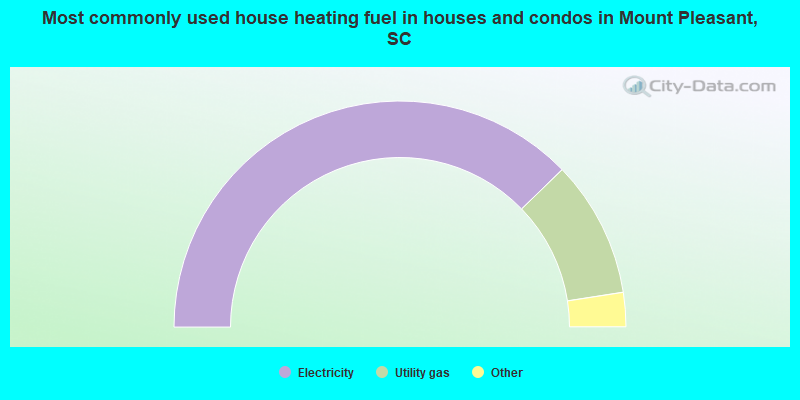
House heating fuel used in houses and condos - Utility gas (%)
House heating fuel used in houses and condos - Bottled, tank, or LP gas (%)
House heating fuel used in houses and condos - Electricity (%)
House heating fuel used in houses and condos - Fuel oil, kerosene, etc. (%)
House heating fuel used in houses and condos - Coal or coke (%)
House heating fuel used in houses and condos - Wood (%)
House heating fuel used in houses and condos - Solar energy (%)
House heating fuel used in houses and condos - Other fuel (%)
House heating fuel used in houses and condos - No fuel used (%)
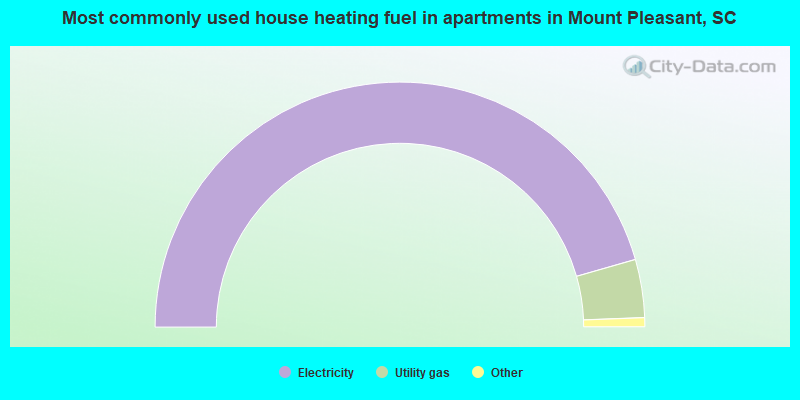
House heating fuel used in apartments - Utility gas (%)
House heating fuel used in apartments - Bottled, tank, or LP gas (%)
House heating fuel used in apartments - Electricity (%)
House heating fuel used in apartments - Fuel oil, kerosene, etc. (%)
House heating fuel used in apartments - Coal or coke (%)
House heating fuel used in apartments - Wood (%)
House heating fuel used in apartments - Solar energy (%)
House heating fuel used in apartments - Other fuel (%)
House heating fuel used in apartments - No fuel used (%)
Armed forces status - In Armed Forces (%)
Armed forces status - Civilian (%)
Armed forces status - Civilian - Veteran (%)
Armed forces status - Civilian - Nonveteran (%)
Fatal accidents locations in years 2005-2021
Fatal accidents locations in 2005
Fatal accidents locations in 2006
Fatal accidents locations in 2007
Fatal accidents locations in 2008
Fatal accidents locations in 2009
Fatal accidents locations in 2010
Fatal accidents locations in 2011
Fatal accidents locations in 2012
Fatal accidents locations in 2013
Fatal accidents locations in 2014
Fatal accidents locations in 2015
Fatal accidents locations in 2016
Fatal accidents locations in 2017
Fatal accidents locations in 2018
Fatal accidents locations in 2019
Fatal accidents locations in 2020
Fatal accidents locations in 2021
Alcohol use - People drinking some alcohol every month (%)
Alcohol use - People not drinking at all (%)
Alcohol use - Average days/month drinking alcohol
Alcohol use - Average drinks/week
Alcohol use - Average days/year people drink much
Audiometry - Average condition of hearing (%)
Audiometry - People that can hear a whisper from across a quiet room (%)
Audiometry - People that can hear normal voice from across a quiet room (%)
Audiometry - Ears ringing, roaring, buzzing (%)
Audiometry - Had a job exposure to loud noise (%)
Audiometry - Had off-work exposure to loud noise (%)
Blood Pressure & Cholesterol - Has high blood pressure (%)
Blood Pressure & Cholesterol - Checking blood pressure at home (%)
Blood Pressure & Cholesterol - Frequently checking blood cholesterol (%)
Blood Pressure & Cholesterol - Has high cholesterol level (%)
Consumer Behavior - Money monthly spent on food at supermarket/grocery store
Consumer Behavior - Money monthly spent on food at other stores
Consumer Behavior - Money monthly spent on eating out
Consumer Behavior - Money monthly spent on carryout/delivered foods
Consumer Behavior - Income spent on food at supermarket/grocery store (%)
Consumer Behavior - Income spent on food at other stores (%)
Consumer Behavior - Income spent on eating out (%)
Consumer Behavior - Income spent on carryout/delivered foods (%)
Current Health Status - General health condition (%)
Current Health Status - Blood donors (%)
Current Health Status - Has blood ever tested for HIV virus (%)
Current Health Status - Left-handed people (%)
Dermatology - People using sunscreen (%)
Diabetes - Diabetics (%)
Diabetes - Had a blood test for high blood sugar (%)
Diabetes - People taking insulin (%)
Diet Behavior & Nutrition - Diet health (%)
Diet Behavior & Nutrition - Milk product consumption (# of products/month)
Diet Behavior & Nutrition - Meals not home prepared (#/week)
Diet Behavior & Nutrition - Meals from fast food or pizza place (#/week)
Diet Behavior & Nutrition - Ready-to-eat foods (#/month)
Diet Behavior & Nutrition - Frozen meals/pizza (#/month)
Drug Use - People that ever used marijuana or hashish (%)
Drug Use - Ever used hard drugs (%)
Drug Use - Ever used any form of cocaine (%)
Drug Use - Ever used heroin (%)
Drug Use - Ever used methamphetamine (%)
Health Insurance - People covered by health insurance (%)
Kidney Conditions-Urology - Avg. # of times urinating at night
Medical Conditions - People with asthma (%)
Medical Conditions - People with anemia (%)
Medical Conditions - People with psoriasis (%)
Medical Conditions - People with overweight (%)
Medical Conditions - Elderly people having difficulties in thinking or remembering (%)
Medical Conditions - People who ever received blood transfusion (%)
Medical Conditions - People having trouble seeing even with glass/contacts (%)
Medical Conditions - People with arthritis (%)
Medical Conditions - People with gout (%)
Medical Conditions - People with congestive heart failure (%)
Medical Conditions - People with coronary heart disease (%)
Medical Conditions - People with angina pectoris (%)
Medical Conditions - People who ever had heart attack (%)
Medical Conditions - People who ever had stroke (%)
Medical Conditions - People with emphysema (%)
Medical Conditions - People with thyroid problem (%)
Medical Conditions - People with chronic bronchitis (%)
Medical Conditions - People with any liver condition (%)
Medical Conditions - People who ever had cancer or malignancy (%)
Mental Health - People who have little interest in doing things (%)
Mental Health - People feeling down, depressed, or hopeless (%)
Mental Health - People who have trouble sleeping or sleeping too much (%)
Mental Health - People feeling tired or having little energy (%)
Mental Health - People with poor appetite or overeating (%)
Mental Health - People feeling bad about themself (%)
Mental Health - People who have trouble concentrating on things (%)
Mental Health - People moving or speaking slowly or too fast (%)
Mental Health - People having thoughts they would be better off dead (%)
Oral Health - Average years since last visit a dentist
Oral Health - People embarrassed because of mouth (%)
Oral Health - People with gum disease (%)
Oral Health - General health of teeth and gums (%)
Oral Health - Average days a week using dental floss/device
Oral Health - Average days a week using mouthwash for dental problem
Oral Health - Average number of teeth
Pesticide Use - Households using pesticides to control insects (%)
Pesticide Use - Households using pesticides to kill weeds (%)
Physical Activity - People doing vigorous-intensity work activities (%)
Physical Activity - People doing moderate-intensity work activities (%)
Physical Activity - People walking or bicycling (%)
Physical Activity - People doing vigorous-intensity recreational activities (%)
Physical Activity - People doing moderate-intensity recreational activities (%)
Physical Activity - Average hours a day doing sedentary activities
Physical Activity - Average hours a day watching TV or videos
Physical Activity - Average hours a day using computer
Physical Functioning - People having limitations keeping them from working (%)
Physical Functioning - People limited in amount of work they can do (%)
Physical Functioning - People that need special equipment to walk (%)
Physical Functioning - People experiencing confusion/memory problems (%)
Physical Functioning - People requiring special healthcare equipment (%)
Prescription Medications - Average number of prescription medicines taking
Preventive Aspirin Use - Adults 40+ taking low-dose aspirin (%)
Reproductive Health - Vaginal deliveries (%)
Reproductive Health - Cesarean deliveries (%)
Reproductive Health - Deliveries resulted in a live birth (%)
Reproductive Health - Pregnancies resulted in a delivery (%)
Reproductive Health - Women breastfeeding newborns (%)
Reproductive Health - Women that had a hysterectomy (%)
Reproductive Health - Women that had both ovaries removed (%)
Reproductive Health - Women that have ever taken birth control pills (%)
Reproductive Health - Women taking birth control pills (%)
Reproductive Health - Women that have ever used Depo-Provera or injectables (%)
Reproductive Health - Women that have ever used female hormones (%)
Sexual Behavior - People 18+ that ever had sex (vaginal, anal, or oral) (%)
Sexual Behavior - Males 18+ that ever had vaginal sex with a woman (%)
Sexual Behavior - Males 18+ that ever performed oral sex on a woman (%)
Sexual Behavior - Males 18+ that ever had anal sex with a woman (%)
Sexual Behavior - Males 18+ that ever had any sex with a man (%)
Sexual Behavior - Females 18+ that ever had vaginal sex with a man (%)
Sexual Behavior - Females 18+ that ever performed oral sex on a man (%)
Sexual Behavior - Females 18+ that ever had anal sex with a man (%)
Sexual Behavior - Females 18+ that ever had any kind of sex with a woman (%)
Sexual Behavior - Average age people first had sex
Sexual Behavior - Average number of female sex partners in lifetime (males 18+)
Sexual Behavior - Average number of female vaginal sex partners in lifetime (males 18+)
Sexual Behavior - Average age people first performed oral sex on a woman (18+)
Sexual Behavior - Average number of woman performed oral sex on in lifetime (18+)
Sexual Behavior - Average number of male sex partners in lifetime (males 18+)
Sexual Behavior - Average number of male anal sex partners in lifetime (males 18+)
Sexual Behavior - Average age people first performed oral sex on a man (18+)
Sexual Behavior - Average number of male oral sex partners in lifetime (18+)
Sexual Behavior - People using protection when performing oral sex (%)
Sexual Behavior - Average number of times people have vaginal or anal sex a year
Sexual Behavior - People having sex without condom (%)
Sexual Behavior - Average number of male sex partners in lifetime (females 18+)
Sexual Behavior - Average number of male vaginal sex partners in lifetime (females 18+)
Sexual Behavior - Average number of female sex partners in lifetime (females 18+)
Sexual Behavior - Circumcised males 18+ (%)
Sleep Disorders - Average hours sleeping at night
Sleep Disorders - People that has trouble sleeping (%)
Smoking-Cigarette Use - People smoking cigarettes (%)
Taste & Smell - People 40+ having problems with smell (%)
Taste & Smell - People 40+ having problems with taste (%)
Taste & Smell - People 40+ that ever had wisdom teeth removed (%)
Taste & Smell - People 40+ that ever had tonsils teeth removed (%)
Taste & Smell - People 40+ that ever had a loss of consciousness because of a head injury (%)
Taste & Smell - People 40+ that ever had a broken nose or other serious injury to face or skull (%)
Taste & Smell - People 40+ that ever had two or more sinus infections (%)
Weight - Average height (inches)
Weight - Average weight (pounds)
Weight - Average BMI
Weight - People that are obese (%)
Weight - People that ever were obese (%)
Weight - People trying to lose weight (%)
Officers per 1,000 residents here:
1.67South Carolina average:
2.34
Latest news from Mount Pleasant, SC collected exclusively by city-data.com from local newspapers, TV, and radio stations
Ancestries: English (22.2%), American (20.6%), Irish (9.1%), German (8.8%), Italian (5.0%), European (4.8%).
Current Local Time:
Land area: 41.9 square miles.
Population density: 2,257 people per square mile (low).
4,689 residents are foreign born (1.8% Europe , 1.4% Asia , 1.1% Latin America , 0.5% North America ).
This town:
5.0%South Carolina:
5.3%
Median real estate property taxes paid for housing units with mortgages in 2022: $2,323 (0.3%)Median real estate property taxes paid for housing units with no mortgage in 2022: $2,282 (0.3%)
Nearest city with pop. 50,000+: Charleston, SC
Nearest city with pop. 200,000+: Charlotte, NC
Nearest city with pop. 1,000,000+: Philadelphia, PA
Nearest cities:
Latitude: 32.82 N, Longitude: 79.85 W
Daytime population change due to commuting: -1,219 (-1.3%)Workers who live and work in this town: 25,815 (53.2%)
Mount Pleasant tourist attractions:
Single-family new house construction building permits:
2022: 478 buildings , average cost: $518,7002021: 698 buildings , average cost: $411,5002020: 660 buildings , average cost: $370,1002019: 547 buildings , average cost: $395,3002018: 781 buildings , average cost: $440,3002017: 776 buildings , average cost: $419,8002016: 959 buildings , average cost: $342,3002015: 940 buildings , average cost: $334,8002014: 739 buildings , average cost: $350,7002013: 796 buildings , average cost: $306,5002012: 492 buildings , average cost: $325,9002011: 269 buildings , average cost: $325,1002010: 226 buildings , average cost: $325,5002009: 161 buildings , average cost: $314,4002008: 230 buildings , average cost: $328,3002007: 361 buildings , average cost: $317,6002006: 829 buildings , average cost: $245,8002005: 845 buildings , average cost: $247,4002004: 960 buildings , average cost: $202,5002003: 930 buildings , average cost: $168,7002002: 885 buildings , average cost: $181,0002001: 790 buildings , average cost: $191,5002000: 1109 buildings , average cost: $172,5001999: 1553 buildings , average cost: $117,5001998: 915 buildings , average cost: $120,1001997: 819 buildings , average cost: $115,200Unemployment in December 2023: Here:
2.1%South Carolina:
3.1%
Population change in the 1990s: +16,364 (+52.4%).
Most common occupations in Mount Pleasant, SC (%)
Both Males Females
Other management occupations, except farmers and farm managers (6.7%)
Other sales and related occupations, including supervisors (6.1%)
Sales representatives, services, wholesale and manufacturing (4.4%)
Registered nurses (4.3%)
Retail sales workers, except cashiers (3.6%)
Preschool, kindergarten, elementary, and middle school teachers (3.5%)
Top executives (2.8%)
Other management occupations, except farmers and farm managers (8.0%)
Other sales and related occupations, including supervisors (7.1%)
Sales representatives, services, wholesale and manufacturing (6.1%)
Top executives (4.3%)
Engineers (4.3%)
Physicians and surgeons (3.6%)
Retail sales workers, except cashiers (3.3%)
Registered nurses (8.0%)
Preschool, kindergarten, elementary, and middle school teachers (7.2%)
Other management occupations, except farmers and farm managers (5.2%)
Other sales and related occupations, including supervisors (5.0%)
Secretaries and administrative assistants (4.9%)
Other office and administrative support workers, including supervisors (4.7%)
Retail sales workers, except cashiers (4.0%)
Tornado activity:
Mount Pleasant-area historical tornado activity is significantly below South Carolina state average. It is 53% smaller than the overall U.S. average.
On 9/11/1960, a category F3 (max. wind speeds 158-206 mph) tornado 3.1 miles away from the Mount Pleasant town center injured 10 people and caused between $500,000 and $5,000,000 in damages.
On 8/29/1964, a category F2 (max. wind speeds 113-157 mph) tornado 3.6 miles away from the town center injured 2 people and caused between $500 and $5000 in damages.
Earthquake activity:
Mount Pleasant-area historical earthquake activity is significantly above South Carolina state average. It is 53% smaller than the overall U.S. average. On 11/22/1974 at 05:25:55, a magnitude 4.7 (4.7 MB, Class: Light, Intensity: IV - V) earthquake occurred 18.2 miles away from Mount Pleasant center On 8/21/1992 at 16:31:55, a magnitude 4.4 (4.1 MB, 4.1 LG, 4.4 LG, Depth: 6.2 mi) earthquake occurred 22.2 miles away from the city center On 8/2/1974 at 08:52:09, a magnitude 4.9 (4.3 MB, 4.9 LG) earthquake occurred 169.0 miles away from Mount Pleasant center On 8/23/2011 at 17:51:04, a magnitude 5.8 (5.8 MW, Depth: 3.7 mi, Class: Moderate, Intensity: VI - VII) earthquake occurred 367.9 miles away from Mount Pleasant center On 11/11/2002 at 23:39:29, a magnitude 4.0 (4.0 MB, Depth: 1.5 mi) earthquake occurred 29.5 miles away from Mount Pleasant center On 4/17/1995 at 13:45:57, a magnitude 3.9 (3.9 LG, Depth: 6.2 mi, Class: Light, Intensity: II - III) earthquake occurred 15.5 miles away from the city center Magnitude types: regional Lg-wave magnitude (LG), body-wave magnitude (MB), moment magnitude (MW) Natural disasters: The number of natural disasters in Charleston County (17) is near the US average (15).Major Disasters (Presidential) Declared: 7Emergencies Declared: 6Hurricanes: 9, Floods: 2, Storms: 2, Tropical Storms: 2, Winter Storms: 2, Drought: 1, Other: 1 (Note: some incidents may be assigned to more than one category). Hospitals and medical centers in Mount Pleasant: CAROLINA HOSPICE CARE INC (410 MILL ST SUITE 401) EAST COOPER MEDICAL CENTER (Proprietary, provides emergency services, 2000 HOSPITAL DR) MOUNT PLEASANT HOSPITAL (Voluntary non-profit - Private, 3500 HIGHWAY 17 NORTH) FRANKE HEALTH CARE CENTER (1885 RIFLE RANGE ROAD)
SANDPIPER REHAB AND NURSING (1049 ANNA KNAPP BOULEVARD)
FRESENIUS MEDICAL CARE CHARLESTON COUNTY (901 VON KOLNITZ RD)
MT PLEASANT DIALYSIS CENTER (1028 E-WALL STREET)
Amtrak station near Mount Pleasant: 10 miles: CHARLESTON (N. CHARLESTON, 4565 GAYNOR AVE.) Services: ticket office, fully wheelchair accessible, enclosed waiting area, public restrooms, public payphones, vending machines, free short-term parking, free long-term parking, call for car rental service, call for taxi service.
Colleges/universities with over 2000 students nearest to Mount Pleasant:
College of Charleston (about 7 miles; Charleston, SC ; Full-time enrollment: 10,974)
Medical University of South Carolina (about 7 miles; Charleston, SC ; FT enrollment: 2,138)
Citadel Military College of South Carolina (about 7 miles; Charleston, SC ; FT enrollment: 3,683)
Trident Technical College (about 13 miles; Charleston, SC ; FT enrollment: 13,125)
Charleston Southern University (about 18 miles; Charleston, SC ; FT enrollment: 3,012)
South Carolina State University (about 75 miles; Orangeburg, SC ; FT enrollment: 3,481)
Orangeburg Calhoun Technical College (about 76 miles; Orangeburg, SC ; FT enrollment: 2,113)
Public high school in Mount Pleasant: WANDO HIGH Students: 3,382, Location: 1000 WARRIOR WAY, Grades: 9-12)Biggest public elementary/middle schools in Mount Pleasant: THOMAS C. CARIO MIDDLE Students: 1,284, Location: 3500 THOMAS CARIO BOULEVARD, Grades: 6-8)LAUREL HILL PRIMARY Students: 1,113, Location: 3100 THOMAS CARIO BOULEVARD, Grades: PK-2)CHARLES PINCKNEY ELEMENTARY Students: 1,027, Location: 3300 THOMAS CARIO BOULEVARD, Grades: 3-5)MOULTRIE MIDDLE Students: 939, Location: 645 COLEMAN BOULEVARD, Grades: 6-8)BELLE HALL ELEMENTARY Students: 813, Location: 385 EGYPT ROAD, Grades: PK-5)JENNIE MOORE ELEMENTARY Students: 724, Location: 942 WHIPPLE ROAD, Grades: PK-5)MAMIE WHITESIDES ELEMENTARY Students: 634, Location: 1565 RIFLE RANGE ROAD, Grades: PK-5)JAMES B. EDWARDS ELEMENTARY Students: 568, Location: 885 VON KOLNITZ ROAD, Grades: PK-5)MT. PLEASANT ACADEMY Students: 500, Location: 605 CENTER STREET, Grades: PK-5)LAING MIDDLE Students: 495, Location: 1560 MATHIS FERRY ROAD, Grades: 6-8)See full list of schools located in Mount Pleasant
Notable locations in Mount Pleasant: (A) , Anna Knapp Plaza (B) , Brookgreen Town Center (C) , Center Oak Plaza (D) , Fairmont Plaza (E) , Market Center (F) , Mount Pleasant Town Center (G) , National Crossing (H) , Northcutt Plaza (I) , Queensborough Center (J) , Shoppes at Park West (K) , Shops of Mount Pleasant (L) , The Commons (M) , Wando Crossing (N) , Wando Plantation (O) , Patriots Point Golf Links (P) , Snee Farm Country Club Office (Q) , Charleston Harbor Marina (R) , Tolers Cove Marina (S) , Crab Bank (T) . Display/hide their locations on the map
Shopping Centers: (1) , Mount Pleasant Square Shopping Center (2) , Seaside Farms Shopping Center (3) , Shelmore Shopping Center (4) , Sweetgrass Shopping Center (5) , Village Pointe Shopping Center (6) , Sea Island Shopping Center (7) , Patriots Plaza Shopping Center (8) , Moultrie Shopping Center (9) . Display/hide their locations on the map
Churches in Mount Pleasant include: (A) , Ebenezer Church (B) , Freewill Church (C) , Friendship African Methodist Episcopal Church (D) , Good Shepherd Church (E) , Goodwill Church (F) , Greater Olive Branch Church (G) , Holy Trinity Church (H) , Long Point Baptist Church (I) . Display/hide their locations on the map
Cemeteries: (1) , Confederate Cemetery (2) , Venning Cemetery (3) . Display/hide their locations on the map
Lakes and reservoirs: (A) , Lake Wackedaw (B) . Display/hide their locations on the map
Rivers and creeks: (A) , Wando River (B) , Rathall Creek (C) , Wagner Creek (D) , Molasses Creek (E) , Toomer Creek (F) , Hobcaw Creek (G) , Darrell Creek (H) , Alston Creek (I) . Display/hide their locations on the map
Parks in Mount Pleasant include: (1) , Mount Pleasant Historic District (2) , USS Yorktown State Park (3) . Display/hide their locations on the map
Tourist attractions: (1) , Yorktown (Museums; Patriots Point) (2) , Charles Pinckney National Historic Site (Historical Places & Services; 1240 Long Point Road) (3) , Carolina Coin Amusement (Amusement & Theme Parks; 1090 Johnnie Dodds Boulevard Suite C) (4) , Bella Vita Retreat (1115 Shadow Lake Circle) (5) , Spinz (613 Johnnie Dodds Boulevard) (6) , McRae William H (1235 Long Point Road) (7) , Boone Hall Plantation (Boone Hall Plantatio) (8) , Coastal Expeditions Tours Kayak (Tours & Charters; 514 Mill Street Suite B) (9) . Display/hide their approximate locations on the map
Hotels: (1) , Quality Inn & Suites (196 Patriots Point Road) (2) , Comfort Inn East (310 US 17 Bypass) (3) , Hampton Inn Charleston-Mt Pleasant-Patri (255 Sessions Way) (4) , Days Inn (261 Johnnie Dodds Boulevard) (5) , Extended Stayamerica (304 Wingo Way) (6) , Hilton Charleston Harbor Resort & Marina (20 Patriots Point Road) (7) , Hampton Inn & Suites Isle of Palms (1104 Isle Of Palms Connector) (8) , Fort Moultrie Motel (1330 Stuart Engals Boulevard) (9) . Display/hide their approximate locations on the map
Court: (1) . Display/hide its approximate location on the map
Birthplace of: Abraham J. Turner - Army general, Dexter Coakley - Football player, Temoc Suarez - Soccer player-coach, Amanda Baker - Television actor, Ben Hollingsworth - Soccer player, Kevin Warzynski - College basketball player (Kent State Golden Flashes).
Charleston County has a predicted average indoor radon screening level less than 2 pCi/L (pico curies per liter) - Low Potential Average household size: This town:
2.4 peopleSouth Carolina:
2.5 people
Percentage of family households: This town:
65.0%Whole state:
67.5%
Percentage of households with unmarried partners: This town:
4.9%Whole state:
6.0%
Likely homosexual households (counted as self-reported same-sex unmarried-partner households)
Lesbian couples: 0.3% of all households Gay men: 0.3% of all households
People in group quarters in Mount Pleasant in 2010:
544 people in nursing facilities/skilled-nursing facilities
22 people in maritime/merchant vessels
2 people in other noninstitutional facilities
People in group quarters in Mount Pleasant in 2000:
496 people in nursing homes
73 people in wards in general hospitals for patients who have no usual home elsewhere
53 people in other noninstitutional group quarters
39 people in homes or halfway houses for drug/alcohol abuse
2 people in religious group quarters
Banks with most branches in Mount Pleasant (2011 data):
Wells Fargo Bank, National Association: Long Point Road Branch, Mt Pleasant Towne Centre Night Depos, Mount Pleasant Main, Wando Crossing Branch, Mount Pleasant By-Pass Branch, The Market At Oakland Branch. Info updated 2011/04/05: Bank assets: $1,161,490.0 mil, Deposits: $905,653.0 mil, headquarters in Sioux Falls, SD, positive income , 6395 total offices , Holding Company: Wells Fargo & Company
SouthCoast Community Bank: Southcoast Community Bank, Coleman Branch, Messenger Service Branch, I-Bank, Park West Branch. Info updated 2006/11/03: Bank assets: $425.3 mil, Deposits: $318.7 mil, local headquarters , negative income in the last year , Commercial Lending Specialization, 12 total offices , Holding Company: Southcoast Financial Corporation
First Federal Savings and Loan Association of Charleston: 602 Hwy 17-N By-Pass Branch, 822 Coleman Boulevard Branch, Mount Pleasant Branch, Long Point Road Branch, Proprietors Place Branch. Info updated 2012/02/24: Bank assets: $3,140.4 mil, Deposits: $2,278.8 mil, headquarters in Charleston, SC, negative income in the last year , Mortgage Lending Specialization, 69 total offices
SunTrust Bank: Mathis Ferry Branch, Mount Pleasant Square Bi-Lo Branch, Ivy Hall Branch. Info updated 2010/05/27: Bank assets: $171,291.7 mil, Deposits: $129,833.2 mil, headquarters in Atlanta, GA, positive income , Commercial Lending Specialization, 1716 total offices , Holding Company: Suntrust Banks, Inc.
First Citizens Bank and Trust Company, Inc.: Coleman Blvd Branch, 17 North Branch, Johnnie Dodds Branch. Info updated 2011/08/24: Bank assets: $8,104.0 mil, Deposits: $6,880.8 mil, headquarters in Columbia, SC, positive income , 197 total offices , Holding Company: First Citizens Bancorporation, Inc.
Bank of America, National Association: Anna Knapp Branch, Brookgreen Town Center Branch, Sweetgrass Branch. Info updated 2009/11/18: Bank assets: $1,451,969.3 mil, Deposits: $1,077,176.8 mil, headquarters in Charlotte, NC, positive income , 5782 total offices , Holding Company: Bank Of America Corporation
Tidelands Bank: at 875 Lowcountry Boulevard, branch established on 2003/10/06; Park West Branch at 1100 Park West Boulevard, branch established on 2007/06/30. Info updated 2011/10/13: Bank assets: $532.3 mil, Deposits: $446.6 mil, local headquarters , negative income in the last year , Commercial Lending Specialization, 7 total offices , Holding Company: Tidelands Bancshares, Inc.
Regions Bank: Mt. Pleasant Branch at 1210 Ben Sawyer Boulevard, branch established on 1996/09/30; Towne Centre Branch at 1200 Two Islands Court, branch established on 2003/03/03. Info updated 2011/02/24: Bank assets: $123,368.2 mil, Deposits: $98,301.3 mil, headquarters in Birmingham, AL, positive income , Commercial Lending Specialization, 1778 total offices , Holding Company: Regions Financial Corporation
Branch Banking and Trust Company: Mt. Pleasant Branch at 885 Johnnie Dodds Boulevard, branch established on 1933/01/01; Mount Pleasant North Branch at 2692 N. Highway 17, branch established on 2001/11/29. Info updated 2010/03/29: Bank assets: $168,867.6 mil, Deposits: $127,549.5 mil, headquarters in Winston Salem, NC, positive income , Commercial Lending Specialization, 1793 total offices , Holding Company: Bb&T Corporation
13 other banks with 14 local branches
For population 15 years and over in Mount Pleasant:
Never married: 23.7%Now married: 61.7%Separated: 1.7%Widowed: 3.8%Divorced: 9.2% For population 25 years and over in Mount Pleasant:
High school or higher: 96.5%Bachelor's degree or higher: 66.8%Graduate or professional degree: 26.8%Unemployed: 2.2%Mean travel time to work (commute): 17.6 minutes
Education Gini index (Inequality in education) Here:
8.8South Carolina average:
11.1
Religion statistics for Mount Pleasant, SC (based on Charleston County data)
Religion Adherents Congregations Evangelical Protestant 77,602 223 Mainline Protestant 47,209 106 Black Protestant 37,531 103 Catholic 26,003 19 Other 8,688 24 Orthodox 850 2 None 152,326 -
Source: Clifford Grammich, Kirk Hadaway, Richard Houseal, Dale E.Jones, Alexei Krindatch, Richie Stanley and Richard H.Taylor. 2012. 2010 U.S.Religion Census: Religious Congregations & Membership Study. Association of Statisticians of American Religious Bodies. Jones, Dale E., et al. 2002. Congregations and Membership in the United States 2000. Nashville, TN: Glenmary Research Center. Graphs represent county-level data
Food Environment Statistics: Number of grocery stores : 88Charleston County :
2.56 / 10,000 pop.State :
1.99 / 10,000 pop.
Number of supercenters and club stores : 5Here :
0.15 / 10,000 pop.South Carolina :
0.15 / 10,000 pop.
Number of convenience stores (no gas) : 19Charleston County :
0.55 / 10,000 pop.South Carolina :
0.85 / 10,000 pop.
Number of convenience stores (with gas) : 140Charleston County :
4.08 / 10,000 pop.South Carolina :
5.38 / 10,000 pop.
Number of full-service restaurants : 393This county :
11.44 / 10,000 pop.South Carolina :
7.75 / 10,000 pop.
Adult diabetes rate : Charleston County :
8.8%South Carolina :
10.6%
Adult obesity rate : Charleston County :
25.5%State :
29.4%
Low-income preschool obesity rate : This county :
13.7%South Carolina :
13.4%
Health and Nutrition: Healthy diet rate : This city:
54.4%South Carolina:
49.2%
Average overall health of teeth and gums : Here:
54.0%South Carolina:
46.2%
Average BMI : This city:
28.1South Carolina:
29.0
People feeling badly about themselves : Mount Pleasant:
19.4%State:
20.4%
People not drinking alcohol at all : This city:
8.9%South Carolina:
11.0%
Average hours sleeping at night : Overweight people : Mount Pleasant:
32.9%South Carolina:
34.4%
General health condition : Here:
61.6%South Carolina:
55.6%
Average condition of hearing : Mount Pleasant:
81.7%South Carolina:
79.9%
More about Health and Nutrition of Mount Pleasant, SC Residents
Local government employment and payroll (March 2022)
Function
Full-time employees
Monthly full-time payroll
Average yearly full-time wage
Part-time employees
Monthly part-time payroll
Police Protection - Officers
153 $761,694 $59,741 0 $0 Firefighters
128 $754,026 $70,690 0 $0 Other Government Administration
64 $335,157 $62,842 16 $23,334 Parks and Recreation
58 $248,988 $51,515 93 $84,654 Solid Waste Management
51 $202,592 $47,669 0 $0 Sewerage
39 $160,317 $49,328 0 $0 Financial Administration
33 $177,774 $64,645 0 $0 Police - Other
19 $78,769 $49,749 0 $0 Other and Unallocable
16 $80,414 $60,311 0 $0 Judicial and Legal
15 $75,095 $60,076 6 $12,055 Streets and Highways
10 $72,403 $86,884 0 $0 Fire - Other
2 $8,359 $50,154 2 $3,100 Housing and Community Development (Local)
1 $3,858 $46,296 0 $0 Natural Resources
1 $5,961 $71,532 0 $0
Totals for Government
590 $2,965,405 $60,313 117 $123,143
Mount Pleasant government finances - Expenditure in 2021 (per resident):
Construction - Sewerage: $28,024,000 ($296.41)
Water Utilities: $11,174,000 ($118.19)Regular Highways: $5,072,000 ($53.65)Local Fire Protection: $4,842,000 ($51.21)Solid Waste Management: $2,513,000 ($26.58)Parks and Recreation: $696,000 ($7.36)Central Staff Services: $508,000 ($5.37)Police Protection: $4,000 ($0.04)Current Operations - Police Protection: $16,435,000 ($173.83)
Sewerage: $15,959,000 ($168.80)Solid Waste Management: $15,892,000 ($168.09)Water Utilities: $12,767,000 ($135.04)Local Fire Protection: $12,673,000 ($134.04)General - Other: $10,054,000 ($106.34)Parks and Recreation: $6,879,000 ($72.76)Regular Highways: $6,179,000 ($65.36)Central Staff Services: $6,078,000 ($64.29)Financial Administration: $3,291,000 ($34.81)Judicial and Legal Services: $1,838,000 ($19.44)Natural Resources - Other: $198,000 ($2.09)General - Interest on Debt: $2,422,000 ($25.62)
Intergovernmental to Local - Other - Water Utilities: $1,517,000 ($16.05)
Other - Natural Resources - Other: $465,000 ($4.92)Other - Sewerage: $292,000 ($3.09)Other - Police Protection: $151,000 ($1.60)Other - Local Fire Protection: $60,000 ($0.63)Other Capital Outlay - General - Other: $2,298,000 ($24.31)
Sewerage: $808,000 ($8.55)Water Utilities: $808,000 ($8.55)Regular Highways: $760,000 ($8.04)Police Protection: $447,000 ($4.73)Local Fire Protection: $171,000 ($1.81)Parks and Recreation: $146,000 ($1.54)Financial Administration: $95,000 ($1.00)Total Salaries and Wages: $44,022,000 ($465.62)
Water Utilities - Interest on Debt: $5,830,000 ($61.66)
Mount Pleasant government finances - Revenue in 2021 (per resident):
Charges - Sewerage: $30,754,000 ($325.28)
Parks and Recreation: $2,927,000 ($30.96)Other: $11,000 ($0.12)Federal Intergovernmental - Other: $7,018,000 ($74.23)
Highways: $118,000 ($1.25)Local Intergovernmental - Other: $1,021,000 ($10.80)
Public Welfare: $603,000 ($6.38)General Local Government Support: $432,000 ($4.57)Highways: $52,000 ($0.55)Sewerage: $50,000 ($0.53)Water Utilities: $34,000 ($0.36)Miscellaneous - General Revenue - Other: $15,598,000 ($164.98)
Special Assessments: $3,724,000 ($39.39)Sale of Property: $719,000 ($7.60)Interest Earnings: $601,000 ($6.36)Fines and Forfeits: $479,000 ($5.07)Donations From Private Sources: $46,000 ($0.49)Revenue - Water Utilities: $24,848,000 ($262.82)
State Intergovernmental - General Local Government Support: $3,710,000 ($39.24)
Other: $907,000 ($9.59)Highways: $167,000 ($1.77)Sewerage: $40,000 ($0.42)Water Utilities: $28,000 ($0.30)Tax - Property: $36,012,000 ($380.90)
Occupation and Business License - Other: $26,180,000 ($276.91)General Sales and Gross Receipts: $11,492,000 ($121.55)Other Selective Sales: $8,262,000 ($87.39)Public Utility License: $7,822,000 ($82.73)Other License: $1,268,000 ($13.41)
Mount Pleasant government finances - Debt in 2021 (per resident):
Long Term Debt - Outstanding Unspecified Public Purpose: $254,908,000 ($2696.16)
Beginning Outstanding - Unspecified Public Purpose: $254,241,000 ($2689.10)Issue, Unspecified Public Purpose: $20,470,000 ($216.51)Retired Unspecified Public Purpose: $19,803,000 ($209.46)
Mount Pleasant government finances - Cash and Securities in 2021 (per resident):
Bond Funds - Cash and Securities: $18,991,000 ($200.87)
Other Funds - Cash and Securities: $295,704,000 ($3127.65)
Sinking Funds - Cash and Securities: $2,882,000 ($30.48)
10.38% of this county's 2021 resident taxpayers lived in other counties in 2020 ($106,855 average adjusted gross income )
Here:
10.38%South Carolina average:
8.89%
0.04% of residents moved from foreign countries ($264 average AGI )Charleston County:
0.04%South Carolina average:
0.04%
Top counties from which taxpayers relocated into this county between 2020 and 2021:
9.80% of this county's 2020 resident taxpayers moved to other counties in 2021 ($68,552 average adjusted gross income )
Here:
9.80%South Carolina average:
7.46%
0.05% of residents moved to foreign countries ($339 average AGI )Charleston County:
0.05%South Carolina average:
0.03%
Top counties to which taxpayers relocated from this county between 2020 and 2021:
Businesses in Mount Pleasant, SC
Name Count Name Count
AT&T 1 McDonald's 3 Advance Auto Parts 1 Men's Wearhouse 1 Ann Taylor 1 New Balance 4 Applebee's 1 Nike 4 Arby's 1 Office Depot 1 Banana Republic 1 Old Navy 1 Baskin-Robbins 1 Pier 1 Imports 1 Best Western 1 Pizza Hut 3 Blockbuster 2 Publix Super Markets 3 Burger King 1 Qdoba Mexican Grill 1 CVS 5 Quality 1 Cache 1 Red Roof Inn 1 Chevrolet 1 Rite Aid 3 Chick-Fil-A 2 Rodeway Inn 1 Chico's 1 SONIC Drive-In 2 Circle K 3 Sleep Inn 1 Coldwater Creek 1 Sprint Nextel 2 Comfort Suites 1 Starbucks 4 Domino's Pizza 1 Subway 4 Dunkin Donuts 2 T.G.I. Driday's 1 FedEx 9 Taco Bell 2 GNC 1 Talbots 2 GameStop 1 Target 1 Gap 1 The Room Place 1 H&R Block 2 Tire Kingdom 1 Hilton 3 True Value 1 Holiday Inn 2 U-Haul 1 IHOP 1 UPS 19 JoS. A. Bank 1 Verizon Wireless 2 Just Tires 1 Volkswagen 1 KFC 1 Waffle House 1 Kohl's 1 Walgreens 1 Lowe's 1 Walmart 1 MainStay 1 Whole Foods Market 1
Strongest AM radio stations in Mount Pleasant:
WZJY (1480 AM; 1 kW; MOUNT PLEASANT, SC; Owner: LEVAS COMMUNICATIONS, LLC)
WIQB (1050 AM; 25 kW; CONWAY, SC; Owner: CUMULUS LICENSING CORP.)
WTMA (1250 AM; 5 kW; CHARLESTON, SC; Owner: CITADEL BROADCASTING COMPANY)
WSCC (730 AM; 5 kW; CHARLESTON, SC; Owner: CITICASTERS LICENSES, L.P.)
WXTC (1390 AM; 5 kW; CHARLESTON, SC)
WQSC (1340 AM; 1 kW; CHARLESTON, SC; Owner: KIRKMAN BROADCASTING, INC,)
WQNT (1450 AM; 1 kW; CHARLESTON, SC; Owner: KIRKMAN BROADCASTING, INC.)
WQTK (950 AM; 10 kW; MONCKS CORNER, SC; Owner: KIRKMAN BROADCASTING, INC.)
WTMZ (910 AM; 0 kW; DORCHESTER TERR.-BRE, SC; Owner: CITADEL BROADCASTING COMPANY)
WCEO (840 AM; daytime; 50 kW; COLUMBIA, SC; Owner: EASTERN BROADCASTING GROUP, INC.)
WBAJ (890 AM; daytime; 50 kW; BLYTHEWOOD, SC; Owner: FAMILY FIRST)
WQIZ (810 AM; daytime; 5 kW; ST. GEORGE, SC; Owner: RADIO PROPERTIES, LLC)
WLFJ (660 AM; daytime; 50 kW; GREENVILLE, SC; Owner: CLEAR CHANNEL BROADCASTING LICENSES, INC.)
Strongest FM radio stations in Mount Pleasant:
WEZL (103.5 FM; CHARLESTON, SC; Owner: CITICASTERS LICENSES, L.P.)
WFCH (88.5 FM; CHARLESTON, SC; Owner: FAMILY STATIONS, INC.)
WSSX-FM (95.1 FM; CHARLESTON, SC; Owner: CITADEL BROADCASTING COMPANY)
WXLY (102.5 FM; NORTH CHARLESTON, SC; Owner: CITICASTERS LICENSES, L.P.)
WRFQ (104.5 FM; MOUNT PLEASANT, SC; Owner: CITICASTERS LICENSES, L.P.)
W220CN (91.9 FM; CHARLESTON, SC; Owner: RADIO TRAINING NETWORK, INC.)
W205BJ (88.9 FM; CHARLESTON, SC; Owner: CALVARY CHAPEL OF TWIN FALLS, INC.)
WSUY (96.9 FM; CHARLESTON, SC; Owner: CITADEL BROADCASTING COMPANY)
WAVF (96.1 FM; HANAHAN, SC; Owner: APEX BROADCASTING, INC.)
WSCI (89.3 FM; CHARLESTON, SC; Owner: SOUTH CAROLINA EDUCATIONAL TV COMMISSION)
WWWZ (93.3 FM; SUMMERVILLE, SC; Owner: CITADEL BROADCASTING COMPANY)
WALC (100.5 FM; CHARLESTON, SC; Owner: CITICASTERS LICENSES, L.P.)
WSSP (94.3 FM; GOOSE CREEK, SC; Owner: CLEAR CHANNEL BROADCASTING LICENSES, INC.)
WYBB (98.1 FM; FOLLY BEACH, SC; Owner: L.M. COMMUNICATIONS OF SOUTH CAROLINA, INC.)
WCOO (105.5 FM; KIAWAH ISLAND, SC; Owner: L.M. COMMUNICATIONS II OF SOUTH CAROLINA, INC.)
WMGL (101.7 FM; RAVENEL, SC; Owner: CITADEL BROADCASTING COMPANY)
WCSQ (92.5 FM; MONCKS CORNER, SC; Owner: APEX BROADCASTING, INC.)
WNKT (107.5 FM; ST. GEORGE, SC; Owner: CITADEL BROADCASTING COMPANY)
WJNI (106.3 FM; LADSON, SC; Owner: THOMAS B. DANIELS)
WJZX (99.7 FM; HOLLYWOOD, SC; Owner: APEX BROADCASTING, INC.)
TV broadcast stations around Mount Pleasant:
W21BX (Channel 21; CHARLESTON, SC; Owner: TRINITY BROADCASTING NETWORK)
WJRB-LP (Channel 18; CHARLESTON, SC; Owner: RAUL INFANTE, JR.)
WCBD-TV (Channel 2; CHARLESTON, SC; Owner: MEDIA GENERAL COMMUNICATIONS, INC.)
WCHD-LP (Channel 49; CHARLESTON, SC; Owner: IZZO LIVING TRUST)
WCSC-TV (Channel 5; CHARLESTON, SC; Owner: WCSC, INC.)
WITV (Channel 7; CHARLESTON, SC; Owner: SOUTH CAROLINA EDUCATIONAL TV COMMISSION)
WCIV (Channel 4; CHARLESTON, SC; Owner: WCIV, LLC)
WMMP (Channel 36; CHARLESTON, SC; Owner: WMMP LICENSEE L.P.)
WTAT-TV (Channel 24; CHARLESTON, SC; Owner: WTAT LICENSEE, LLC)
WJEA-LP (Channel 12; CHARLESTON, SC; Owner: CHARLES S. NAMEY)
WJWJ-TV (Channel 16; BEAUFORT, SC; Owner: SOUTH CAROLINA EDUCATIONAL TV COMMISSION)
WJNI-LP (Channel 57; NORTH CHARLESTON, SC; Owner: THOMAS B. DANIELS)
WTBD-LP (Channel 22; NORTH CHARLESTON, SC; Owner: THOMAS B. DANIELS)
W26CF (Channel 26; SUMMERVILLE, SC; Owner: DOVE BROADCASTING, INC.)
National Bridge Inventory (NBI) Statistics 66 Number of bridges4,944ft / 1,507m Total length $11,898,000 Total costs899,399 Total average daily traffic67,451 Total average daily truck traffic
New bridges - historical statistics
1 1940-1949 2 1970-1979 17 1980-1989 29 1990-1999 14 2000-2009 3 2010-2019
See full National Bridge Inventory statistics for Mount Pleasant, SC
Home Mortgage Disclosure Act Aggregated Statistics For Year 2009(Based on 2 full and 4 partial tracts) A) FHA, FSA/RHS & VA B) Conventional C) Refinancings D) Home Improvement Loans F) Non-occupant Loans on G) Loans On Manufactured Number Average Value Number Average Value Number Average Value Number Average Value Number Average Value Number Average Value
LOANS ORIGINATED 203 $238,541 554 $316,932 2,253 $268,459 50 $157,567 248 $259,287 3 $138,043 APPLICATIONS APPROVED, NOT ACCEPTED 6 $240,912 33 $303,982 134 $313,182 5 $117,780 19 $256,051 1 $124,760 APPLICATIONS DENIED 36 $216,330 73 $307,111 623 $308,191 23 $132,002 62 $231,235 3 $91,087 APPLICATIONS WITHDRAWN 28 $238,666 93 $310,671 436 $285,957 4 $137,785 51 $233,834 0 $0 FILES CLOSED FOR INCOMPLETENESS 4 $224,270 17 $378,151 114 $262,716 3 $209,393 15 $225,886 0 $0
Aggregated Statistics For Year 2008(Based on 2 full and 4 partial tracts) A) FHA, FSA/RHS & VA B) Conventional C) Refinancings D) Home Improvement Loans E) Loans on Dwellings For 5+ Families F) Non-occupant Loans on G) Loans On Manufactured Number Average Value Number Average Value Number Average Value Number Average Value Number Average Value Number Average Value Number Average Value
LOANS ORIGINATED 91 $235,218 847 $309,341 1,128 $283,042 80 $177,279 3 $8,235,253 285 $269,669 4 $111,810 APPLICATIONS APPROVED, NOT ACCEPTED 3 $246,037 82 $340,612 164 $278,289 12 $99,836 0 $0 29 $255,103 3 $106,743 APPLICATIONS DENIED 14 $186,881 108 $366,496 431 $277,980 51 $123,474 1 $143,220 70 $282,021 7 $69,014 APPLICATIONS WITHDRAWN 12 $236,741 103 $336,214 213 $280,318 10 $212,441 0 $0 34 $266,910 0 $0 FILES CLOSED FOR INCOMPLETENESS 6 $199,568 19 $386,429 63 $295,323 3 $276,483 0 $0 12 $417,253 0 $0
Aggregated Statistics For Year 2007(Based on 2 full and 4 partial tracts) A) FHA, FSA/RHS & VA B) Conventional C) Refinancings D) Home Improvement Loans F) Non-occupant Loans on G) Loans On Manufactured Number Average Value Number Average Value Number Average Value Number Average Value Number Average Value Number Average Value
LOANS ORIGINATED 10 $223,149 1,440 $302,808 1,297 $289,166 112 $179,246 440 $265,197 9 $59,557 APPLICATIONS APPROVED, NOT ACCEPTED 0 $0 123 $277,255 170 $258,856 21 $154,277 41 $256,854 4 $60,350 APPLICATIONS DENIED 4 $207,910 185 $350,350 474 $281,124 74 $169,205 86 $292,344 11 $86,805 APPLICATIONS WITHDRAWN 1 $172,380 159 $312,776 245 $288,029 15 $152,150 47 $295,594 1 $11,460 FILES CLOSED FOR INCOMPLETENESS 0 $0 28 $312,444 98 $289,928 4 $118,898 11 $208,589 0 $0
Aggregated Statistics For Year 2006(Based on 2 full and 4 partial tracts) A) FHA, FSA/RHS & VA B) Conventional C) Refinancings D) Home Improvement Loans E) Loans on Dwellings For 5+ Families F) Non-occupant Loans on G) Loans On Manufactured Number Average Value Number Average Value Number Average Value Number Average Value Number Average Value Number Average Value Number Average Value
LOANS ORIGINATED 10 $268,176 1,980 $274,378 1,447 $275,727 139 $121,720 1 $13,283,200 656 $225,822 12 $57,424 APPLICATIONS APPROVED, NOT ACCEPTED 4 $173,132 223 $247,554 161 $212,044 30 $85,498 0 $0 84 $214,319 9 $98,442 APPLICATIONS DENIED 4 $159,530 244 $269,070 419 $248,949 73 $97,208 1 $157,500 83 $211,731 18 $63,438 APPLICATIONS WITHDRAWN 0 $0 242 $288,798 303 $249,871 31 $139,631 0 $0 82 $217,001 1 $90,100 FILES CLOSED FOR INCOMPLETENESS 0 $0 32 $297,240 103 $261,277 7 $63,173 0 $0 11 $276,823 1 $70,310
Aggregated Statistics For Year 2005(Based on 2 full and 4 partial tracts) A) FHA, FSA/RHS & VA B) Conventional C) Refinancings D) Home Improvement Loans E) Loans on Dwellings For 5+ Families F) Non-occupant Loans on G) Loans On Manufactured Number Average Value Number Average Value Number Average Value Number Average Value Number Average Value Number Average Value Number Average Value
LOANS ORIGINATED 13 $226,042 2,692 $239,973 1,686 $256,929 108 $131,182 2 $1,586,080 870 $201,489 12 $91,387 APPLICATIONS APPROVED, NOT ACCEPTED 1 $38,070 226 $247,120 176 $240,665 25 $78,173 0 $0 72 $228,215 10 $58,090 APPLICATIONS DENIED 4 $102,188 329 $231,186 467 $236,749 72 $79,680 0 $0 109 $197,977 34 $69,402 APPLICATIONS WITHDRAWN 1 $98,060 289 $268,872 302 $232,564 53 $161,260 0 $0 88 $216,978 3 $83,063 FILES CLOSED FOR INCOMPLETENESS 1 $110,410 72 $214,192 194 $241,456 18 $65,962 0 $0 12 $162,156 5 $83,564
Aggregated Statistics For Year 2004(Based on 2 full and 4 partial tracts) A) FHA, FSA/RHS & VA B) Conventional C) Refinancings D) Home Improvement Loans E) Loans on Dwellings For 5+ Families F) Non-occupant Loans on G) Loans On Manufactured Number Average Value Number Average Value Number Average Value Number Average Value Number Average Value Number Average Value Number Average Value
LOANS ORIGINATED 12 $167,291 2,023 $225,426 1,463 $215,046 98 $107,228 3 $1,117,043 467 $218,647 10 $69,836 APPLICATIONS APPROVED, NOT ACCEPTED 1 $209,790 175 $208,214 182 $211,954 11 $91,214 0 $0 40 $151,182 10 $56,391 APPLICATIONS DENIED 2 $163,435 260 $170,937 476 $193,469 86 $72,775 0 $0 56 $225,478 42 $64,250 APPLICATIONS WITHDRAWN 2 $170,470 208 $221,214 358 $201,753 40 $93,424 0 $0 35 $169,843 1 $86,450 FILES CLOSED FOR INCOMPLETENESS 0 $0 43 $218,208 141 $195,417 12 $54,380 0 $0 11 $180,467 3 $54,510
Aggregated Statistics For Year 2003(Based on 2 full and 4 partial tracts) A) FHA, FSA/RHS & VA B) Conventional C) Refinancings D) Home Improvement Loans E) Loans on Dwellings For 5+ Families F) Non-occupant Loans on Number Average Value Number Average Value Number Average Value Number Average Value Number Average Value Number Average Value
LOANS ORIGINATED 50 $174,533 1,743 $207,053 3,540 $188,454 59 $65,837 3 $5,786,403 456 $166,112 APPLICATIONS APPROVED, NOT ACCEPTED 4 $188,355 119 $202,997 291 $178,292 12 $42,942 0 $0 28 $217,745 APPLICATIONS DENIED 3 $108,310 161 $174,231 555 $177,483 40 $56,121 0 $0 40 $168,755 APPLICATIONS WITHDRAWN 5 $173,976 189 $195,971 369 $179,849 10 $55,048 1 $247,030 52 $160,058 FILES CLOSED FOR INCOMPLETENESS 0 $0 33 $247,788 82 $198,897 7 $55,220 0 $0 6 $122,045
Aggregated Statistics For Year 2002(Based on 2 full and 4 partial tracts) A) FHA, FSA/RHS & VA B) Conventional C) Refinancings D) Home Improvement Loans E) Loans on Dwellings For 5+ Families F) Non-occupant Loans on Number Average Value Number Average Value Number Average Value Number Average Value Number Average Value Number Average Value
LOANS ORIGINATED 73 $160,365 1,450 $203,706 2,440 $190,442 49 $40,259 2 $374,385 360 $193,959 APPLICATIONS APPROVED, NOT ACCEPTED 1 $99,990 95 $195,173 196 $194,830 14 $40,373 0 $0 27 $207,057 APPLICATIONS DENIED 3 $60,313 130 $156,274 395 $153,801 28 $39,104 0 $0 39 $213,558 APPLICATIONS WITHDRAWN 8 $150,171 128 $210,825 287 $179,109 8 $16,610 0 $0 25 $199,266 FILES CLOSED FOR INCOMPLETENESS 0 $0 23 $267,423 80 $171,997 2 $49,025 0 $0 0 $0
Aggregated Statistics For Year 2001(Based on 2 full and 4 partial tracts) A) FHA, FSA/RHS & VA B) Conventional C) Refinancings D) Home Improvement Loans F) Non-occupant Loans on Number Average Value Number Average Value Number Average Value Number Average Value Number Average Value
LOANS ORIGINATED 66 $149,665 1,256 $189,404 1,987 $177,894 74 $30,831 225 $140,636 APPLICATIONS APPROVED, NOT ACCEPTED 2 $153,365 90 $140,582 152 $145,350 15 $30,082 18 $153,115 APPLICATIONS DENIED 8 $149,990 115 $169,161 334 $118,390 44 $32,920 19 $148,473 APPLICATIONS WITHDRAWN 9 $161,176 136 $207,601 251 $155,860 10 $32,601 25 $172,140 FILES CLOSED FOR INCOMPLETENESS 0 $0 18 $260,762 60 $190,824 2 $41,705 4 $164,710
Aggregated Statistics For Year 2000(Based on 2 full and 4 partial tracts) A) FHA, FSA/RHS & VA B) Conventional C) Refinancings D) Home Improvement Loans E) Loans on Dwellings For 5+ Families F) Non-occupant Loans on Number Average Value Number Average Value Number Average Value Number Average Value Number Average Value Number Average Value
LOANS ORIGINATED 51 $137,859 1,279 $171,123 425 $132,919 63 $42,499 1 $220,850 196 $131,318 APPLICATIONS APPROVED, NOT ACCEPTED 9 $50,630 82 $145,518 79 $114,025 18 $25,168 0 $0 7 $121,689 APPLICATIONS DENIED 11 $89,323 199 $98,335 274 $98,419 35 $36,212 1 $9,970 19 $114,819 APPLICATIONS WITHDRAWN 11 $128,501 131 $185,109 139 $84,701 7 $53,857 0 $0 16 $144,780 FILES CLOSED FOR INCOMPLETENESS 2 $130,320 32 $212,534 39 $112,034 0 $0 0 $0 5 $103,334
Aggregated Statistics For Year 1999(Based on 3 full and 4 partial tracts) A) FHA, FSA/RHS & VA B) Conventional C) Refinancings D) Home Improvement Loans E) Loans on Dwellings For 5+ Families F) Non-occupant Loans on Number Average Value Number Average Value Number Average Value Number Average Value Number Average Value Number Average Value
LOANS ORIGINATED 70 $135,366 1,287 $163,161 742 $127,495 51 $36,210 2 $2,990,945 184 $116,584 APPLICATIONS APPROVED, NOT ACCEPTED 0 $0 103 $141,665 124 $100,573 28 $29,373 0 $0 16 $73,593 APPLICATIONS DENIED 4 $91,048 222 $92,038 264 $96,781 24 $23,448 0 $0 25 $87,240 APPLICATIONS WITHDRAWN 8 $123,370 101 $154,753 163 $102,470 6 $56,602 0 $0 13 $88,695 FILES CLOSED FOR INCOMPLETENESS 1 $64,000 25 $170,549 65 $98,676 0 $0 0 $0 5 $83,056
Detailed HMDA statistics for the following Tracts:
0046.01
, 0046.04 , 0046.05 , 0046.06 , 0046.07 , 0047.00
Private Mortgage Insurance Companies Aggregated Statistics For Year 2008(Based on 2 full and 4 partial tracts) A) Conventional B) Refinancings C) Non-occupant Loans on Number Average Value Number Average Value Number Average Value
LOANS ORIGINATED 187 $246,907 56 $280,186 24 $202,632 APPLICATIONS APPROVED, NOT ACCEPTED 50 $333,870 26 $286,601 7 $391,736 APPLICATIONS DENIED 11 $285,182 8 $290,281 3 $270,850 APPLICATIONS WITHDRAWN 13 $286,226 5 $363,586 4 $163,448 FILES CLOSED FOR INCOMPLETENESS 4 $309,292 4 $465,688 2 $244,650
Aggregated Statistics For Year 2007(Based on 2 full and 4 partial tracts) A) Conventional B) Refinancings C) Non-occupant Loans on Number Average Value Number Average Value Number Average Value
LOANS ORIGINATED 180 $259,962 51 $294,796 37 $254,882 APPLICATIONS APPROVED, NOT ACCEPTED 30 $338,121 13 $322,827 6 $339,707 APPLICATIONS DENIED 4 $521,133 4 $207,685 4 $249,348 APPLICATIONS WITHDRAWN 11 $454,732 3 $318,147 2 $287,025 FILES CLOSED FOR INCOMPLETENESS 0 $0 1 $194,780 0 $0
Aggregated Statistics For Year 2006(Based on 2 full and 4 partial tracts) A) Conventional B) Refinancings C) Non-occupant Loans on Number Average Value Number Average Value Number Average Value
LOANS ORIGINATED 133 $264,442 26 $301,614 43 $251,138 APPLICATIONS APPROVED, NOT ACCEPTED 32 $314,365 16 $329,676 9 $303,381 APPLICATIONS DENIED 1 $182,290 1 $394,010 0 $0 APPLICATIONS WITHDRAWN 11 $293,308 5 $233,288 2 $172,020 FILES CLOSED FOR INCOMPLETENESS 2 $229,205 0 $0 1 $264,330
Aggregated Statistics For Year 2005(Based on 2 full and 4 partial tracts) A) Conventional B) Refinancings C) Non-occupant Loans on D) Loans On Manufactured Number Average Value Number Average Value Number Average Value Number Average Value
LOANS ORIGINATED 237 $219,357 52 $245,109 85 $184,820 1 $72,910 APPLICATIONS APPROVED, NOT ACCEPTED 47 $271,228 10 $217,213 14 $228,641 0 $0 APPLICATIONS DENIED 3 $278,513 0 $0 1 $134,160 0 $0 APPLICATIONS WITHDRAWN 22 $263,094 7 $278,437 6 $213,573 0 $0 FILES CLOSED FOR INCOMPLETENESS 3 $190,713 0 $0 1 $129,990 0 $0
Aggregated Statistics For Year 2004(Based on 2 full and 4 partial tracts) A) Conventional B) Refinancings C) Non-occupant Loans on D) Loans On Manufactured Number Average Value Number Average Value Number Average Value Number Average Value
LOANS ORIGINATED 298 $193,911 96 $197,105 65 $169,377 2 $209,360 APPLICATIONS APPROVED, NOT ACCEPTED 49 $232,963 40 $212,392 11 $169,486 0 $0 APPLICATIONS DENIED 8 $241,561 1 $159,440 2 $171,975 1 $48,430 APPLICATIONS WITHDRAWN 25 $261,914 11 $239,152 5 $306,542 0 $0 FILES CLOSED FOR INCOMPLETENESS 2 $228,930 3 $207,923 0 $0 0 $0
Aggregated Statistics For Year 2003(Based on 2 full and 4 partial tracts) A) Conventional B) Refinancings C) Non-occupant Loans on Number Average Value Number Average Value Number Average Value
LOANS ORIGINATED 531 $192,105 365 $176,109 68 $157,422 APPLICATIONS APPROVED, NOT ACCEPTED 73 $224,978 74 $184,384 8 $159,368 APPLICATIONS DENIED 5 $232,950 2 $241,450 1 $175,620 APPLICATIONS WITHDRAWN 29 $228,608 21 $178,581 3 $118,890 FILES CLOSED FOR INCOMPLETENESS 1 $108,050 4 $158,982 0 $0
Aggregated Statistics For Year 2002(Based on 2 full and 4 partial tracts) A) Conventional B) Refinancings C) Non-occupant Loans on Number Average Value Number Average Value Number Average Value
LOANS ORIGINATED 510 $180,518 277 $179,002 54 $161,143 APPLICATIONS APPROVED, NOT ACCEPTED 55 $174,754 56 $197,412 9 $188,106 APPLICATIONS DENIED 9 $156,117 5 $189,300 1 $137,760 APPLICATIONS WITHDRAWN 18 $194,907 13 $196,450 2 $78,015 FILES CLOSED FOR INCOMPLETENESS 3 $143,937 4 $158,490 0 $0
Aggregated Statistics For Year 2001(Based on 2 full and 4 partial tracts) A) Conventional B) Refinancings C) Non-occupant Loans on Number Average Value Number Average Value Number Average Value
LOANS ORIGINATED 503 $173,478 248 $173,701 40 $171,433 APPLICATIONS APPROVED, NOT ACCEPTED 55 $167,443 35 $171,400 4 $103,030 APPLICATIONS DENIED 7 $173,144 8 $135,381 2 $176,570 APPLICATIONS WITHDRAWN 9 $179,414 9 $187,286 2 $112,535 FILES CLOSED FOR INCOMPLETENESS 4 $151,892 1 $472,310 1 $84,780
Aggregated Statistics For Year 2000(Based on 2 full and 4 partial tracts) A) Conventional B) Refinancings C) Non-occupant Loans on Number Average Value Number Average Value Number Average Value
LOANS ORIGINATED 449 $163,260 28 $168,508 43 $129,811 APPLICATIONS APPROVED, NOT ACCEPTED 38 $172,451 6 $129,843 6 $133,087 APPLICATIONS DENIED 7 $162,953 2 $156,395 0 $0 APPLICATIONS WITHDRAWN 13 $180,810 2 $189,695 3 $87,303 FILES CLOSED FOR INCOMPLETENESS 1 $186,430 1 $83,850 0 $0
Aggregated Statistics For Year 1999(Based on 3 full and 4 partial tracts) A) Conventional B) Refinancings C) Non-occupant Loans on Number Average Value Number Average Value Number Average Value
LOANS ORIGINATED 506 $157,032 69 $138,835 43 $128,317 APPLICATIONS APPROVED, NOT ACCEPTED 42 $187,782 14 $170,151 3 $110,147 APPLICATIONS DENIED 20 $150,182 5 $120,864 5 $101,914 APPLICATIONS WITHDRAWN 14 $193,068 3 $131,513 1 $133,350 FILES CLOSED FOR INCOMPLETENESS 0 $0 0 $0 0 $0
Detailed PMIC statistics for the following Tracts:
0046.01
, 0046.04 , 0046.05 , 0046.06 , 0046.07 , 0047.00 Fire-safe hotels and motels in Mount Pleasant, South Carolina:
Hampton Inn Patriots Point, 255 Sessions Way, Mount Pleasant, South Carolina 29464 Phone: (843) 881-3300, Fax: (843) 881-6288
Holiday Inn - Charleston, 250 Johnnie Dodds Blvd, Mount Pleasant, South Carolina 29464 Phone: (843) 884-6000, Fax: (843) 881-1786
Shem Creek Inn, 1401 Shrimp Boat Ln, Mount Pleasant, South Carolina 29464 Phone: (843) 881-1000, Fax: (843) 849-6969
Rodeway Inn, 310 Hwy 17 Byp, Mount Pleasant, South Carolina 29464 Phone: (843) 884-5853, Fax: (843) 881-6279
Quality Inn & Suites At Patriots Point, 196 Patriots Point Rd, Mount Pleasant, South Carolina 29464 Phone: (843) 856-8817, Fax: (843) 856-8818
Extended Stay America - Charleston - Mt Pleasant, 304 Wingo Way, Mount Pleasant, South Carolina 29464 Phone: (843) 884-4453, Fax: (843) 884-3926
Mainstay Suites, 400 Mcgrath Darby Blvd, Mount Pleasant, South Carolina 29464 Phone: (843) 881-1722, Fax: (843) 881-1723
Hampton Inn & Suites, 1104 Isle Of Palms Connector, Mount Pleasant, South Carolina 29464 Phone: (843) 856-3900, Fax: (843) 881-6277
15 other hotels and motels
All 23 fire-safe hotels and motels in Mount Pleasant, South Carolina
Most common first names in Mount Pleasant, SC among deceased individuals Name Count Lived (average)
John 237 73.1 years James 187 72.1 years William 183 73.1 years Mary 182 79.3 years Robert 119 73.6 years Charles 103 74.7 years Elizabeth 95 80.6 years Margaret 91 79.6 years Joseph 87 76.1 years Helen 87 82.6 years
Most common last names in Mount Pleasant, SC among deceased individuals Last name Count Lived (average)
Brown 115 73.4 years Smith 81 76.7 years Johnson 50 77.7 years Wilson 47 80.4 years Simmons 44 73.0 years Williams 42 75.4 years Robinson 41 71.3 years Wright 41 71.9 years Jones 40 77.6 years Washington 39 74.0 years
Mount Pleasant compared to South Carolina state average:
Median household income above state average. Median house value significantly above state average. Unemployed percentage significantly below state average. Black race population percentage significantly below state average. Foreign-born population percentage above state average. Length of stay since moving in significantly below state average. House age below state average. Percentage of population with a bachelor's degree or higher significantly above state average. Mount Pleasant on our top lists :
#4 on the list of "Top 101 cities with largest percentage of females in occupations: management occupations (population 50,000+)"
#5 on the list of "Top 101 cities with largest percentage of males in occupations: management occupations (population 50,000+)"
#6 on the list of "Top 101 cities with largest percentage of females in occupations: architecture and engineering occupations (population 50,000+)"
#8 on the list of "Top 101 cities with the lowest number of robberies per 100,000 residents (population 50,000+)"
#17 on the list of "Top 101 cities with largest percentage of males in occupations: business and financial operations occupations (population 50,000+)"
#18 on the list of "Top 101 cities with largest percentage of males in occupations: health diagnosing and treating practitioners and other technical occupations (population 50,000+)"
#19 on the list of "Top 101 cities with largest percentage of females in occupations: health diagnosing and treating practitioners and other technical occupations (population 50,000+)"
#25 on the list of "Top 101 cities with largest percentage of females in industries: broadcasting, internet publishing, and telecommunications services (population 50,000+)"
#25 on the list of "Top 101 cities with largest percentage of males in industries: broadcasting, internet publishing, and telecommunications services (population 50,000+)"
#25 on the list of "Top 101 cities with largest percentage of females in industries: wholesale electronic markets and agents and brokers (population 50,000+)"
#25 on the list of "Top 101 cities with largest percentage of males in industries: wholesale electronic markets and agents and brokers (population 50,000+)"
#26 on the list of "Top 101 cities with largest percentage of females in industries: other services, except public administration (population 50,000+)"
#27 on the list of "Top 101 cities with largest percentage of females in industries: information (population 50,000+)"
#27 on the list of "Top 101 cities with the largest percentage of elementary and middle school students in private schools (5,000+ students)"
#27 on the list of "Top 101 cities with largest percentage of males in industries: arts, entertainment, and recreation (population 50,000+)"
#28 on the list of "Top 101 cities with the most people born in other U.S. states (population 50,000+)"
#28 on the list of "Top 101 cities with the smallest city-data.com crime index per police officer (population 50,000+)"
#29 on the list of "Top 100 least racially diverse cities (pop. 50,000+)"
#32 on the list of "Top 101 cities with most building permits per 10,000 residents (population 50,000+)"
#32 on the list of "Top 101 cities with the most people below the poverty level, excluding cities with 15% or more of residents in college and with the median age below 28 (population 50,000+)"
#14 on the list of "Top 101 counties with the most Black Protestant congregations"
#21 on the list of "Top 101 counties with the largest decrease in the number of infant deaths per 1000 residents 2000-2006 to 2007-2013 (pop. 50,000+)"
#22 on the list of "Top 101 counties with the most Black Protestant adherents"
#24 on the list of "Top 101 counties with the lowest surface withdrawal of fresh water for public supply (pop. 50,000+)"
#43 on the list of "Top 101 counties with the lowest Nitrogen Dioxide air pollution readings in 2012 (ppm)"
Top Patent Applicants
Carlton D. Donald (23)
Parfait Jean Marie Likibi (10)
Stephen Tomlinson (10)
Nicole Blohm (8)
Philip M. Buscemi (7)
James H. Price (6)
William L. Jacques (6)
Xiaorong Cai (6)
Bruce M. Frankel (5)
Bruce Frankel (5)
Total of 330 patent applications in 2008-2024.
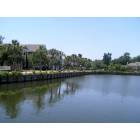
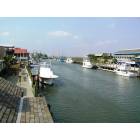
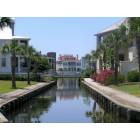
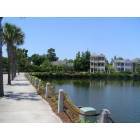
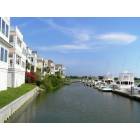
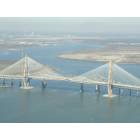
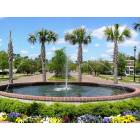
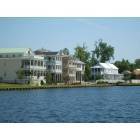

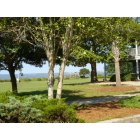
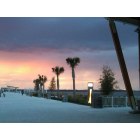
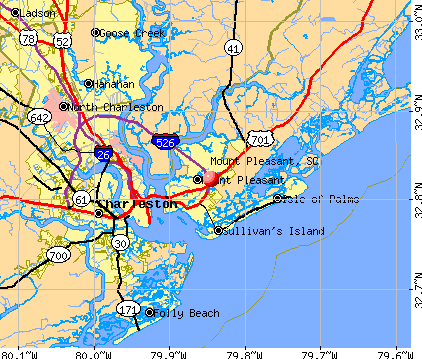


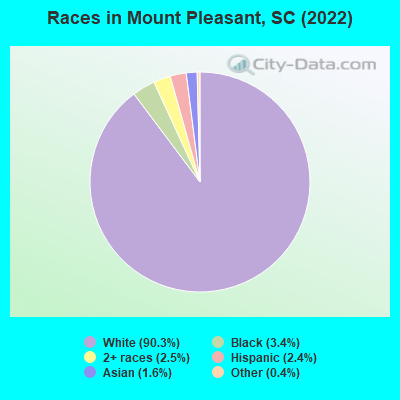
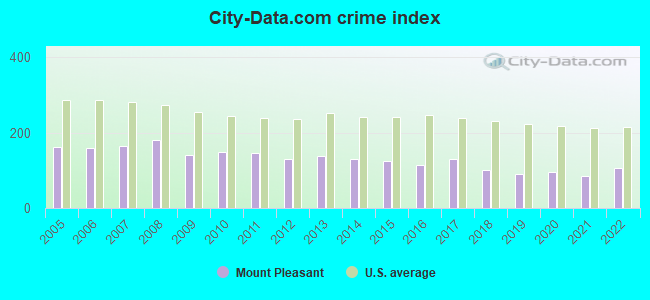
 Recent articles from our blog. Our writers, many of them Ph.D. graduates or candidates, create easy-to-read articles on a wide variety of topics.

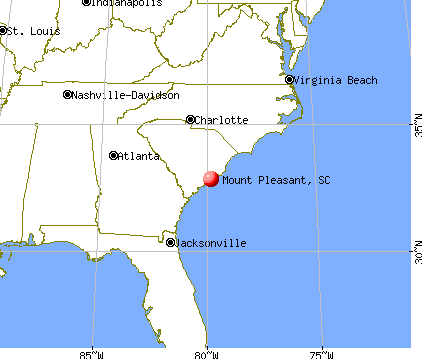
 (8.5 miles
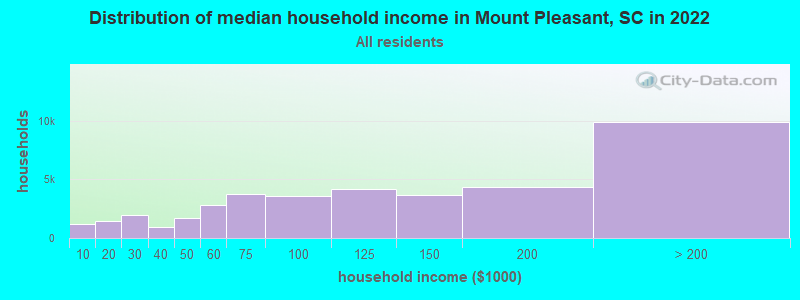
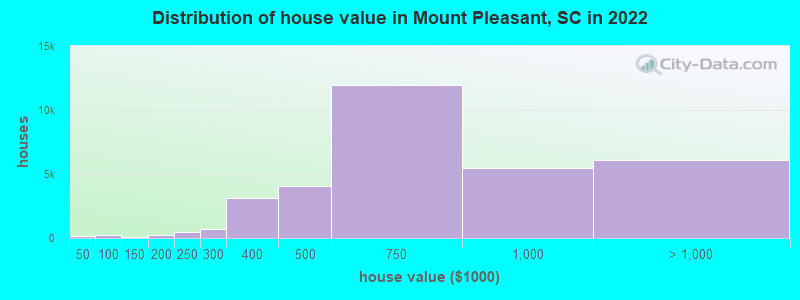

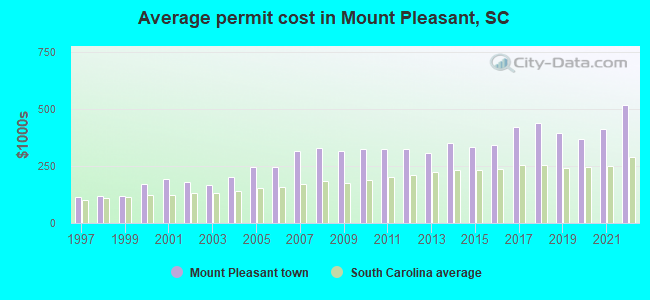
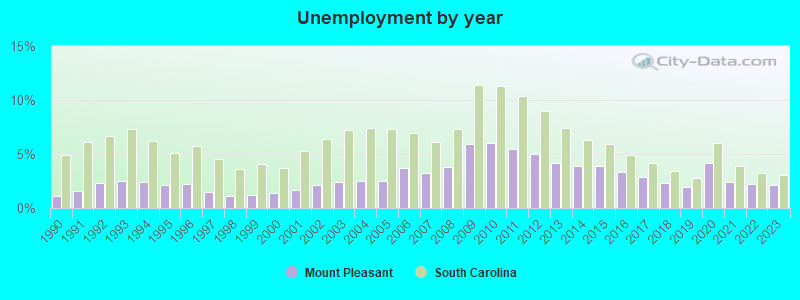
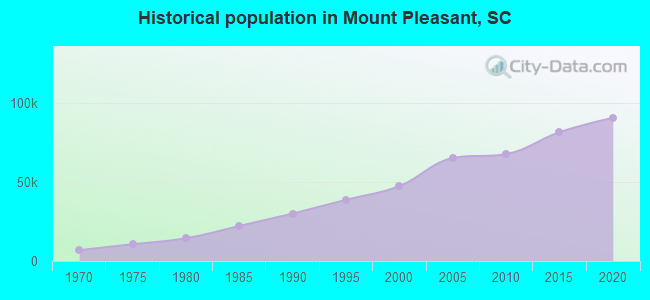
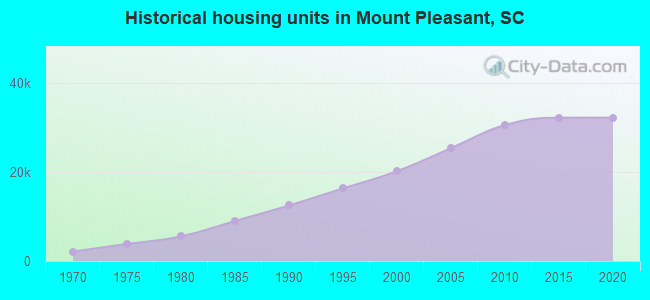
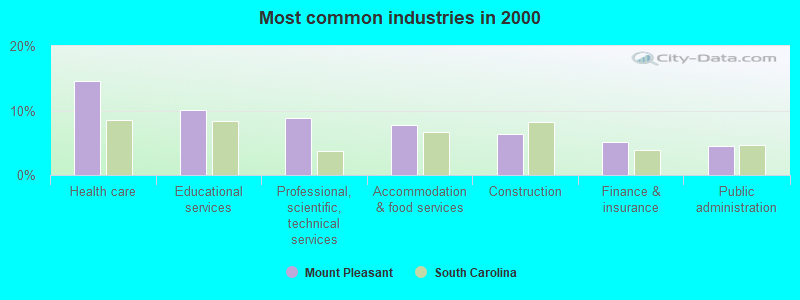
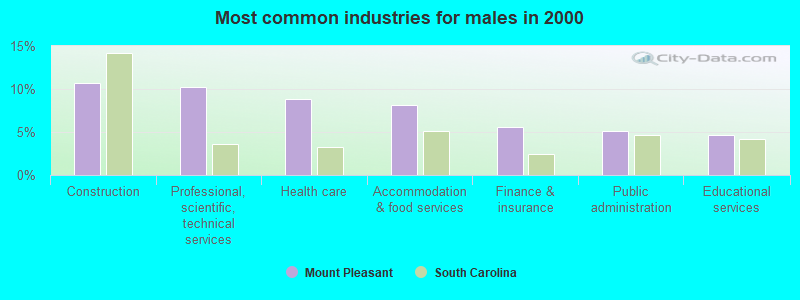
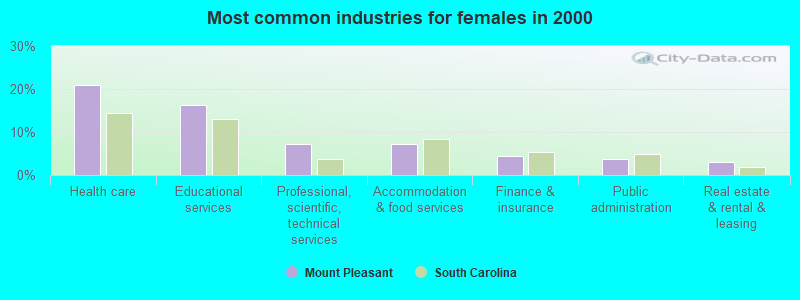
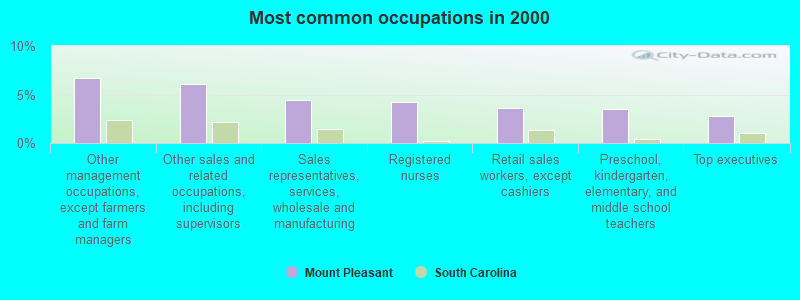
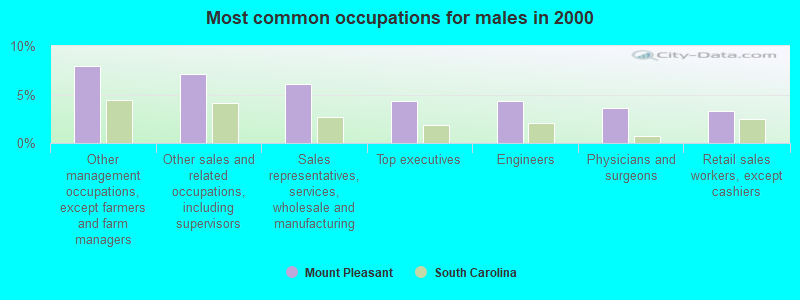
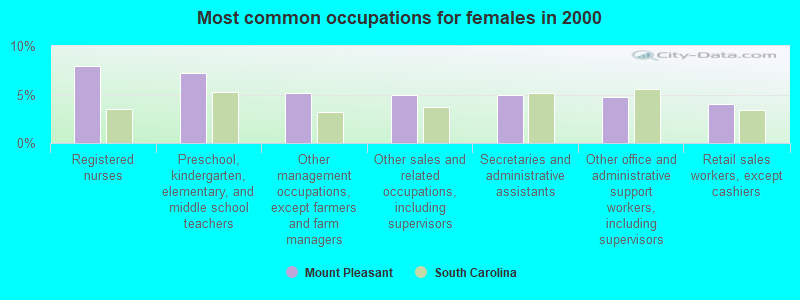
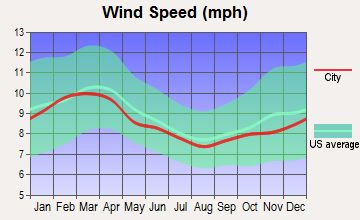
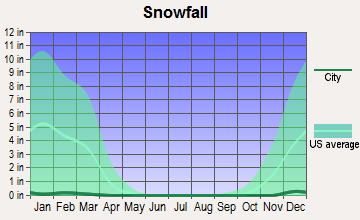
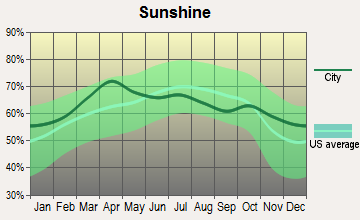
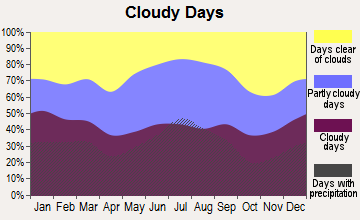
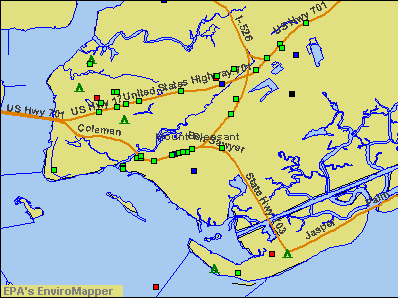

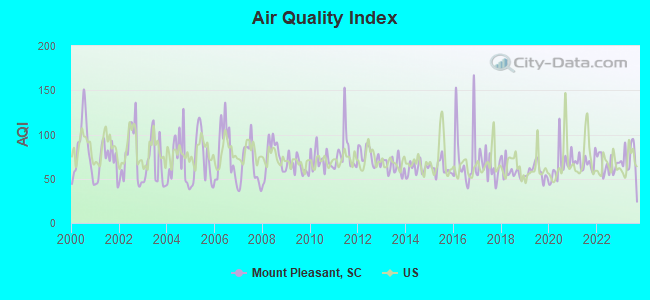
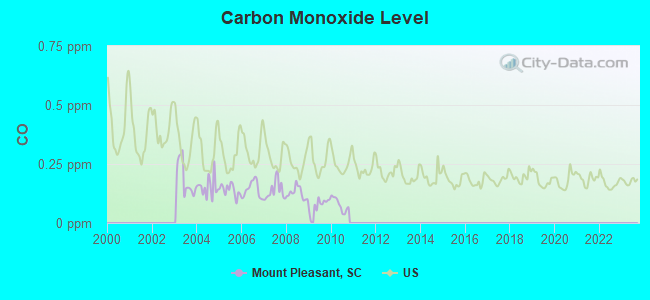
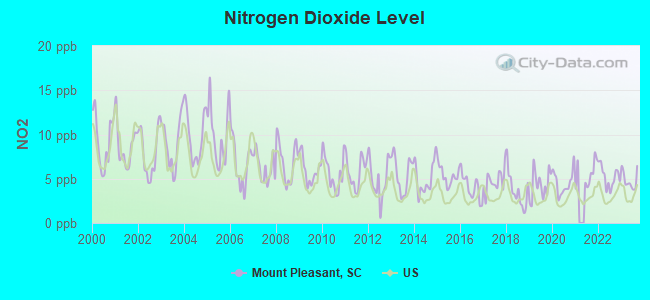
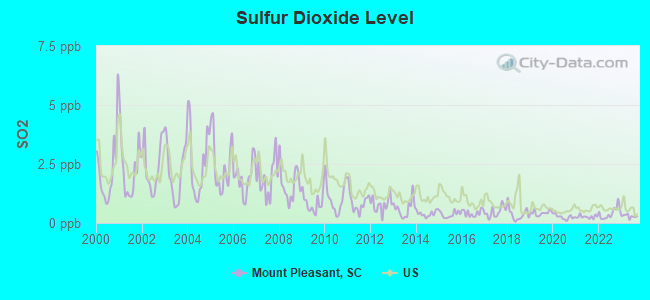
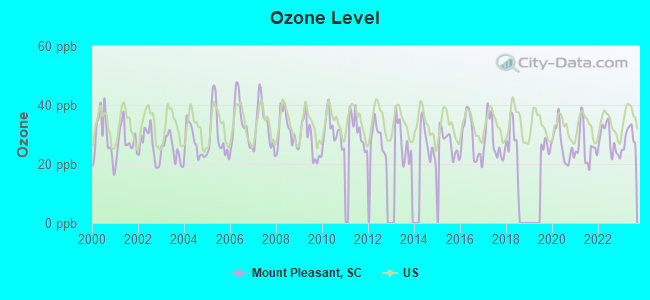
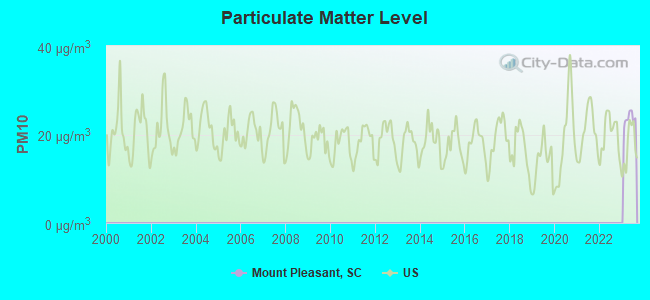

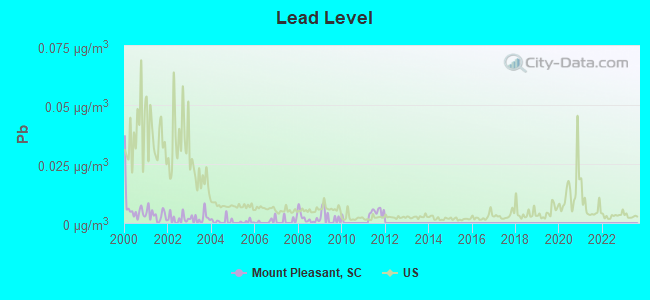
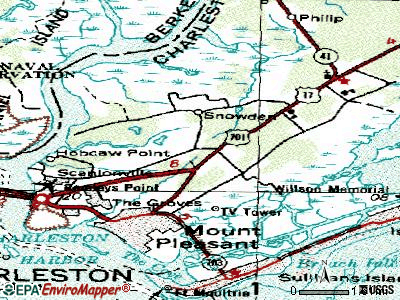
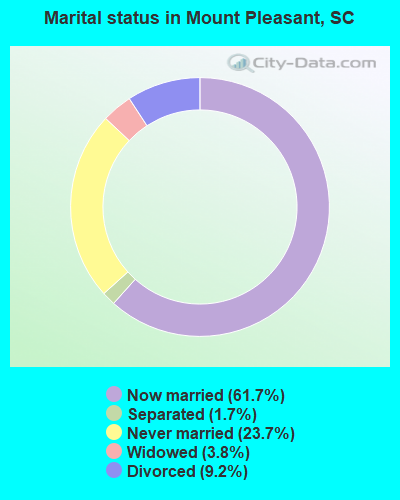
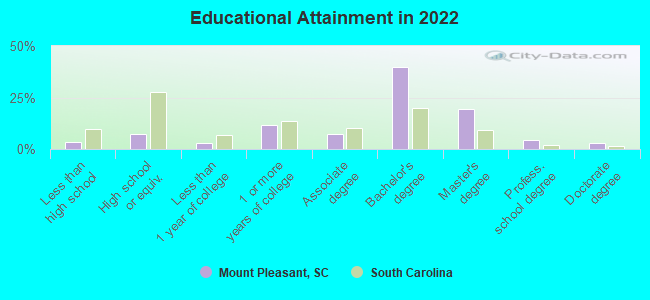
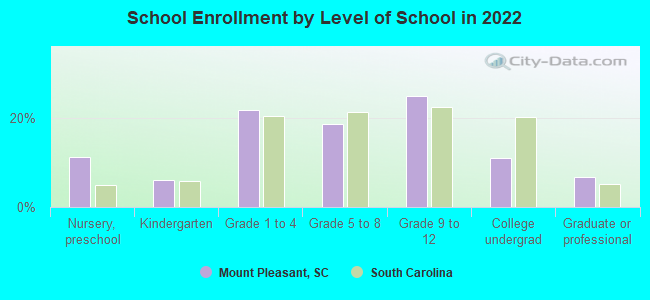
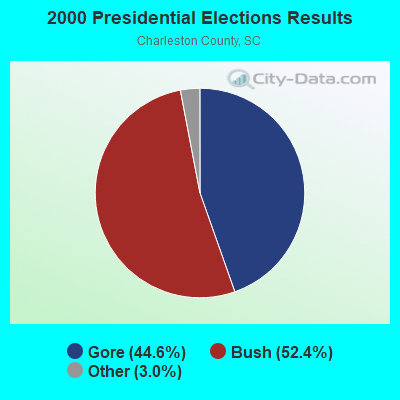
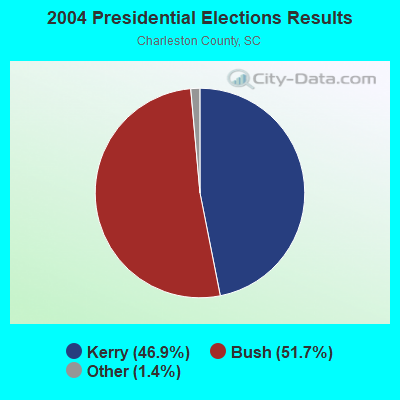
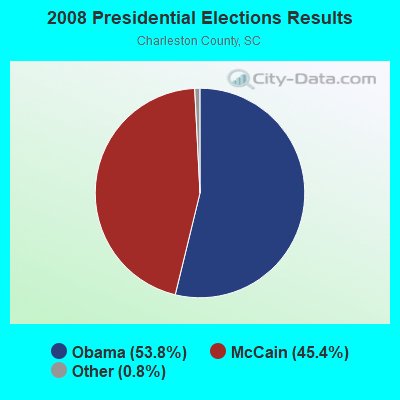
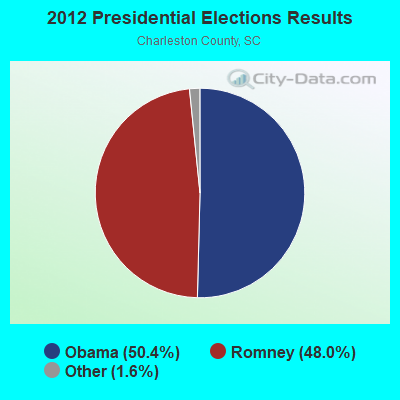
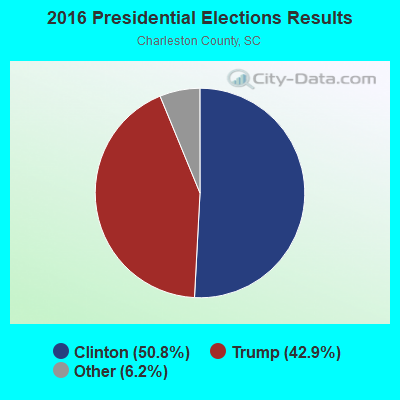
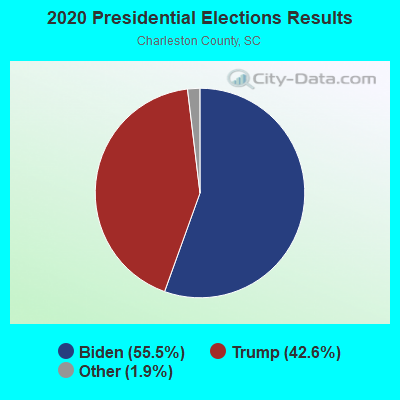
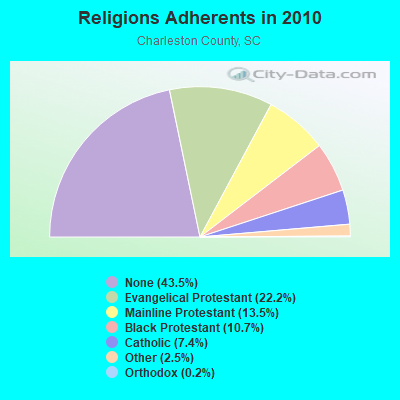
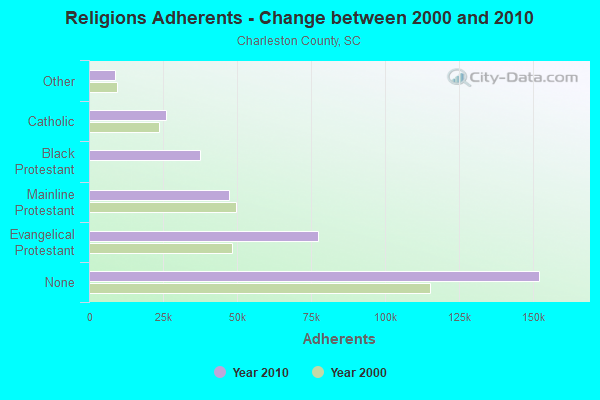
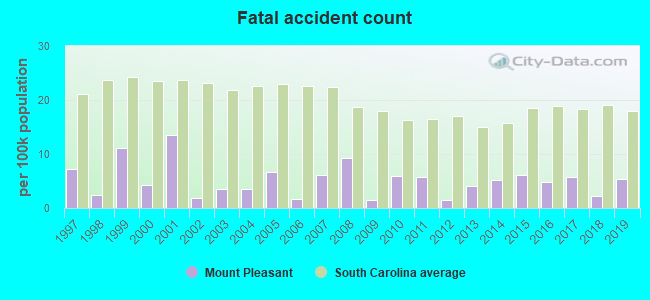
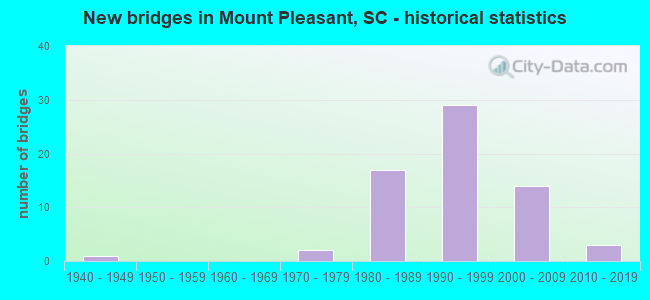
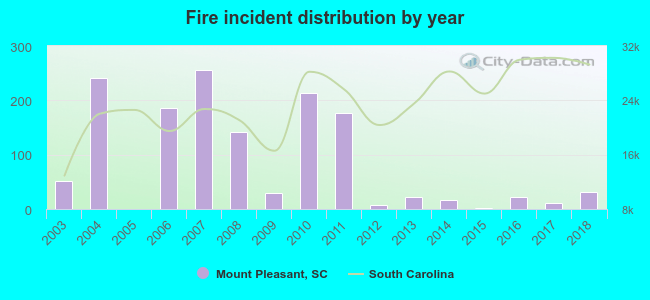 Based on the data from the years 2003 - 2018 the average number of fire incidents per year is 88. The highest number of reported fires - 256 took place in 2007, and the least - 0 in 2005. The data has a decreasing trend.
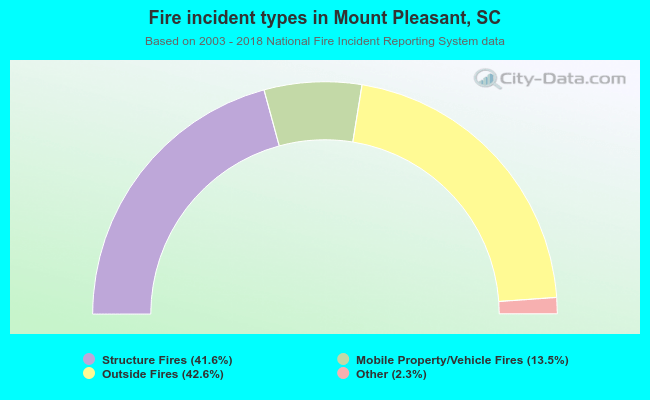 When looking into fire subcategories, the most incidents belonged to: Outside Fires (42.6%), and Structure Fires (41.6%).