Estimated zip code population in 2022: 60,549 Zip code population in 2010: 45,057 Zip code population in 2000: 28,337
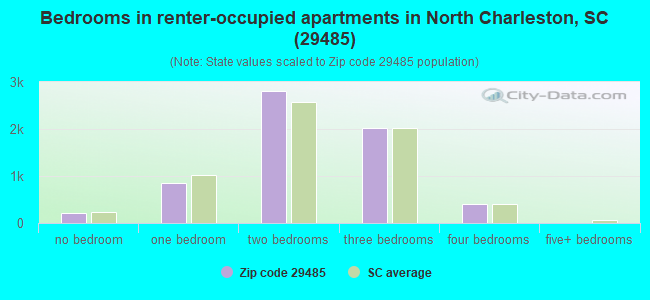
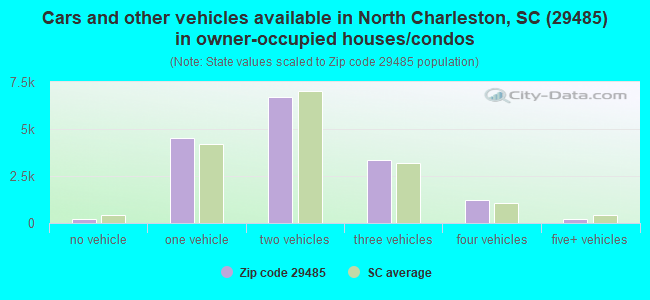
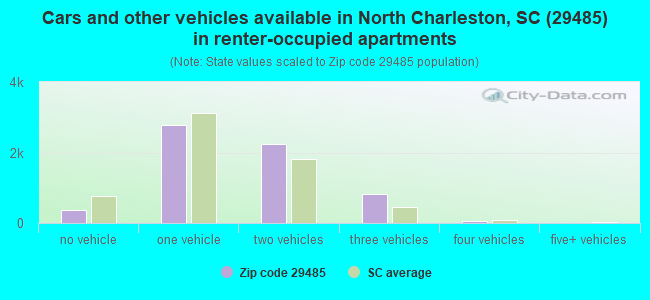
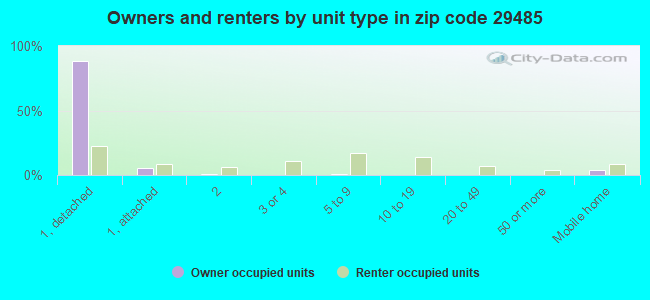
Houses and condos: 23,963 Renter-occupied apartments: 6,295
% of renters here:
28%
State:
28%
March 2022 cost of living index in zip code 29485: 92.7 (less than average, U.S. average is 100)
Land area: 35.7 sq. mi. Water area: 0.5 sq. mi.
Population density: 1,696 people per square mile
(low).
OSM Map
General Map
Google Map
MSN Map
OSM Map
General Map
Google Map
MSN Map
OSM Map
General Map
Google Map
MSN Map
OSM Map
General Map
Google Map
MSN Map
Please wait while loading the map...
Real estate property taxes paid for housing units in 2022:
This zip code:
0.5% ($1,844)
South Carolina:
0.5% ($1,185)
Median real estate property taxes paid for housing units with mortgages in 2022: $1,915 (0.5%) Median real estate property taxes paid for housing units with no mortgage in 2022: $1,561 (0.5%)
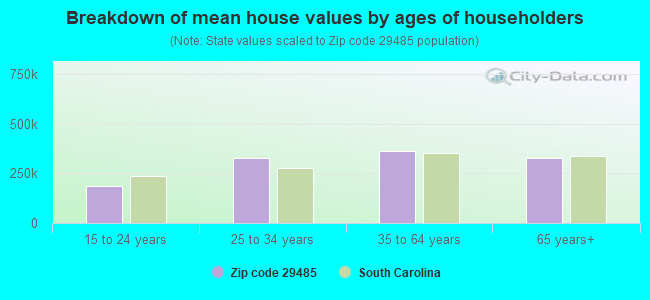
Estimated median house/condo value in 2022: $343,392
29485:
$343,392
South Carolina:
$254,600
According to our research of South Carolina and other state lists, there were 16 registered sex offenders living in 29485 zip code as of April 27, 2024. The ratio of all residents to sex offenders in zip code 29485 is 3,346 to 1. The ratio of registered sex offenders to all residents in this zip code is much lower than the state average.
Median resident age:
This zip code:
37.1 years
South Carolina median age:
40.5 years
Average household size:
This zip code:
2.7 people
South Carolina:
2.4 people
Averages for the 2020 tax year for zip code 29485, filed in 2021:
Average Adjusted Gross Income (AGI) in 2020: $61,700 (Individual Income Tax Returns)
Here:
$61,700
State:
$65,754
Salary/wage: $54,747 (reported on 84.1% of returns)
Here:
$54,747
State:
$52,566
(% of AGI for various income ranges: 1178.4% for AGIs below $25k, 3753.7% for AGIs $25k-50k, 6846.5% for AGIs $50k-75k, 9740.6% for AGIs $75k-100k, 18580.8% for AGIs $100k-200k, 60586.4% for AGIs over 200k)
Taxable interest for individuals: $875 (reported on 21.8% of returns)
This zip code:
$875
South Carolina:
$1,749
(% of AGI for various income ranges: 10.6% for AGIs below $25k, 12.5% for AGIs $25k-50k, 23.3% for AGIs $50k-75k, 37.3% for AGIs $75k-100k, 63.2% for AGIs $100k-200k, 419.1% for AGIs over 200k)
Ordinary dividends: $3,299 (reported on 14.9% of returns)
Here:
$3,299
State:
$8,783
(% of AGI for various income ranges: 14.1% for AGIs below $25k, 20.7% for AGIs $25k-50k, 52.6% for AGIs $50k-75k, 79.0% for AGIs $75k-100k, 195.2% for AGIs $100k-200k, 1620.5% for AGIs over 200k)
Net capital gain/loss in AGI: +$12,871 (reported on 13.2% of returns)
Here:
+$12,871
State:
+$24,194
(% of AGI for various income ranges: 7.2% for AGIs below $25k, 26.8% for AGIs $25k-50k, 70.0% for AGIs $50k-75k, 123.9% for AGIs $75k-100k, 372.4% for AGIs $100k-200k, 14130.5% for AGIs over 200k)
Profit/loss from business: +$10,059 (reported on 16.2% of returns)
Here:
+$10,059
State:
+$11,253
(% of AGI for various income ranges: 100.9% for AGIs below $25k, 118.6% for AGIs $25k-50k, 196.2% for AGIs $50k-75k, 269.7% for AGIs $75k-100k, 504.3% for AGIs $100k-200k, 3833.6% for AGIs over 200k)
Taxable individual retirement arrangement distribution: $16,510 (reported on 7.6% of returns)
29485:
$16,510
South Carolina:
$21,604
(% of AGI for various income ranges: 39.5% for AGIs below $25k, 74.7% for AGIs $25k-50k, 185.1% for AGIs $50k-75k, 284.2% for AGIs $75k-100k, 501.2% for AGIs $100k-200k, 2020.5% for AGIs over 200k)
Self-employed (Keogh) retirement plans: $17,940 (reported on 0.2% of returns)
29485:
$17,940
South Carolina:
$25,038
(% of AGI for various income ranges: 35.9% for AGIs $100k-200k)
Total itemized deductions: $28,054 (reported on 7.5% of returns)
Here:
$28,054
State:
$35,199
(% of AGI for various income ranges: 35.0% for AGIs below $25k, 104.3% for AGIs $25k-50k, 302.0% for AGIs $50k-75k, 403.5% for AGIs $75k-100k, 845.6% for AGIs $100k-200k, 5470.0% for AGIs over 200k)
Charity contributions: $8,544 (reported on 5.9% of returns)
Here:
$8,544
State:
$14,319
(% of AGI for various income ranges: 4.3% for AGIs below $25k, 18.2% for AGIs $25k-50k, 50.1% for AGIs $50k-75k, 66.3% for AGIs $75k-100k, 230.5% for AGIs $100k-200k, 1822.3% for AGIs over 200k)
Taxes paid: $7,050 (reported on 7.4% of returns)
29485:
$7,050
State:
$7,486
(% of AGI for various income ranges: 5.1% for AGIs below $25k, 17.7% for AGIs $25k-50k, 72.5% for AGIs $50k-75k, 120.4% for AGIs $75k-100k, 251.5% for AGIs $100k-200k, 1097.3% for AGIs over 200k)
Earned income credit: $2,301 (reported on 15.6% of returns)
Here:
$2,301
State:
$2,397
(% of AGI for various income ranges: 95.7% for AGIs below $25k, 70.3% for AGIs $25k-50k, 1.4% for AGIs $50k-75k)
Percentage of individuals using paid preparers for their 2020 taxes: 94.0%
Here:
94%
State:
93%
(% for various income ranges: 93.2% for AGIs below $25k, 94.2% for AGIs $25k-50k, 94.1% for AGIs $50k-75k, 93.8% for AGIs $75k-100k, 94.9% for AGIs $100k-200k, 94.4% for AGIs over 200k)
Averages for the 2012 tax year for zip code 29485, filed in 2013:
Average Adjusted Gross Income (AGI) in 2012: $53,870 (Individual Income Tax Returns)
Here:
$53,870
State:
$51,133
Salary/wage: $48,288 (reported on 86.7% of returns)
Here:
$48,288
State:
$42,173
(% of AGI for various income ranges: 79.4% for AGIs below $25k, 80.8% for AGIs $25k-50k, 77.8% for AGIs $50k-75k, 78.8% for AGIs $75k-100k, 80.0% for AGIs $100k-200k, 58.7% for AGIs over 200k)
Taxable interest for individuals: $717 (reported on 28.3% of returns)
This zip code:
$717
South Carolina:
$1,468
(% of AGI for various income ranges: 0.7% for AGIs below $25k, 0.4% for AGIs $25k-50k, 0.4% for AGIs $50k-75k, 0.3% for AGIs $75k-100k, 0.2% for AGIs $100k-200k, 0.6% for AGIs over 200k)
Ordinary dividends: $2,293 (reported on 16.5% of returns)
Here:
$2,293
State:
$6,511
(% of AGI for various income ranges: 1.0% for AGIs below $25k, 0.6% for AGIs $25k-50k, 0.7% for AGIs $50k-75k, 0.6% for AGIs $75k-100k, 0.6% for AGIs $100k-200k, 1.4% for AGIs over 200k)
Net capital gain/loss in AGI: +$3,041 (reported on 11.2% of returns)
Here:
+$3,041
State:
+$13,061
(% of AGI for various income ranges: 0.2% for AGIs $25k-50k, 0.3% for AGIs $50k-75k, 0.3% for AGIs $75k-100k, 0.6% for AGIs $100k-200k, 4.1% for AGIs over 200k)
Profit/loss from business: +$8,590 (reported on 13.6% of returns)
Here:
+$8,590
State:
+$10,167
(% of AGI for various income ranges: 6.3% for AGIs below $25k, 2.6% for AGIs $25k-50k, 1.7% for AGIs $50k-75k, 1.2% for AGIs $75k-100k, 1.3% for AGIs $100k-200k, 3.8% for AGIs over 200k)
Taxable individual retirement arrangement distribution: $14,344 (reported on 8.4% of returns)
29485:
$14,344
South Carolina:
$17,019
(% of AGI for various income ranges: 2.1% for AGIs below $25k, 2.0% for AGIs $25k-50k, 2.2% for AGIs $50k-75k, 2.1% for AGIs $75k-100k, 2.1% for AGIs $100k-200k, 3.6% for AGIs over 200k)
Self-employment retirement plans: $12,300 (reported on 0.2% of returns)
29485:
$12,300
South Carolina:
$21,023
Total itemized deductions: $19,762 (22% of AGI, reported on 38.3% of returns)
Here:
$19,762
State:
$22,890
Here:
22.2% of AGI
State:
21.4% of AGI
(% of AGI for various income ranges: 8.6% for AGIs below $25k, 11.6% for AGIs $25k-50k, 14.2% for AGIs $50k-75k, 15.5% for AGIs $75k-100k, 15.8% for AGIs $100k-200k, 13.9% for AGIs over 200k)
Charity contributions: $3,392 (reported on 31.7% of returns)
Here:
$3,392
State:
$5,169
(% of AGI for various income ranges: 0.8% for AGIs below $25k, 1.5% for AGIs $25k-50k, 1.8% for AGIs $50k-75k, 2.3% for AGIs $75k-100k, 2.3% for AGIs $100k-200k, 2.8% for AGIs over 200k)
Taxes paid: $6,565 (reported on 38.2% of returns)
29485:
$6,565
State:
$7,644
(% of AGI for various income ranges: 1.3% for AGIs below $25k, 2.6% for AGIs $25k-50k, 3.9% for AGIs $50k-75k, 5.0% for AGIs $75k-100k, 6.3% for AGIs $100k-200k, 6.5% for AGIs over 200k)
Earned income credit: $2,269 (reported on 17.8% of returns)
Here:
$2,269
State:
$2,418
(% of AGI for various income ranges: 7.0% for AGIs below $25k, 1.2% for AGIs $25k-50k)
Percentage of individuals using paid preparers for their 2012 taxes: 48.3%
Here:
48%
State:
57%
(% for various income ranges: 44.8% for AGIs below $25k, 48.4% for AGIs $25k-50k, 49.9% for AGIs $50k-75k, 50.8% for AGIs $75k-100k, 50.9% for AGIs $100k-200k, 72.7% for AGIs over 200k)
Averages for the 2004 tax year for zip code 29485, filed in 2005:
Average Adjusted Gross Income (AGI) in 2004: $46,925 (Individual Income Tax Returns)
Here:
$46,925
State:
$41,965
Salary/wage: $42,533 (reported on 88.4% of returns)
Here:
$42,533
State:
$35,695
(% of AGI for various income ranges: 152.2% for AGIs below $10k, 79.1% for AGIs $10k-25k, 82.0% for AGIs $25k-50k, 81.5% for AGIs $50k-75k, 83.5% for AGIs $75k-100k, 73.2% for AGIs over 100k)
Taxable interest for individuals: $941 (reported on 41.7% of returns)
This zip code:
$941
South Carolina:
$1,623
(% of AGI for various income ranges: 3.2% for AGIs below $10k, 1.3% for AGIs $10k-25k, 0.8% for AGIs $25k-50k, 0.7% for AGIs $50k-75k, 0.6% for AGIs $75k-100k, 0.9% for AGIs over 100k)
Taxable dividends: $1,640 (reported on 21.0% of returns)
Here:
$1,640
State:
$3,999
(% of AGI for various income ranges: 2.7% for AGIs below $10k, 1.1% for AGIs $10k-25k, 0.5% for AGIs $25k-50k, 0.6% for AGIs $50k-75k, 0.3% for AGIs $75k-100k, 1.1% for AGIs over 100k)
Net capital gain/loss: +$7,229 (reported on 15.9% of returns)
Here:
+$7,229
State:
+$13,100
(% of AGI for various income ranges: -1.0% for AGIs below $10k, -0.4% for AGIs $10k-25k, 0.4% for AGIs $25k-50k, 0.5% for AGIs $50k-75k, 0.6% for AGIs $75k-100k, 7.3% for AGIs over 100k)
Profit/loss from business: +$8,518 (reported on 13.5% of returns)
Here:
+$8,518
State:
+$9,144
(% of AGI for various income ranges: 6.0% for AGIs below $10k, 5.0% for AGIs $10k-25k, 2.7% for AGIs $25k-50k, 1.6% for AGIs $50k-75k, 1.4% for AGIs $75k-100k, 2.9% for AGIs over 100k)
IRA payment deduction: $2,761 (reported on 2.7% of returns)
29485:
$2,761
South Carolina:
$2,972
(% of AGI for various income ranges: 0.2% for AGIs below $10k, 0.2% for AGIs $10k-25k, 0.2% for AGIs $25k-50k, 0.2% for AGIs $50k-75k, 0.1% for AGIs $75k-100k, 0.1% for AGIs over 100k)
Self-employed pension: $11,157 (reported on 0.5% of returns)
Here:
$11,157
South Carolina:
$15,117
(% of AGI for various income ranges: 0.0% for AGIs $25k-50k, 0.1% for AGIs $50k-75k, 0.1% for AGIs $75k-100k, 0.3% for AGIs over 100k)
Total itemized deductions: $17,450 (23% of AGI, reported on 43.5% of returns)
Here:
$17,450
State:
$19,039
Here:
23.0% of AGI
State:
22.8% of AGI
(% of AGI for various income ranges: 14.4% for AGIs below $10k, 9.1% for AGIs $10k-25k, 14.9% for AGIs $25k-50k, 17.6% for AGIs $50k-75k, 18.9% for AGIs $75k-100k, 16.0% for AGIs over 100k)
Charity contributions deductions: $2,989 (4% of AGI, reported on 39.5% of returns)
Here:
$2,989
State:
$4,305
Here:
3.8% of AGI
State:
5.0% of AGI
(% of AGI for various income ranges: 1.0% for AGIs below $10k, 1.0% for AGIs $10k-25k, 2.0% for AGIs $25k-50k, 2.6% for AGIs $50k-75k, 2.9% for AGIs $75k-100k, 2.9% for AGIs over 100k)
Total tax: $5,869 (reported on 77.0% of returns)
29485:
$5,869
State:
$6,497
(% of AGI for various income ranges: 3.3% for AGIs below $10k, 4.0% for AGIs $10k-25k, 6.2% for AGIs $25k-50k, 8.0% for AGIs $50k-75k, 9.3% for AGIs $75k-100k, 15.0% for AGIs over 100k)
Earned income credit: $1,843 (reported on 13.8% of returns)
Here:
$1,843
State:
$1,882
Percentage of individuals using paid preparers for their 2004 taxes: 56.9%
Here:
57%
State:
66%
(% for various income ranges: 47.5% for AGIs below $10k, 61.8% for AGIs $10k-25k, 58.7% for AGIs $25k-50k, 57.7% for AGIs $50k-75k, 54.8% for AGIs $75k-100k, 58.7% for AGIs over 100k)
Likely homosexual households (counted as self-reported same-sex unmarried-partner households)
Lesbian couples: 0.0% of all households
Gay men: 0.3% of all households
Household received Food Stamps/SNAP in the past 12 months: 1,326 Household did not receive Food Stamps/SNAP in the past 12 months: 21,232
Women who had a birth in the past 12 months: 1,105 (701 now married, 404 unmarried) Women who did not have a birth in the past 12 months: 12,779 (6,283 now married, 6,529 unmarried)
Housing units in zip code 29485 with a mortgage: 12,086 (650 second mortgage, 11 home equity loan, 454 both second mortgage and home equity loan) Houses without a mortgage: 48
Median monthly owner costs for units with a mortgage: $1,669 Median monthly owner costs for units without a mortgage: $510
Residents with income below the poverty level in 2022:
This zip code:
10.2%
Whole state:
14.0%
Residents with income below 50% of the poverty level in 2022:
This zip code:
7.4%
Whole state:
7.3%
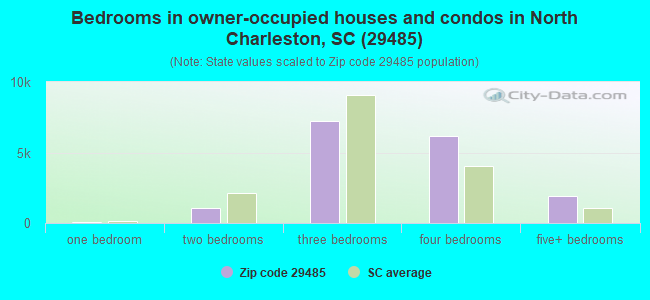
Median number of rooms in houses and condos:
Here:
7.1
State:
6.4
Median number of rooms in apartments:
Here:
4.7
State:
4.5
Notable locations in this zip code not listed on our city pages
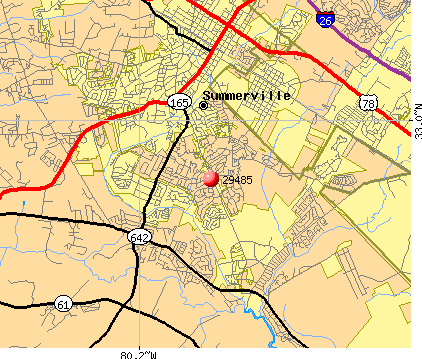
Notable locations in zip code 29485: Summerville Water Plant (A), Summerville Galleria Phase I (B), Summerville Plaza (C), Legends Golf Club (D), Prudential Coosaw Creek Country Club (E), Old Fort Dorchester (F), Gehagan Plantation (G), Kings Grant Golf Club (H), Dorchester County Public Library Summerville Branch (I), Summerville Fire and Rescue Station 3 (J), Old Forte Fire Department Number 2 (K), Old Forte Fire Department Number 1 (L), Lincolnville Fire Department (M), Old Forte Fire Department Number 3 (N), Lincolnville Police Department (O). Display/hide their locations on the map
Shopping Centers: Dorchester Village Shopping Center (1), Ladson Oakbrook Shopping Center (2), Oakbrook Shopping Center (3), Oakbrook Square Shopping Center (4). Display/hide their locations on the map
Churches in zip code 29485 include: Saint Lukes Church (A), Ashley River Church (B), Stallsville United Methodist Church (C), Saint George Church Ruins (D), Dorchester Congregational Church Ruins (E), Summit Church (F), Scots Kirk Associate Reformed Presbyterian Church (G), Saint Theresa Catholic Church (H), Old Fort Baptist Church (I). Display/hide their locations on the map
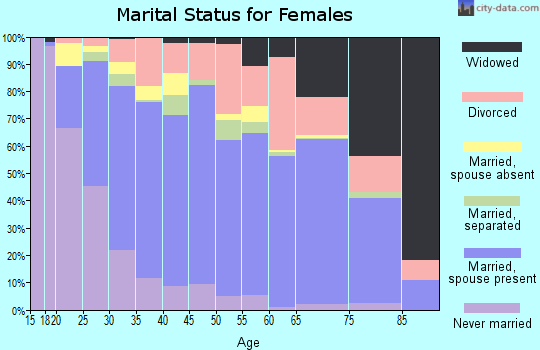
10,147 married couples with children.
3,757 single-parent households (366 men, 3,391 women).
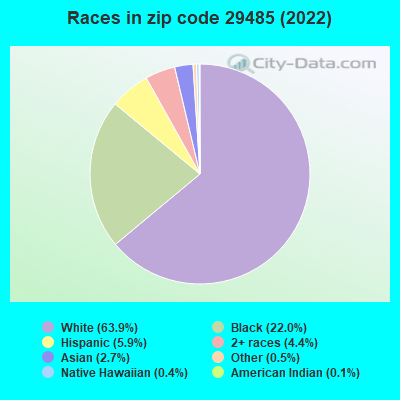
92.0% of residents of 29485 zip code speak English at home.
3.3% of residents speak Spanish at home (67% very well, 15% well, 18% not well).
3.1% of residents speak other Indo-European language at home (80% very well, 16% well, 4% not well).
1.3% of residents speak Asian or Pacific Island language at home (44% very well, 26% well, 26% not well, 3% not at all).
0.1% of residents speak other language at home (100% very well).
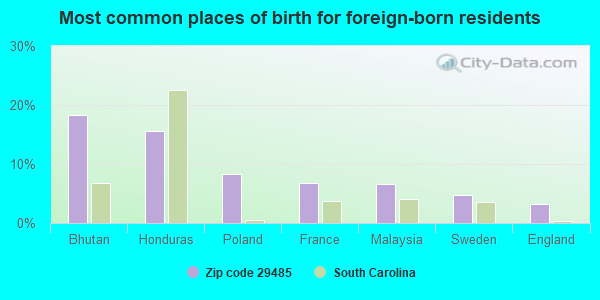
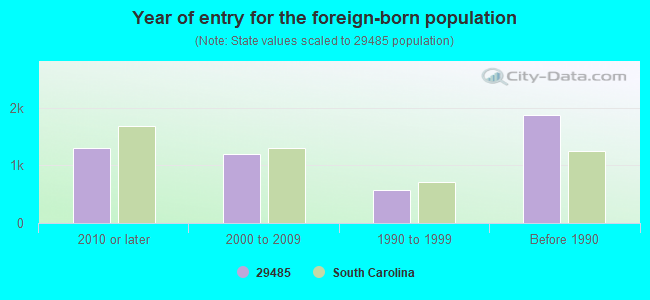
Foreign born population: 3,705 (6.1%) (48.9% of them are naturalized citizens)
Facilities with environmental interests located in this zip code:
BRITELINE EXTRUSIONS, INC (575 BEECH HILL RD in SUMMERVILLE, SC)
AIR MINOR (AIRS/AFS) (Integrated Compliance Information System) - ICIS-04-2000-0519, FORMAL ENFORCEMENT ACTION CRITERIA AND HAZARDOUS AIR POLLUTANT INVENTORY (Inventory of air pollution sources) National Pollutant Discharge Elimination System NON-MAJOR (Tracking pollutant discharge elimination systems) - permit (Resource Conservation and Recovery Act (tracking hazardous waste)) STATE MASTER (South Carolina database) - National Pollutant Discharge Elimination System Permit, HAZARDOUS WASTE PROGRAM, TRI REPORTER, AIR PROGRAM, DRINKING WATER SYSTEM TRI REPORTER (Tracking of toxic chemicals releasing facilities) Business SIC classification: ALUMINUM EXTRUDED PRODUCTS Business NAICS classification: ALUMINUM EXTRUDED PRODUCT MANUFACTURING.; ALUMINUM EXTRUDED PRODUCT MANUFACTURING.; METAL WINDOW AND DOOR MANUFACTURING. Organizations: OPERNAME (CONTACT/OPERATOR)
, OWNERNAME (CONTACT/OWNER)
FORDS REDI MIX CONCRETE (3397 LADSON ROAD in LADSON, SC)
AIR MINOR (AIRS/AFS) CRITERIA AND HAZARDOUS AIR POLLUTANT INVENTORY (Inventory of air pollution sources) STATE MASTER (South Carolina database) - AIR PROGRAM STATE MASTER (South Carolina database) - UNDERGROUND STORAGE TANK PROGRAM Business SIC classification: READY-MIXED CONCRETE Organizations: BOBBY CARRY ENGINEERS INC (CONTACT/ENGINEERING/CONSULTING FIRM)
Alternative names: FORD'S REDI-MIX CONCRETE COMPANY - LADSON, FORDS REDI MIX LADSON NUMBER 2
EXXON CO USA NUMBER 40331 (10002 DORCHESTER ROAD in SUMMERVILLE, SC)
(Resource Conservation and Recovery Act (tracking hazardous waste)) STATE MASTER (South Carolina database) - HAZARDOUS WASTE PROGRAM STATE MASTER (South Carolina database) - UNDERGROUND STORAGE TANK PROGRAM Organizations: MIXSON INC RICHARD MIXSON (CONTACT/OWNER)
Alternative names: TIGER EXPRESS 10
BEECH HILL ELEMENTARY SCHOOL (1001 BEECH HILL ROAD in SUMMERVILLE, SC)
(National Center for Education Statistics) - STATE ID-1802021 STATE MASTER (South Carolina database) - DRINKING WATER PROGRAM Organizations: DORCHESTER COUNTY SCHOOL DISTRICT 02 (SCHOOL DISTRICT)
EXXON COMPANY USA NUMBER 40106 (10598 DORCHESTER ROAD in SUMMERVILLE, SC)
(Resource Conservation and Recovery Act (tracking hazardous waste)) STATE MASTER (South Carolina database) - HAZARDOUS WASTE PROGRAM Organizations: MIXSON INC DAVID MIXSON (CONTACT/OWNER)
CAROLINA COMPOSITES (213 JEDBURG ROAD in SUMMERVILLE, SC)
AIR SYNTHETIC MINOR (AIRS/AFS) CRITERIA AND HAZARDOUS AIR POLLUTANT INVENTORY (Inventory of air pollution sources) STATE MASTER (South Carolina database) - AIR MAJOR, AIR PROGRAM, TRI REPORTER (Tracking of toxic chemicals releasing facilities) Business SIC classification: BOAT BUILDING AND REPAIRING; MANUFACTURING INDUSTRIES; MARINAS Business NAICS classification: BOAT BUILDING.
ADDCO MINING CO/EVERGREEN MINE (DORCHESTER RD in SUMMERVILLE, SC)
National Pollutant Discharge Elimination System NON-MAJOR (Tracking pollutant discharge elimination systems) - permit Business SIC classification: MISCELLANEOUS NONMETALLIC MINERALS, EXCEPT FUELS
BP OIL-SITE #00443 (348 COLLEGE PARK RD & 1-26 in LADSON, SC)
(Resource Conservation and Recovery Act (tracking hazardous waste)) Organizations: BP OIL-COMPANY OP (CONTACT/OWNER)
COASTAL MINING TRACT MINE (SC HWY 61 in SUMMERVILLE, SC)
National Pollutant Discharge Elimination System NON-MAJOR (Tracking pollutant discharge elimination systems) - permit Business SIC classification: MISCELLANEOUS NONMETALLIC MINERALS, EXCEPT FUELS Alternative names: COASTAL MINING/OLD FIELD MINE
COASTAL MINING/PERRY MINE (BUCKHORN RD in SUMMERVILLE, SC)
National Pollutant Discharge Elimination System NON-MAJOR (Tracking pollutant discharge elimination systems) - permit Business SIC classification: MISCELLANEOUS NONMETALLIC MINERALS, EXCEPT FUELS
CONE UNIT/ASHLEY DISTRICT MINE (OFF CLUBHOUSE RD in SUMMERVILLE, SC)
National Pollutant Discharge Elimination System NON-MAJOR (Tracking pollutant discharge elimination systems) - permit Business SIC classification: MISCELLANEOUS NONMETALLIC MINERALS, EXCEPT FUELS
DORCHESTER COUNTY SPRUCEWOOD CONV SITE (1344 BEECH HILL RD in SUMMERVILLE, SC)
Conditionally Exempt Small Quantity Generators, less than 100 kg/month of hazardous waste (Resource Conservation and Recovery Act (tracking hazardous waste)) Organizations: DOUG TOMPKINS (CONTACT/OPERATOR)
, DORCHESTER COUNTY GOV (CONTACT/OWNER)
Housing units lacking complete plumbing facilities: 0.6% Housing units lacking complete kitchen facilities: 1.0%
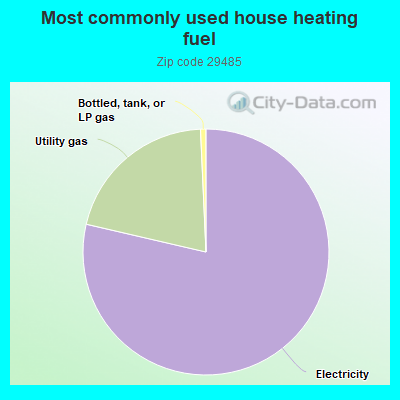
78.0%Electricity
20.5%Utility gas
0.7%Bottled, tank, or LP gas
Population in 1990: 24,856. Population change in the 1990s: +3,481 (+14.0%).
Place of birth for U.S.-born residents:
This state: 22,438
Northeast: 9,702
Midwest: 9,369
South: 11,503
West: 3,308
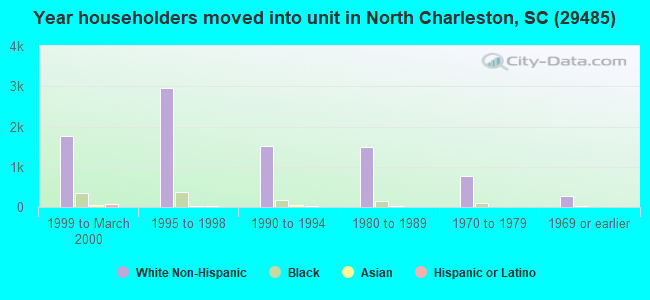
49% of the 29485 zip code residents lived in the same house 5 years ago. Out of people who lived in different houses, 36% lived in this county. Out of people who lived in different counties, 50% lived in South Carolina.
88% of the 29485 zip code residents lived in the same house 1 year ago. Out of people who lived in different houses, 25% moved from this county. Out of people who lived in different houses, 40% moved from different county within same state. Out of people who lived in different houses, 33% moved from different state. Out of people who lived in different houses, 5% moved from abroad.
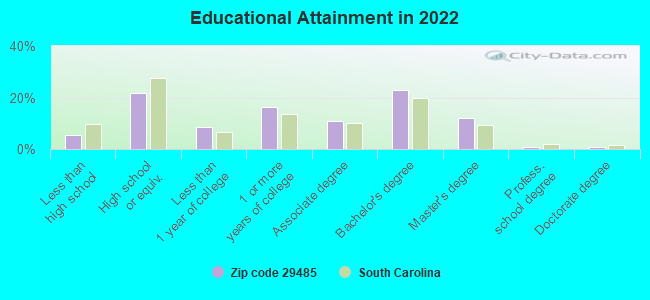
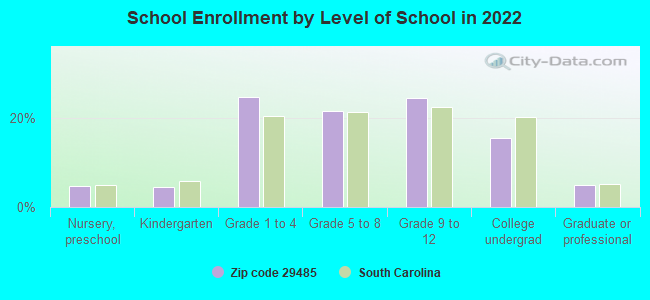
Private vs. public school enrollment:
Students in private schools in grades 1 to 8 (elementary and middle school): 899
Here:
12.3%
South Carolina:
14.4%
Students in private schools in grades 9 to 12 (high school): 461
Here:
11.9%
South Carolina:
11.1%
Students in private undergraduate colleges: 292
Here:
12.0%
South Carolina:
21.9%
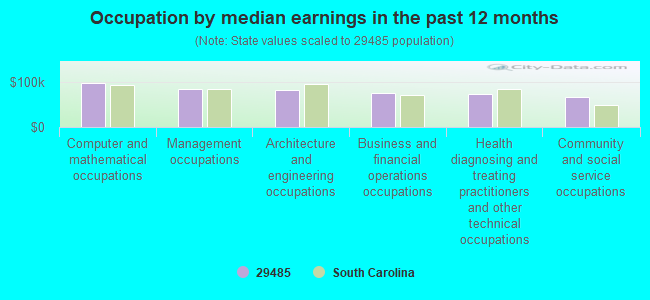
Occupation by median earnings in the past 12 months ($)
97,454Computer and mathematical occupations
84,867Management occupations
82,912Architecture and engineering occupations
75,891Business and financial operations occupations
73,097Health diagnosing and treating practitioners and other technical occupations
65,353Community and social service occupations
Companies with biggest federal contracts located in this zip code (SUMMERVILLE, SC):
EMPIRE AIRCRAFT SERVICES INC (116 GLENDALE DR; small business) : $19,495,011 in 79 contractsfrom 1999 to 2006
Contracts for Other Housekeeping Services, Operation of Government-Owned Facilities -- Airport Runways, Maintenance, Repair and Rebuilding of Equipment -- Aircraft and Airframe Structural Components, Carpet Laying and Cleaning by Air Force, Army Signed by year:2000: $1,761,826; 2001: $1,942,196; 2002: $3,956,632; 2003: $3,446,946; 2004: $3,876,069; 2005: $3,028,818; 2006: $941,623.
Biggest contracts:
$1,715,974 with Air Force for Other Housekeeping Services. Taking place in WA. Signed on 2004-10-01. Completion date: 2005-09-30.
$1,643,620, same as above.Signed on 2003-10-01. Completion date: 2004-09-30.
$1,547,320, same as above.Signed on 2002-10-01. Completion date: 2003-09-30.
$1,470,742, same as above.Signed on 2001-10-01. Completion date: 2002-09-30.
INFOTEC SYSTEMS CORPORATION (701 TRAVELERS BLVD STE 545; small business) : $12,818,133 in 113 contractsfrom 1999 to 2006
Contracts for Miscellaneous Alarm, Signal and Security Detection Systems, Installation of Equipment -- Alarm, Signal, and Security Detection Systems, Surveillance Services, Other ADP and Telecommunications Services (includes data storage on tapes, compact disks, etc.), and moreby Navy, Federal Technology Service, Department of Veterans Affairs, NASA, and others Signed by year:2000: $120,660; 2001: $181,099; 2002: $592,053; 2003: $4,120,256; 2004: $4,057,641; 2005: $3,505,865; 2006: $171,259.
Biggest contracts:
$2,690,515 with Navy for Miscellaneous Alarm, Signal and Security Detection Systems. Taking place in FL. Signed on 2004-05-28. Completion date: 2005-05-31.
$862,288 with Navy for Installation of Equipment -- Alarm, Signal, and Security Detection Systems. Taking place in VA. Signed on 2005-09-21. Completion date: 2006-09-20.
$856,533 with Federal Technology Service for Miscellaneous Alarm, Signal and Security Detection Systems. Signed on 2003-07-15. Completion date: 2003-12-15.
$826,385 with Navy for Installation of Equipment -- Alarm, Signal, and Security Detection Systems. Taking place in VA. Signed on 2005-09-21. Completion date: 2006-09-20.
SOUTHERN TERMINAL SERVICES LLC (116 KING CHARLES CIR; small business) : $2,281,620 in 6 contractsfrom 2000 to 2004
Contracts for Operation of Government-Owned Facilities -- Fuel Storage Buildings, Lease or Rental of Facilities -- Fuel Storage Buildings by Defense Logistics Agency Signed by year:2000: $420,760; 2001: $0; 2002: $0; 2003: $0; 2004: $1,860,860; 2005: $0; 2006: $0.
Biggest contracts:
$1,222,000 with Defense Logistics Agency for Operation of Government-Owned Facilities -- Fuel Storage Buildings. Taking place in CO. Signed on 2004-03-29. Completion date: 2009-10-31.
$420,760 with Defense Logistics Agency for Lease or Rental of Facilities -- Fuel Storage Buildings. Signed on 2000-07-26. Completion date: 2004-12-14.
$418,760 with Defense Logistics Agency for Operation of Government-Owned Facilities -- Fuel Storage Buildings. Signed on 2004-01-22. Completion date: 2004-12-15.
$220,100, same as above.Signed on 2004-10-12. Completion date: 2005-10-11.
WILLIAM N GADOL (314UPSHUR COURT; small business) : $1,362,932 in 140 contractsfrom 2002 to 2006
Contracts for Medical and Surgical Instruments, Equipment, and Supplies by Defense Logistics Agency, Department of Veterans Affairs Signed by year:2000: $0; 2001: $0; 2002: $29,873; 2003: $27,255; 2004: $328,241; 2005: $747,088; 2006: $230,475.
Biggest contracts:
$163,780 with Defense Logistics Agency for Medical and Surgical Instruments, Equipment, and Supplies. Signed on 2005-02-01. Completion date: 2005-02-11.
$120,680, same as above.Signed on 2004-04-01. Completion date: 2004-04-11.
$51,720, same as above.Signed on 2004-04-01. Completion date: 2004-04-11.
$29,873, same as above.Signed on 2002-06-07. Completion date: 2002-06-09.
AMERICAN ELEVATOR CO INC (975 BACONS BRIDGE RD; small business) : $174,716 in 4 contractsfrom 2004 to 2005
$63,624 with Army for Maintenance, Repair or Alteration of Real Property -- Dams. Signed on 2005-08-04. Completion date: 2005-09-06.
$63,624 with U.S. Army Corps of Engineers - civil program financing only for Maintenance, Repair or Alteration of Real Property -- Dams. Signed on 2005-08-04. Completion date: 2005-09-06.
$23,734 with Army for Maintenance, Repair or Alteration of Real Property -- Dams. Signed on 2004-05-11. Completion date: 2004-10-19.
$23,734 with U.S. Army Corps of Engineers - civil program financing only for Maintenance, Repair or Alteration of Real Property -- Dams. Signed on 2004-05-11. Completion date: 2004-10-19.
BLAND MANAGEMENT SERVICE (102 CHESSINGTON CIRCLE; small business)
$170,257 with Navy for Mailing and Distribution Services. Taking place in DC. Signed on 2000-09-27. Completion date: 2001-09-30.
ROBERT PAUL AITKEN (1630 WANNAMAKER AVENUE; small business) : $89,981 in 2 contractsin 2000
$89,981 with Navy for Optometry Services. Signed on 2000-11-30. Completion date: 2001-09-30.
$0, same as above.Signed on 2000-11-30. Completion date: 2001-09-30.
FRANCES M COX (123 PLANTATION DRIVE; small business) : $76,699 in 3 contractsfrom 2004 to 2006
$53,760 with Air Force for Other Professional Services. Signed on 2004-10-01. Completion date: 2005-09-30.
$34,800 with Air Force for Other Medical Services. Signed on 2005-10-01. Completion date: 2006-09-30.
-$11,861, same as above.Signed on 2006-07-06. Completion date: 2006-09-30.
MCS ENVIRONMENTAL LABORATORY (433A OLD TROLLEY RD; small business) : $34,220 in 5 contractsfrom 2004 to 2005
Contracts for Other Quality Control, Testing and Inspection Services -- Miscellaneous, Toxic Substances Support Services by Navy Signed by year:2000: $0; 2001: $0; 2002: $0; 2003: $0; 2004: $30,525; 2005: $3,695; 2006: $0.
Biggest contracts:
$18,495 with Navy for Other Quality Control, Testing and Inspection Services -- Miscellaneous. Signed on 2004-09-27. Completion date: 2004-09-30.
$6,732, same as above.Signed on 2004-02-12. Completion date: 2004-09-30.
$5,298, same as above.Signed on 2004-10-21. Completion date: 2004-09-30.
$2,400, same as above.Signed on 2005-03-25. Completion date: 2004-09-30.
J & J ENTERPRISES (106 SEVEN OAKS LN; small business) : $14,597 in 2 contractsin 2005
$11,160 with Defense Logistics Agency for Medical and Surgical Instruments, Equipment, and Supplies. Signed on 2005-03-31. Completion date: 2005-04-13.
$3,437, same as above.Signed on 2005-03-30. Completion date: 2005-04-09.
Top industries in this zip code by the number of employees in 2005:
2002 - 2018 National Fire Incident Reporting System (NFIRS) incidents
According to the data from the years 2002 - 2018 the average number of fire incidents per year is 78. The highest number of fire incidents - 155 took place in 2017, and the least - 18 in 2003. The data has a growing trend.
When looking into fire subcategories, the most incidents belonged to: Structure Fires (44.7%), and Outside Fires (36.6%).
Fire incident types reported to NFIRS in Zip Code 29485


 Nearest zip codes: 29456, 29420, 29418, 29483, 29423, 29470.


 According to the data from the years 2002 - 2018 the average number of fire incidents per year is 78. The highest number of fire incidents - 155 took place in 2017, and the least - 18 in 2003. The data has a growing trend.
 When looking into fire subcategories, the most incidents belonged to: Structure Fires (44.7%), and Outside Fires (36.6%).