Estimated zip code population in 2022: 53,445 Zip code population in 2010: 35,672 Zip code population in 2000: 20,076
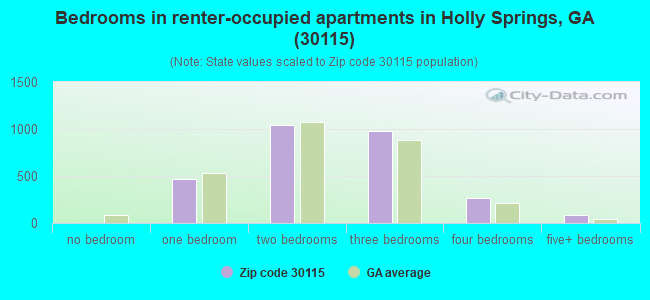
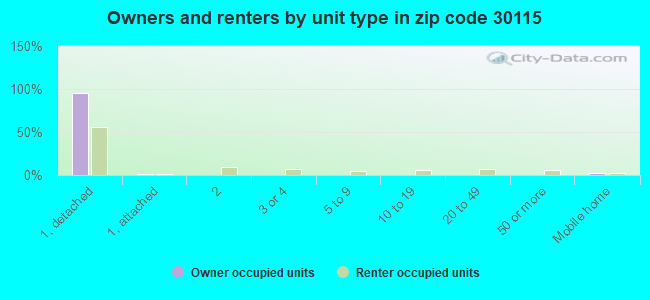
Houses and condos: 18,803 Renter-occupied apartments: 2,845
% of renters here:
16%
State:
34%
March 2022 cost of living index in zip code 30115: 102.4 (near average, U.S. average is 100)
Land area: 60.8 sq. mi. Water area: 0.7 sq. mi.
Population density: 879 people per square mile
(low).
OSM Map
General Map
Google Map
MSN Map
OSM Map
General Map
Google Map
MSN Map
OSM Map
General Map
Google Map
MSN Map
OSM Map
General Map
Google Map
MSN Map
Please wait while loading the map...
Real estate property taxes paid for housing units in 2022:
This zip code:
0.7% ($3,270)
Georgia:
0.7% ($2,160)
Median real estate property taxes paid for housing units with mortgages in 2022: $3,572 (0.7%) Median real estate property taxes paid for housing units with no mortgage in 2022: $1,898 (0.4%)
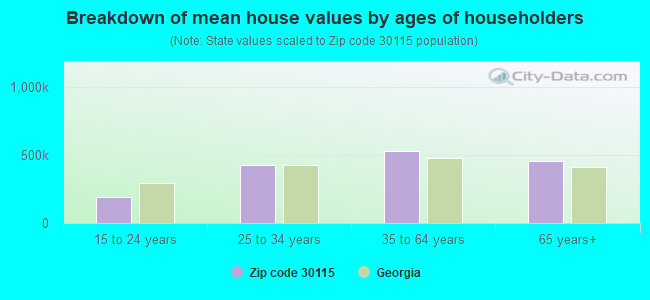
Estimated median house/condo value in 2022: $478,331
30115:
$478,331
Georgia:
$297,400
According to our research of Georgia and other state lists, there were 38 registered sex offenders living in 30115 zip code as of April 27, 2024. The ratio of all residents to sex offenders in zip code 30115 is 1,036 to 1. The ratio of registered sex offenders to all residents in this zip code is much lower than the state average.
Median resident age:
This zip code:
40.5 years
Georgia median age:
37.6 years
Average household size:
This zip code:
2.9 people
Georgia:
2.6 people
Averages for the 2020 tax year for zip code 30115, filed in 2021:
Average Adjusted Gross Income (AGI) in 2020: $98,054 (Individual Income Tax Returns)
Here:
$98,054
State:
$70,847
Salary/wage: $82,481 (reported on 81.6% of returns)
Here:
$82,481
State:
$59,126
(% of AGI for various income ranges: 1165.4% for AGIs below $25k, 3652.5% for AGIs $25k-50k, 6801.8% for AGIs $50k-75k, 9635.2% for AGIs $75k-100k, 19880.0% for AGIs $100k-200k, 73988.3% for AGIs over 200k)
Taxable interest for individuals: $1,897 (reported on 32.1% of returns)
This zip code:
$1,897
Georgia:
$2,011
(% of AGI for various income ranges: 22.0% for AGIs below $25k, 32.5% for AGIs $25k-50k, 51.8% for AGIs $50k-75k, 98.0% for AGIs $75k-100k, 122.2% for AGIs $100k-200k, 827.5% for AGIs over 200k)
Ordinary dividends: $6,346 (reported on 24.2% of returns)
Here:
$6,346
State:
$8,996
(% of AGI for various income ranges: 28.2% for AGIs below $25k, 58.9% for AGIs $25k-50k, 122.9% for AGIs $50k-75k, 191.7% for AGIs $75k-100k, 298.8% for AGIs $100k-200k, 2493.0% for AGIs over 200k)
Net capital gain/loss in AGI: +$26,060 (reported on 21.9% of returns)
Here:
+$26,060
State:
+$28,402
(% of AGI for various income ranges: 13.9% for AGIs below $25k, 45.4% for AGIs $25k-50k, 128.1% for AGIs $50k-75k, 208.2% for AGIs $75k-100k, 491.6% for AGIs $100k-200k, 14621.4% for AGIs over 200k)
Profit/loss from business: +$12,573 (reported on 21.4% of returns)
Here:
+$12,573
State:
+$6,707
(% of AGI for various income ranges: 194.1% for AGIs below $25k, 307.1% for AGIs $25k-50k, 300.4% for AGIs $50k-75k, 394.5% for AGIs $75k-100k, 561.2% for AGIs $100k-200k, 2265.8% for AGIs over 200k)
Taxable individual retirement arrangement distribution: $23,766 (reported on 10.1% of returns)
30115:
$23,766
Georgia:
$20,525
(% of AGI for various income ranges: 62.5% for AGIs below $25k, 139.1% for AGIs $25k-50k, 300.6% for AGIs $50k-75k, 494.1% for AGIs $75k-100k, 729.3% for AGIs $100k-200k, 1945.1% for AGIs over 200k)
Self-employed (Keogh) retirement plans: $18,720 (reported on 0.6% of returns)
30115:
$18,720
Georgia:
$27,751
(% of AGI for various income ranges: 5.6% for AGIs $25k-50k, 15.1% for AGIs $100k-200k, 285.7% for AGIs over 200k)
Total itemized deductions: $34,267 (reported on 17.6% of returns)
Here:
$34,267
State:
$34,001
(% of AGI for various income ranges: 57.2% for AGIs below $25k, 180.9% for AGIs $25k-50k, 493.2% for AGIs $50k-75k, 764.8% for AGIs $75k-100k, 1705.9% for AGIs $100k-200k, 8250.3% for AGIs over 200k)
Charity contributions: $12,927 (reported on 15.1% of returns)
Here:
$12,927
State:
$14,164
(% of AGI for various income ranges: 4.4% for AGIs below $25k, 22.9% for AGIs $25k-50k, 87.6% for AGIs $50k-75k, 144.9% for AGIs $75k-100k, 410.0% for AGIs $100k-200k, 3831.7% for AGIs over 200k)
Taxes paid: $8,404 (reported on 17.5% of returns)
30115:
$8,404
State:
$7,540
(% of AGI for various income ranges: 9.0% for AGIs below $25k, 38.3% for AGIs $25k-50k, 120.9% for AGIs $50k-75k, 212.2% for AGIs $75k-100k, 512.9% for AGIs $100k-200k, 1664.2% for AGIs over 200k)
Earned income credit: $2,139 (reported on 9.4% of returns)
Here:
$2,139
State:
$2,530
(% of AGI for various income ranges: 64.8% for AGIs below $25k, 62.5% for AGIs $25k-50k, 1.5% for AGIs $50k-75k)
Percentage of individuals using paid preparers for their 2020 taxes: 92.6%
Here:
93%
State:
93%
(% for various income ranges: 90.7% for AGIs below $25k, 92.3% for AGIs $25k-50k, 92.9% for AGIs $50k-75k, 92.7% for AGIs $75k-100k, 94.0% for AGIs $100k-200k, 94.8% for AGIs over 200k)
Averages for the 2012 tax year for zip code 30115, filed in 2013:
Average Adjusted Gross Income (AGI) in 2012: $76,671 (Individual Income Tax Returns)
Here:
$76,671
State:
$56,131
Salary/wage: $66,330 (reported on 84.7% of returns)
Here:
$66,330
State:
$47,942
(% of AGI for various income ranges: 73.3% for AGIs below $25k, 78.3% for AGIs $25k-50k, 77.1% for AGIs $50k-75k, 78.0% for AGIs $75k-100k, 80.8% for AGIs $100k-200k, 60.4% for AGIs over 200k)
Taxable interest for individuals: $1,609 (reported on 33.7% of returns)
This zip code:
$1,609
Georgia:
$1,706
(% of AGI for various income ranges: 1.6% for AGIs below $25k, 0.9% for AGIs $25k-50k, 0.8% for AGIs $50k-75k, 0.6% for AGIs $75k-100k, 0.5% for AGIs $100k-200k, 0.7% for AGIs over 200k)
Ordinary dividends: $4,184 (reported on 22.0% of returns)
Here:
$4,184
State:
$7,265
(% of AGI for various income ranges: 1.5% for AGIs below $25k, 1.1% for AGIs $25k-50k, 1.2% for AGIs $50k-75k, 0.8% for AGIs $75k-100k, 1.0% for AGIs $100k-200k, 1.6% for AGIs over 200k)
Net capital gain/loss in AGI: +$27,838 (reported on 16.9% of returns)
Here:
+$27,838
State:
+$16,323
(% of AGI for various income ranges: 0.3% for AGIs $50k-75k, 0.7% for AGIs $75k-100k, 0.8% for AGIs $100k-200k, 19.3% for AGIs over 200k)
Profit/loss from business: +$10,482 (reported on 21.1% of returns)
Here:
+$10,482
State:
+$7,583
(% of AGI for various income ranges: 11.7% for AGIs below $25k, 4.9% for AGIs $25k-50k, 3.0% for AGIs $50k-75k, 2.4% for AGIs $75k-100k, 2.0% for AGIs $100k-200k, 1.9% for AGIs over 200k)
Taxable individual retirement arrangement distribution: $18,930 (reported on 10.1% of returns)
30115:
$18,930
Georgia:
$17,199
(% of AGI for various income ranges: 3.1% for AGIs below $25k, 2.6% for AGIs $25k-50k, 2.9% for AGIs $50k-75k, 3.1% for AGIs $75k-100k, 3.1% for AGIs $100k-200k, 1.3% for AGIs over 200k)
Self-employment retirement plans: $18,611 (reported on 0.5% of returns)
30115:
$18,611
Georgia:
$23,277
(% of AGI for various income ranges: 0.2% for AGIs $25k-50k, 0.1% for AGIs $100k-200k, 0.2% for AGIs over 200k)
Total itemized deductions: $24,571 (19% of AGI, reported on 48.6% of returns)
Here:
$24,571
State:
$23,886
Here:
19.5% of AGI
State:
21.5% of AGI
(% of AGI for various income ranges: 14.0% for AGIs below $25k, 15.5% for AGIs $25k-50k, 18.2% for AGIs $50k-75k, 18.2% for AGIs $75k-100k, 18.3% for AGIs $100k-200k, 10.8% for AGIs over 200k)
Charity contributions: $4,097 (reported on 42.1% of returns)
Here:
$4,097
State:
$5,507
(% of AGI for various income ranges: 1.0% for AGIs below $25k, 1.7% for AGIs $25k-50k, 2.3% for AGIs $50k-75k, 2.5% for AGIs $75k-100k, 2.7% for AGIs $100k-200k, 2.0% for AGIs over 200k)
Taxes paid: $8,320 (reported on 48.4% of returns)
30115:
$8,320
State:
$7,838
(% of AGI for various income ranges: 2.0% for AGIs below $25k, 3.2% for AGIs $25k-50k, 4.7% for AGIs $50k-75k, 5.6% for AGIs $75k-100k, 6.5% for AGIs $100k-200k, 5.2% for AGIs over 200k)
Earned income credit: $2,196 (reported on 13.7% of returns)
Here:
$2,196
State:
$2,589
(% of AGI for various income ranges: 5.8% for AGIs below $25k, 1.1% for AGIs $25k-50k)
Percentage of individuals using paid preparers for their 2012 taxes: 51.4%
Here:
51%
State:
55%
(% for various income ranges: 49.6% for AGIs below $25k, 52.6% for AGIs $25k-50k, 52.5% for AGIs $50k-75k, 49.7% for AGIs $75k-100k, 49.8% for AGIs $100k-200k, 66.3% for AGIs over 200k)
Averages for the 2004 tax year for zip code 30115, filed in 2005:
Average Adjusted Gross Income (AGI) in 2004: $61,580 (Individual Income Tax Returns)
Here:
$61,580
State:
$47,553
Salary/wage: $56,210 (reported on 86.5% of returns)
Here:
$56,210
State:
$42,178
(% of AGI for various income ranges: 200.2% for AGIs below $10k, 75.2% for AGIs $10k-25k, 83.0% for AGIs $25k-50k, 83.1% for AGIs $50k-75k, 86.2% for AGIs $75k-100k, 72.8% for AGIs over 100k)
Taxable interest for individuals: $1,639 (reported on 46.1% of returns)
This zip code:
$1,639
Georgia:
$1,772
(% of AGI for various income ranges: 12.3% for AGIs below $10k, 3.2% for AGIs $10k-25k, 1.4% for AGIs $25k-50k, 1.1% for AGIs $50k-75k, 0.9% for AGIs $75k-100k, 1.0% for AGIs over 100k)
Taxable dividends: $2,779 (reported on 26.9% of returns)
Here:
$2,779
State:
$4,283
(% of AGI for various income ranges: 7.5% for AGIs below $10k, 1.4% for AGIs $10k-25k, 0.6% for AGIs $25k-50k, 0.7% for AGIs $50k-75k, 0.6% for AGIs $75k-100k, 1.7% for AGIs over 100k)
Net capital gain/loss: +$10,643 (reported on 21.2% of returns)
Here:
+$10,643
State:
+$16,461
(% of AGI for various income ranges: 0.6% for AGIs below $10k, 0.5% for AGIs $10k-25k, 0.5% for AGIs $25k-50k, 0.7% for AGIs $50k-75k, 0.8% for AGIs $75k-100k, 7.0% for AGIs over 100k)
Profit/loss from business: +$10,548 (reported on 20.4% of returns)
Here:
+$10,548
State:
+$8,201
(% of AGI for various income ranges: 10.1% for AGIs below $10k, 9.6% for AGIs $10k-25k, 4.9% for AGIs $25k-50k, 2.6% for AGIs $50k-75k, 2.9% for AGIs $75k-100k, 2.9% for AGIs over 100k)
IRA payment deduction: $3,260 (reported on 2.8% of returns)
30115:
$3,260
Georgia:
$2,969
(% of AGI for various income ranges: 0.2% for AGIs $10k-25k, 0.2% for AGIs $25k-50k, 0.2% for AGIs $50k-75k, 0.1% for AGIs $75k-100k, 0.1% for AGIs over 100k)
Self-employed pension: $12,393 (reported on 0.7% of returns)
Here:
$12,393
Georgia:
$16,203
(% of AGI for various income ranges: 0.1% for AGIs $25k-50k, 0.0% for AGIs $50k-75k, 0.1% for AGIs $75k-100k, 0.2% for AGIs over 100k)
Total itemized deductions: $21,116 (23% of AGI, reported on 55.2% of returns)
Here:
$21,116
State:
$19,944
Here:
22.9% of AGI
State:
22.6% of AGI
(% of AGI for various income ranges: 33.8% for AGIs below $10k, 17.7% for AGIs $10k-25k, 19.1% for AGIs $25k-50k, 21.4% for AGIs $50k-75k, 21.1% for AGIs $75k-100k, 17.2% for AGIs over 100k)
Charity contributions deductions: $3,496 (4% of AGI, reported on 49.1% of returns)
Here:
$3,496
State:
$4,354
Here:
3.6% of AGI
State:
4.7% of AGI
(% of AGI for various income ranges: 1.7% for AGIs below $10k, 1.7% for AGIs $10k-25k, 2.1% for AGIs $25k-50k, 2.7% for AGIs $50k-75k, 2.9% for AGIs $75k-100k, 3.1% for AGIs over 100k)
Total tax: $9,157 (reported on 81.5% of returns)
30115:
$9,157
State:
$8,223
(% of AGI for various income ranges: 8.6% for AGIs below $10k, 4.9% for AGIs $10k-25k, 6.6% for AGIs $25k-50k, 7.9% for AGIs $50k-75k, 9.3% for AGIs $75k-100k, 16.9% for AGIs over 100k)
Earned income credit: $1,755 (reported on 10.3% of returns)
Here:
$1,755
State:
$1,986
Percentage of individuals using paid preparers for their 2004 taxes: 55.3%
Here:
55%
State:
62%
(% for various income ranges: 47.2% for AGIs below $10k, 57.2% for AGIs $10k-25k, 57.5% for AGIs $25k-50k, 57.5% for AGIs $50k-75k, 53.0% for AGIs $75k-100k, 57.8% for AGIs over 100k)
Likely homosexual households (counted as self-reported same-sex unmarried-partner households)
Lesbian couples: 0.4% of all households
Gay men: 0.2% of all households
Household received Food Stamps/SNAP in the past 12 months: 521 Household did not receive Food Stamps/SNAP in the past 12 months: 17,507
Women who had a birth in the past 12 months: 603 (531 now married, 72 unmarried) Women who did not have a birth in the past 12 months: 11,910 (6,212 now married, 5,683 unmarried)
Housing units in zip code 30115 with a mortgage: 11,769 (814 second mortgage, 14 home equity loan, 783 both second mortgage and home equity loan) Houses without a mortgage: 386
Median monthly owner costs for units with a mortgage: $1,994 Median monthly owner costs for units without a mortgage: $554
Residents with income below the poverty level in 2022:
This zip code:
4.2%
Whole state:
12.7%
Residents with income below 50% of the poverty level in 2022:
This zip code:
2.2%
Whole state:
6.3%
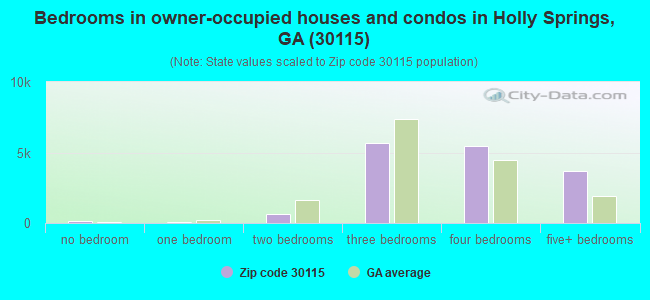
Median number of rooms in houses and condos:
Here:
7.9
State:
6.8
Median number of rooms in apartments:
Here:
5.2
State:
4.6
Notable locations in this zip code not listed on our city pages
Notable locations in zip code 30115: Whispering Pines Camp (A), Iron Horse Farms (B), Hickory Flat Fire Department Station 3 (C), Hickory Flat Fire Department Station 32 (D), Cherokee County Sheriff Headquarters and Detention Center (E), Cherokee County Fire Department Station 4 Free Home (F), Cherokee County Emergency Management Service Station Number 6 (G), Holly Springs Police Station (H), Holly Springs Volunteer Fire Department (I). Display/hide their locations on the map
Churches in zip code 30115 include: Arbor Hill Church (A), Hickory Flat Church of God (B), Church of God (C), Word of Life Church (D), Philadelphia Church (E), New Covenant Church (F), Toonigh Church of God (G), Toonigh Baptist Church (H), Lebanon United Methodist Church (I). Display/hide their locations on the map
Reservoirs: Bradshaw Lake (A), Hurte Lake (B), Garrison Lake (C), Lusk Lake (D), Cagle Lake (E), Statham Lake (F), Carmichael Lake (G), Sellers Lake (H). Display/hide their locations on the map
9,758 married couples with children.
1,670 single-parent households (401 men, 1,269 women).
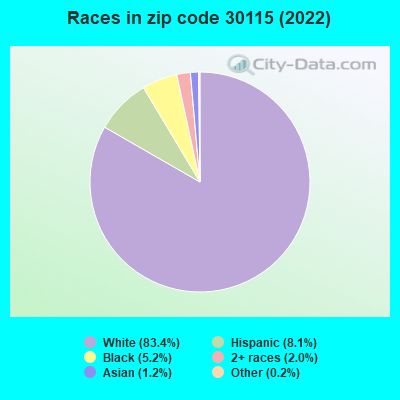
89.3% of residents of 30115 zip code speak English at home.
6.0% of residents speak Spanish at home (64% very well, 24% well, 1% not well, 11% not at all).
3.7% of residents speak other Indo-European language at home (66% very well, 20% well, 13% not well, 1% not at all).
0.6% of residents speak Asian or Pacific Island language at home (56% very well, 18% well, 5% not well, 21% not at all).
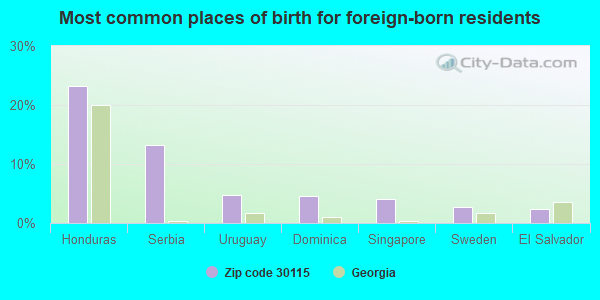
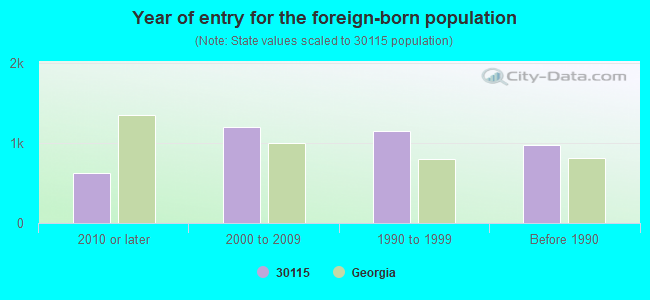
Foreign born population: 3,684 (6.9%) (60.0% of them are naturalized citizens)
Facilities with environmental interests located in this zip code:
MACEDONIA ELEMENTARY SCHOOL (10370 EAST CHEROKEE DRIVE in CANTON, GA)
(Geographic Names Information System) (National Center for Education Statistics) - STATE ID-5052 Organizations: CHEROKEE COUNTY (SCHOOL DISTRICT)
BROOKSTONE FINE WOOD PRODUCTS (12230 CUMMING HWY in CANTON, GA)
Large Quantity Generators, more that 1000 kg of hazardous waste/month (Resource Conservation and Recovery Act (tracking hazardous waste)) Organizations: HALSTON CO LLC (CONTACT/OPERATOR)
BLANKENSHIP SAND (KNOX BRIDGE PIT in CANTON, GA)
National Pollutant Discharge Elimination System NON-MAJOR (Tracking pollutant discharge elimination systems) - permit Alternative names: BLANKENSHIP-KNOX BRIDGE PIT
BLANKENSHIP SAND (KEITHBURG SITE in CANTON, GA)
National Pollutant Discharge Elimination System NON-MAJOR (Tracking pollutant discharge elimination systems) - permit Alternative names: BLANKENSHIP-KEITHBURG SITE
BLANKENSHIP SAND-MULBERRY SITE ( in HOSCHTON, GA)
National Pollutant Discharge Elimination System NON-MAJOR (Tracking pollutant discharge elimination systems) - permit Alternative names: BLANKENSHIP-MULBERRY SITE
BLANKENSHIP- BLANTON BOTTOM (ON ETOWAH RVR ADJ TO BROOKS DR in CANTON, GA)
National Pollutant Discharge Elimination System NON-MAJOR (Tracking pollutant discharge elimination systems) - permit Alternative names: BLANKENSHIP SAND
BLANKENSHIP-GOLD KIST PIT (GOLD KIST PIT in CANTON, GA)
National Pollutant Discharge Elimination System NON-MAJOR (Tracking pollutant discharge elimination systems) - permit Alternative names: BLANKENSHIP SAND
CHEROKEE AUTO BODY (2374 SUGAR PIKE RD in CANTON, GA)
Conditionally Exempt Small Quantity Generators, less than 100 kg/month of hazardous waste (Resource Conservation and Recovery Act (tracking hazardous waste)) - notification Organizations: OPERNAME (CONTACT/OPERATOR)
, NIX JERRY (CONTACT/OWNER)
CHEROKEE CO FLEET MAINTENANCE (421 CHATTIN RD in CANTON, GA)
Small Quantity Generators, between 100 kg and 1000 kg of hazardous waste/month (Resource Conservation and Recovery Act (tracking hazardous waste)) - notification TRANSPORTER (Resource Conservation and Recovery Act (tracking hazardous waste)) - notification Organizations: CHEROKEE CO BOARD OF COMMERCE (CONTACT/OWNER)
NOR-RAL PLASTICS INC (164 HICKORY SPRINGS INDUS DR in CANTON, GA)
Small Quantity Generators, between 100 kg and 1000 kg of hazardous waste/month (Resource Conservation and Recovery Act (tracking hazardous waste)) Organizations: NOR-RAL PLASTICKS INC (CONTACT/OPERATOR)
, NORRIS A MC WHORTER (CONTACT/OWNER)
MILNER BODY WORKS INC (1040 HICKORY FLAT HWY in CANTON, GA)
Conditionally Exempt Small Quantity Generators, less than 100 kg/month of hazardous waste (Resource Conservation and Recovery Act (tracking hazardous waste)) - notification Organizations: OPERNAME (CONTACT/OPERATOR)
, MILNER BILLY (CONTACT/OWNER)
MOBILE PIT STOP INC (211 WRIGHTS MILL WAY in CANTON, GA)
USED OIL PROGRAM (Resource Conservation and Recovery Act (tracking hazardous waste)) Business NAICS classification: AUTOMOTIVE OIL CHANGE AND LUBRICATION SHOPS. Organizations: RICHARD L FAGAN (CONTACT/OPERATOR)
Housing units lacking complete plumbing facilities: 0.4% Housing units lacking complete kitchen facilities: 1.0%
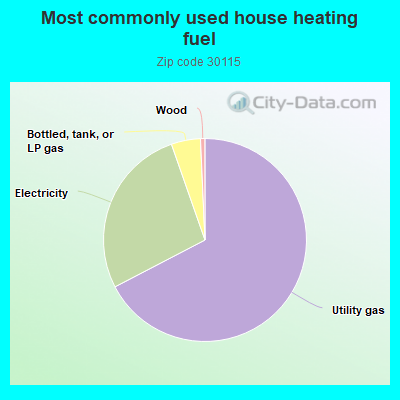
66.7%Utility gas
27.0%Electricity
4.6%Bottled, tank, or LP gas
0.7%Wood
Place of birth for U.S.-born residents:
This state: 26,353
Northeast: 5,067
Midwest: 5,955
South: 9,099
West: 2,914
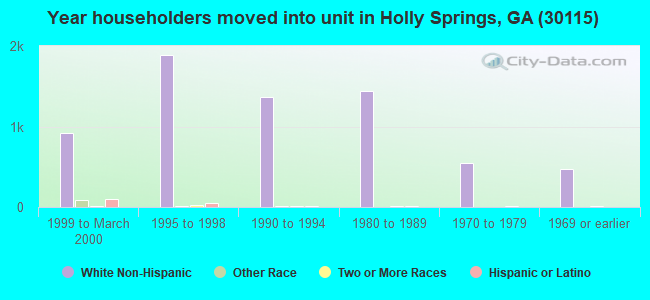
55% of the 30115 zip code residents lived in the same house 5 years ago. Out of people who lived in different houses, 39% lived in this county. Out of people who lived in different counties, 50% lived in Georgia.
88% of the 30115 zip code residents lived in the same house 1 year ago. Out of people who lived in different houses, 38% moved from this county. Out of people who lived in different houses, 38% moved from different county within same state. Out of people who lived in different houses, 24% moved from different state. Out of people who lived in different houses, 0% moved from abroad.
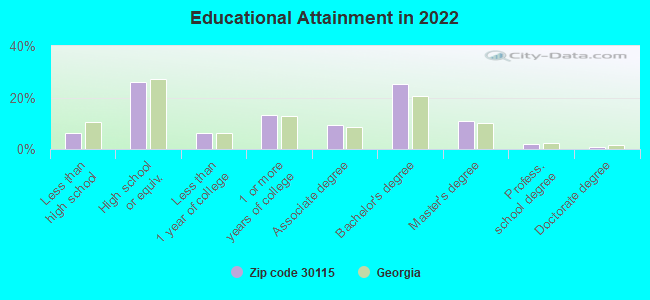
Private vs. public school enrollment:
Students in private schools in grades 1 to 8 (elementary and middle school): 365
Here:
6.6%
Georgia:
12.1%
Students in private schools in grades 9 to 12 (high school): 587
Here:
14.3%
Georgia:
10.8%
Students in private undergraduate colleges: 444
Here:
20.0%
Georgia:
17.1%
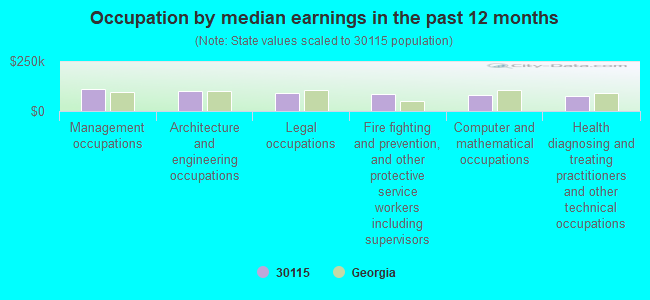
Occupation by median earnings in the past 12 months ($)
112,011Management occupations
100,571Architecture and engineering occupations
92,898Legal occupations
86,116Fire fighting and prevention, and other protective service workers including supervisors
80,373Computer and mathematical occupations
76,392Health diagnosing and treating practitioners and other technical occupations
Companies with federal contracts located in this zip code (CANTON, GA):
NOR-RAL PLASTICS INC (164 HICKORY SPRINGS INDUST; small business) : $814,338 in 73 contractsfrom 2003 to 2006
Contracts for Bushings, Rings, Shims, and Spacers, Airframe Structural Components, Engine Electrical System Components, Aircraft Prime Moving, Miscellaneous Aircraft Accessories and Components, and moreby Defense Logistics Agency Signed by year:2000: $0; 2001: $0; 2002: $0; 2003: $0; 2004: $522,028; 2005: $238,087; 2006: $54,223.
Biggest contracts:
$195,452 with Defense Logistics Agency for Bushings, Rings, Shims, and Spacers. Signed on 2004-02-27. Completion date: 2004-07-11.
$95,751 with Defense Logistics Agency for Airframe Structural Components. Signed on 2004-10-08. Completion date: 2005-02-28.
$95,751, same as above.Signed on 2004-04-15. Completion date: 2004-10-17.
$39,990, same as above.Signed on 2005-01-20. Completion date: 2005-09-17.
GEORGIA FIRE & RESCUE SUPPLY, (602 WATER TANK RD; small business)
$33,501 with Army for Safety and Rescue Equipment. Signed on 2003-09-29. Completion date: 2003-10-31.
WILLIAMSON, ROBERT (387 BIG OAK DR; small business)
$9,500 with Army for Maintenance, Repair and Rebuilding of Equipment -- Musical Instruments, Phonographs, and Home-Type Radios. Signed on 2004-09-29. Completion date: 2004-10-07.
THOMPSON, HAROLD (1515 GREENWOOD CT; small business) : $3,965 in 2 contractsin 2003
$5,070 with U.S. Army Corps of Engineers - civil program financing only for Recreation Site Maintenance Services (non-construction). Signed on 2003-03-26. Completion date: 2003-09-03.
-$1,105, same as above.Signed on 2003-08-05. Completion date: 2003-09-03.
BEMD, INC (436 HIRAM WAY; small business) : $0 in 2 contractsin 2004
$14,850 with Navy for Miscellaneous Secondary Metal Forming and Cutting Machines. Signed on 2004-03-15. Completion date: 2004-06-15.
-$14,850, same as above.Signed on 2004-07-01. Completion date: 2004-06-15.
Top industries in this zip code by the number of employees in 2005:
2002 - 2018 National Fire Incident Reporting System (NFIRS) incidents
According to the data from the years 2002 - 2018 the average number of fires per year is 114. The highest number of reported fire incidents - 168 took place in 2006, and the least - 13 in 2004. The data has a decreasing trend.
When looking into fire subcategories, the most incidents belonged to: Outside Fires (49.6%), and Structure Fires (32.6%).
Fire incident types reported to NFIRS in Zip Code 30115

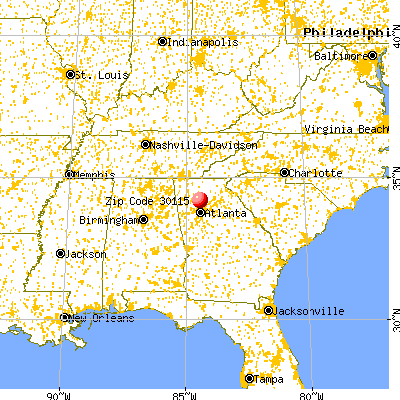


 Nearest zip codes: 30188, 30004, 30114, 30107, 30075, 30009.


 According to the data from the years 2002 - 2018 the average number of fires per year is 114. The highest number of reported fire incidents - 168 took place in 2006, and the least - 13 in 2004. The data has a decreasing trend.
 When looking into fire subcategories, the most incidents belonged to: Outside Fires (49.6%), and Structure Fires (32.6%).