Holly Springs, Georgia Submit your own pictures of this city and show them to the world
OSM Map
General Map
Google Map
MSN Map
OSM Map
General Map
Google Map
MSN Map
OSM Map
General Map
Google Map
MSN Map
OSM Map
General Map
Google Map
MSN Map
Please wait while loading the map...
Population in 2022: 18,739 (100% urban, 0% rural). Population change since 2000: +486.5%Males: 9,320 Females: 9,419
March 2022 cost of living index in Holly Springs: 102.0 (near average, U.S. average is 100) Percentage of residents living in poverty in 2022: 4.0%for White Non-Hispanic residents , 1.2% for Black residents , 2.6% for Hispanic or Latino residents )Business Search - 14 Million verified businesses
Data:
Median household income ($)
Median household income (% change since 2000)
Household income diversity
Ratio of average income to average house value (%)
Ratio of average income to average rent
Median household income ($) - White
Median household income ($) - Black or African American
Median household income ($) - Asian
Median household income ($) - Hispanic or Latino
Median household income ($) - American Indian and Alaska Native
Median household income ($) - Multirace
Median household income ($) - Other Race
Median household income for houses/condos with a mortgage ($)
Median household income for apartments without a mortgage ($)
Races - White alone (%)
Races - White alone (% change since 2000)
Races - Black alone (%)
Races - Black alone (% change since 2000)
Races - American Indian alone (%)
Races - American Indian alone (% change since 2000)
Races - Asian alone (%)
Races - Asian alone (% change since 2000)
Races - Hispanic (%)
Races - Hispanic (% change since 2000)
Races - Native Hawaiian and Other Pacific Islander alone (%)
Races - Native Hawaiian and Other Pacific Islander alone (% change since 2000)
Races - Two or more races (%)
Races - Two or more races (% change since 2000)
Races - Other race alone (%)
Races - Other race alone (% change since 2000)
Racial diversity
Unemployment (%)
Unemployment (% change since 2000)
Unemployment (%) - White
Unemployment (%) - Black or African American
Unemployment (%) - Asian
Unemployment (%) - Hispanic or Latino
Unemployment (%) - American Indian and Alaska Native
Unemployment (%) - Multirace
Unemployment (%) - Other Race
Population density (people per square mile)
Population - Males (%)
Population - Females (%)
Population - Males (%) - White
Population - Males (%) - Black or African American
Population - Males (%) - Asian
Population - Males (%) - Hispanic or Latino
Population - Males (%) - American Indian and Alaska Native
Population - Males (%) - Multirace
Population - Males (%) - Other Race
Population - Females (%) - White
Population - Females (%) - Black or African American
Population - Females (%) - Asian
Population - Females (%) - Hispanic or Latino
Population - Females (%) - American Indian and Alaska Native
Population - Females (%) - Multirace
Population - Females (%) - Other Race
Coronavirus confirmed cases (Apr 27, 2024)
Deaths caused by coronavirus (Apr 27, 2024)
Coronavirus confirmed cases (per 100k population) (Apr 27, 2024)
Deaths caused by coronavirus (per 100k population) (Apr 27, 2024)
Daily increase in number of cases (Apr 27, 2024)
Weekly increase in number of cases (Apr 27, 2024)
Cases doubled (in days) (Apr 27, 2024)
Hospitalized patients (Apr 18, 2022)
Negative test results (Apr 18, 2022)
Total test results (Apr 18, 2022)
COVID Vaccine doses distributed (per 100k population) (Sep 19, 2023)
COVID Vaccine doses administered (per 100k population) (Sep 19, 2023)
COVID Vaccine doses distributed (Sep 19, 2023)
COVID Vaccine doses administered (Sep 19, 2023)
Likely homosexual households (%)
Likely homosexual households (% change since 2000)
Likely homosexual households - Lesbian couples (%)
Likely homosexual households - Lesbian couples (% change since 2000)
Likely homosexual households - Gay men (%)
Likely homosexual households - Gay men (% change since 2000)
Cost of living index
Median gross rent ($)
Median contract rent ($)
Median monthly housing costs ($)
Median house or condo value ($)
Median house or condo value ($ change since 2000)
Mean house or condo value by units in structure - 1, detached ($)
Mean house or condo value by units in structure - 1, attached ($)
Mean house or condo value by units in structure - 2 ($)
Mean house or condo value by units in structure by units in structure - 3 or 4 ($)
Mean house or condo value by units in structure - 5 or more ($)
Mean house or condo value by units in structure - Boat, RV, van, etc. ($)
Mean house or condo value by units in structure - Mobile home ($)
Median house or condo value ($) - White
Median house or condo value ($) - Black or African American
Median house or condo value ($) - Asian
Median house or condo value ($) - Hispanic or Latino
Median house or condo value ($) - American Indian and Alaska Native
Median house or condo value ($) - Multirace
Median house or condo value ($) - Other Race
Median resident age
Resident age diversity
Median resident age - Males
Median resident age - Females
Median resident age - White
Median resident age - Black or African American
Median resident age - Asian
Median resident age - Hispanic or Latino
Median resident age - American Indian and Alaska Native
Median resident age - Multirace
Median resident age - Other Race
Median resident age - Males - White
Median resident age - Males - Black or African American
Median resident age - Males - Asian
Median resident age - Males - Hispanic or Latino
Median resident age - Males - American Indian and Alaska Native
Median resident age - Males - Multirace
Median resident age - Males - Other Race
Median resident age - Females - White
Median resident age - Females - Black or African American
Median resident age - Females - Asian
Median resident age - Females - Hispanic or Latino
Median resident age - Females - American Indian and Alaska Native
Median resident age - Females - Multirace
Median resident age - Females - Other Race
Commute - mean travel time to work (minutes)
Travel time to work - Less than 5 minutes (%)
Travel time to work - Less than 5 minutes (% change since 2000)
Travel time to work - 5 to 9 minutes (%)
Travel time to work - 5 to 9 minutes (% change since 2000)
Travel time to work - 10 to 19 minutes (%)
Travel time to work - 10 to 19 minutes (% change since 2000)
Travel time to work - 20 to 29 minutes (%)
Travel time to work - 20 to 29 minutes (% change since 2000)
Travel time to work - 30 to 39 minutes (%)
Travel time to work - 30 to 39 minutes (% change since 2000)
Travel time to work - 40 to 59 minutes (%)
Travel time to work - 40 to 59 minutes (% change since 2000)
Travel time to work - 60 to 89 minutes (%)
Travel time to work - 60 to 89 minutes (% change since 2000)
Travel time to work - 90 or more minutes (%)
Travel time to work - 90 or more minutes (% change since 2000)
Marital status - Never married (%)
Marital status - Now married (%)
Marital status - Separated (%)
Marital status - Widowed (%)
Marital status - Divorced (%)
Median family income ($)
Median family income (% change since 2000)
Median non-family income ($)
Median non-family income (% change since 2000)
Median per capita income ($)
Median per capita income (% change since 2000)
Median family income ($) - White
Median family income ($) - Black or African American
Median family income ($) - Asian
Median family income ($) - Hispanic or Latino
Median family income ($) - American Indian and Alaska Native
Median family income ($) - Multirace
Median family income ($) - Other Race
Median year house/condo built
Median year apartment built
Year house built - Built 2005 or later (%)
Year house built - Built 2000 to 2004 (%)
Year house built - Built 1990 to 1999 (%)
Year house built - Built 1980 to 1989 (%)
Year house built - Built 1970 to 1979 (%)
Year house built - Built 1960 to 1969 (%)
Year house built - Built 1950 to 1959 (%)
Year house built - Built 1940 to 1949 (%)
Year house built - Built 1939 or earlier (%)
Average household size
Household density (households per square mile)
Average household size - White
Average household size - Black or African American
Average household size - Asian
Average household size - Hispanic or Latino
Average household size - American Indian and Alaska Native
Average household size - Multirace
Average household size - Other Race
Occupied housing units (%)
Vacant housing units (%)
Owner occupied housing units (%)
Renter occupied housing units (%)
Vacancy status - For rent (%)
Vacancy status - For sale only (%)
Vacancy status - Rented or sold, not occupied (%)
Vacancy status - For seasonal, recreational, or occasional use (%)
Vacancy status - For migrant workers (%)
Vacancy status - Other vacant (%)
Residents with income below the poverty level (%)
Residents with income below 50% of the poverty level (%)
Children below poverty level (%)
Poor families by family type - Married-couple family (%)
Poor families by family type - Male, no wife present (%)
Poor families by family type - Female, no husband present (%)
Poverty status for native-born residents (%)
Poverty status for foreign-born residents (%)
Poverty among high school graduates not in families (%)
Poverty among people who did not graduate high school not in families (%)
Residents with income below the poverty level (%) - White
Residents with income below the poverty level (%) - Black or African American
Residents with income below the poverty level (%) - Asian
Residents with income below the poverty level (%) - Hispanic or Latino
Residents with income below the poverty level (%) - American Indian and Alaska Native
Residents with income below the poverty level (%) - Multirace
Residents with income below the poverty level (%) - Other Race
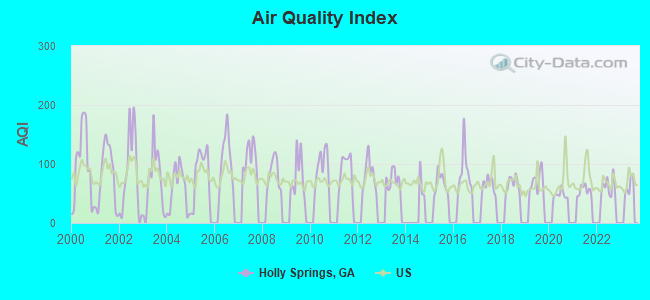
Air pollution - Air Quality Index (AQI)
Air pollution - CO
Air pollution - NO2
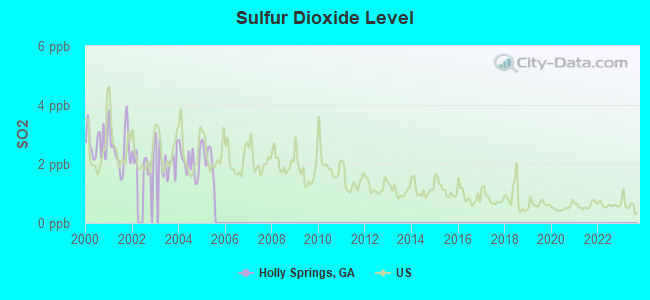
Air pollution - SO2
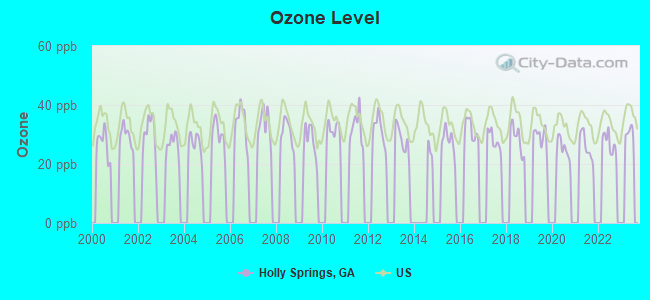
Air pollution - Ozone
Air pollution - PM10
Air pollution - PM25
Air pollution - Pb
Crime - Murders per 100,000 population
Crime - Rapes per 100,000 population
Crime - Robberies per 100,000 population
Crime - Assaults per 100,000 population
Crime - Burglaries per 100,000 population
Crime - Thefts per 100,000 population
Crime - Auto thefts per 100,000 population
Crime - Arson per 100,000 population
Crime - City-data.com crime index
Crime - Violent crime index
Crime - Property crime index
Crime - Murders per 100,000 population (5 year average)
Crime - Rapes per 100,000 population (5 year average)
Crime - Robberies per 100,000 population (5 year average)
Crime - Assaults per 100,000 population (5 year average)
Crime - Burglaries per 100,000 population (5 year average)
Crime - Thefts per 100,000 population (5 year average)
Crime - Auto thefts per 100,000 population (5 year average)
Crime - Arson per 100,000 population (5 year average)
Crime - City-data.com crime index (5 year average)
Crime - Violent crime index (5 year average)
Crime - Property crime index (5 year average)
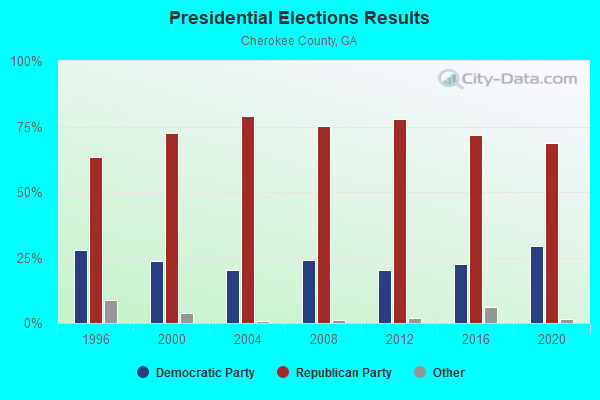
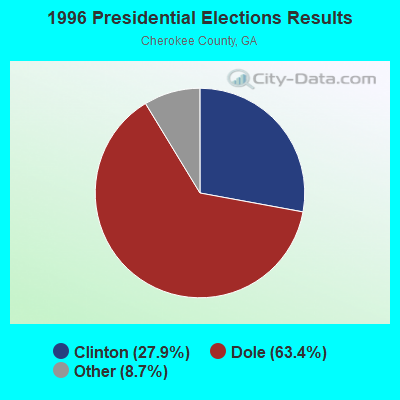
1996 Presidential Elections Results (%) - Democratic Party (Clinton)
1996 Presidential Elections Results (%) - Republican Party (Dole)
1996 Presidential Elections Results (%) - Other
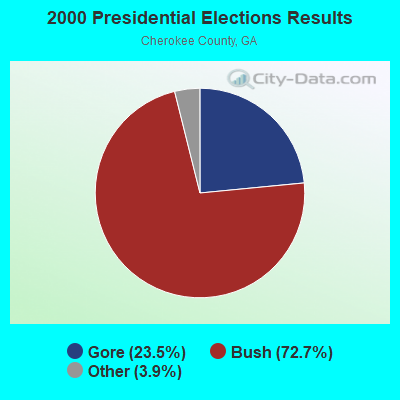
2000 Presidential Elections Results (%) - Democratic Party (Gore)
2000 Presidential Elections Results (%) - Republican Party (Bush)
2000 Presidential Elections Results (%) - Other
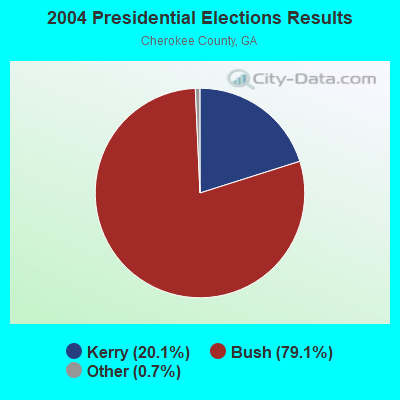
2004 Presidential Elections Results (%) - Democratic Party (Kerry)
2004 Presidential Elections Results (%) - Republican Party (Bush)
2004 Presidential Elections Results (%) - Other
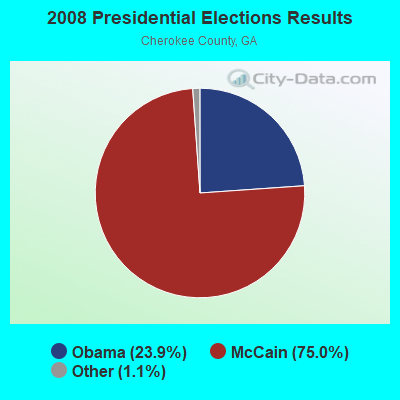
2008 Presidential Elections Results (%) - Democratic Party (Obama)
2008 Presidential Elections Results (%) - Republican Party (McCain)
2008 Presidential Elections Results (%) - Other
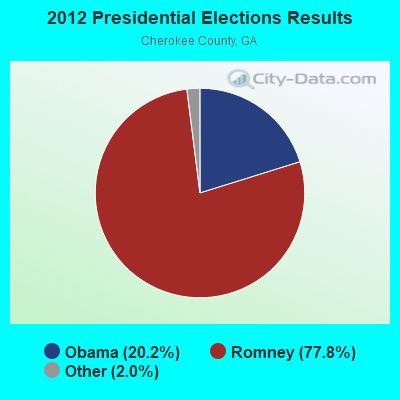
2012 Presidential Elections Results (%) - Democratic Party (Obama)
2012 Presidential Elections Results (%) - Republican Party (Romney)
2012 Presidential Elections Results (%) - Other
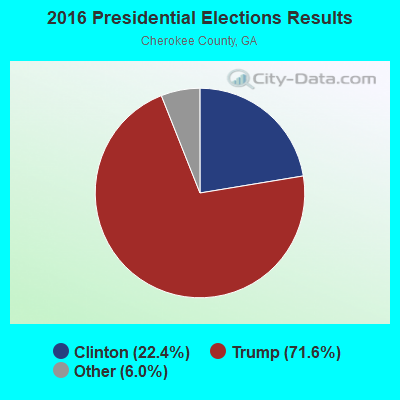
2016 Presidential Elections Results (%) - Democratic Party (Clinton)
2016 Presidential Elections Results (%) - Republican Party (Trump)
2016 Presidential Elections Results (%) - Other
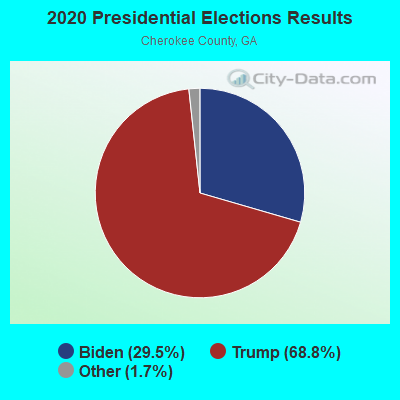
2020 Presidential Elections Results (%) - Democratic Party (Biden)
2020 Presidential Elections Results (%) - Republican Party (Trump)
2020 Presidential Elections Results (%) - Other
Ancestries Reported - Arab (%)
Ancestries Reported - Czech (%)
Ancestries Reported - Danish (%)
Ancestries Reported - Dutch (%)
Ancestries Reported - English (%)
Ancestries Reported - French (%)
Ancestries Reported - French Canadian (%)
Ancestries Reported - German (%)
Ancestries Reported - Greek (%)
Ancestries Reported - Hungarian (%)
Ancestries Reported - Irish (%)
Ancestries Reported - Italian (%)
Ancestries Reported - Lithuanian (%)
Ancestries Reported - Norwegian (%)
Ancestries Reported - Polish (%)
Ancestries Reported - Portuguese (%)
Ancestries Reported - Russian (%)
Ancestries Reported - Scotch-Irish (%)
Ancestries Reported - Scottish (%)
Ancestries Reported - Slovak (%)
Ancestries Reported - Subsaharan African (%)
Ancestries Reported - Swedish (%)
Ancestries Reported - Swiss (%)
Ancestries Reported - Ukrainian (%)
Ancestries Reported - United States (%)
Ancestries Reported - Welsh (%)
Ancestries Reported - West Indian (%)
Ancestries Reported - Other (%)
Educational Attainment - No schooling completed (%)
Educational Attainment - Less than high school (%)
Educational Attainment - High school or equivalent (%)
Educational Attainment - Less than 1 year of college (%)
Educational Attainment - 1 or more years of college (%)
Educational Attainment - Associate degree (%)
Educational Attainment - Bachelor's degree (%)
Educational Attainment - Master's degree (%)
Educational Attainment - Professional school degree (%)
Educational Attainment - Doctorate degree (%)
School Enrollment - Nursery, preschool (%)
School Enrollment - Kindergarten (%)
School Enrollment - Grade 1 to 4 (%)
School Enrollment - Grade 5 to 8 (%)
School Enrollment - Grade 9 to 12 (%)
School Enrollment - College undergrad (%)
School Enrollment - Graduate or professional (%)
School Enrollment - Not enrolled in school (%)
School enrollment - Public schools (%)
School enrollment - Private schools (%)
School enrollment - Not enrolled (%)
Median number of rooms in houses and condos
Median number of rooms in apartments
Housing units lacking complete plumbing facilities (%)
Housing units lacking complete kitchen facilities (%)
Density of houses
Urban houses (%)
Rural houses (%)
Households with people 60 years and over (%)
Households with people 65 years and over (%)
Households with people 75 years and over (%)
Households with one or more nonrelatives (%)
Households with no nonrelatives (%)
Population in households (%)
Family households (%)
Nonfamily households (%)
Population in families (%)
Family households with own children (%)
Median number of bedrooms in owner occupied houses
Mean number of bedrooms in owner occupied houses
Median number of bedrooms in renter occupied houses
Mean number of bedrooms in renter occupied houses
Median number of vehichles in owner occupied houses
Mean number of vehichles in owner occupied houses
Median number of vehichles in renter occupied houses
Mean number of vehichles in renter occupied houses
Mortgage status - with mortgage (%)
Mortgage status - with second mortgage (%)
Mortgage status - with home equity loan (%)
Mortgage status - with both second mortgage and home equity loan (%)
Mortgage status - without a mortgage (%)
Average family size
Average family size - White
Average family size - Black or African American
Average family size - Asian
Average family size - Hispanic or Latino
Average family size - American Indian and Alaska Native
Average family size - Multirace
Average family size - Other Race
Geographical mobility - Same house 1 year ago (%)
Geographical mobility - Moved within same county (%)
Geographical mobility - Moved from different county within same state (%)
Geographical mobility - Moved from different state (%)
Geographical mobility - Moved from abroad (%)
Place of birth - Born in state of residence (%)
Place of birth - Born in other state (%)
Place of birth - Native, outside of US (%)
Place of birth - Foreign born (%)
Housing units in structures - 1, detached (%)
Housing units in structures - 1, attached (%)
Housing units in structures - 2 (%)
Housing units in structures - 3 or 4 (%)
Housing units in structures - 5 to 9 (%)
Housing units in structures - 10 to 19 (%)
Housing units in structures - 20 to 49 (%)
Housing units in structures - 50 or more (%)
Housing units in structures - Mobile home (%)
Housing units in structures - Boat, RV, van, etc. (%)
House/condo owner moved in on average (years ago)
Renter moved in on average (years ago)
Year householder moved into unit - Moved in 1999 to March 2000 (%)
Year householder moved into unit - Moved in 1995 to 1998 (%)
Year householder moved into unit - Moved in 1990 to 1994 (%)
Year householder moved into unit - Moved in 1980 to 1989 (%)
Year householder moved into unit - Moved in 1970 to 1979 (%)
Year householder moved into unit - Moved in 1969 or earlier (%)
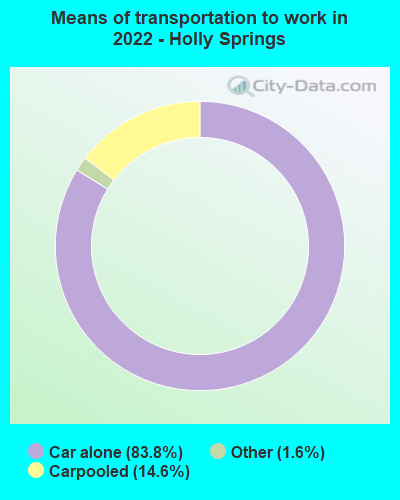
Means of transportation to work - Drove car alone (%)
Means of transportation to work - Carpooled (%)
Means of transportation to work - Public transportation (%)
Means of transportation to work - Bus or trolley bus (%)
Means of transportation to work - Streetcar or trolley car (%)
Means of transportation to work - Subway or elevated (%)
Means of transportation to work - Railroad (%)
Means of transportation to work - Ferryboat (%)
Means of transportation to work - Taxicab (%)
Means of transportation to work - Motorcycle (%)
Means of transportation to work - Bicycle (%)
Means of transportation to work - Walked (%)
Means of transportation to work - Other means (%)
Working at home (%)
Industry diversity
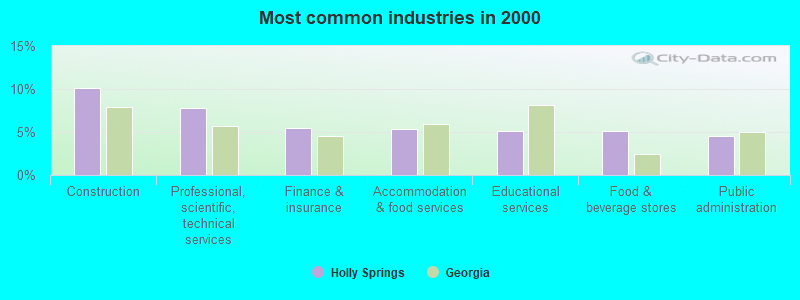
Most Common Industries - Agriculture, forestry, fishing and hunting, and mining (%)
Most Common Industries - Agriculture, forestry, fishing and hunting (%)
Most Common Industries - Mining, quarrying, and oil and gas extraction (%)
Most Common Industries - Construction (%)
Most Common Industries - Manufacturing (%)
Most Common Industries - Wholesale trade (%)
Most Common Industries - Retail trade (%)
Most Common Industries - Transportation and warehousing, and utilities (%)
Most Common Industries - Transportation and warehousing (%)
Most Common Industries - Utilities (%)
Most Common Industries - Information (%)
Most Common Industries - Finance and insurance, and real estate and rental and leasing (%)
Most Common Industries - Finance and insurance (%)
Most Common Industries - Real estate and rental and leasing (%)
Most Common Industries - Professional, scientific, and management, and administrative and waste management services (%)
Most Common Industries - Professional, scientific, and technical services (%)
Most Common Industries - Management of companies and enterprises (%)
Most Common Industries - Administrative and support and waste management services (%)
Most Common Industries - Educational services, and health care and social assistance (%)
Most Common Industries - Educational services (%)
Most Common Industries - Health care and social assistance (%)
Most Common Industries - Arts, entertainment, and recreation, and accommodation and food services (%)
Most Common Industries - Arts, entertainment, and recreation (%)
Most Common Industries - Accommodation and food services (%)
Most Common Industries - Other services, except public administration (%)
Most Common Industries - Public administration (%)
Occupation diversity
Most Common Occupations - Management, business, science, and arts occupations (%)
Most Common Occupations - Management, business, and financial occupations (%)
Most Common Occupations - Management occupations (%)
Most Common Occupations - Business and financial operations occupations (%)
Most Common Occupations - Computer, engineering, and science occupations (%)
Most Common Occupations - Computer and mathematical occupations (%)
Most Common Occupations - Architecture and engineering occupations (%)
Most Common Occupations - Life, physical, and social science occupations (%)
Most Common Occupations - Education, legal, community service, arts, and media occupations (%)
Most Common Occupations - Community and social service occupations (%)
Most Common Occupations - Legal occupations (%)
Most Common Occupations - Education, training, and library occupations (%)
Most Common Occupations - Arts, design, entertainment, sports, and media occupations (%)
Most Common Occupations - Healthcare practitioners and technical occupations (%)
Most Common Occupations - Health diagnosing and treating practitioners and other technical occupations (%)
Most Common Occupations - Health technologists and technicians (%)
Most Common Occupations - Service occupations (%)
Most Common Occupations - Healthcare support occupations (%)
Most Common Occupations - Protective service occupations (%)
Most Common Occupations - Fire fighting and prevention, and other protective service workers including supervisors (%)
Most Common Occupations - Law enforcement workers including supervisors (%)
Most Common Occupations - Food preparation and serving related occupations (%)
Most Common Occupations - Building and grounds cleaning and maintenance occupations (%)
Most Common Occupations - Personal care and service occupations (%)
Most Common Occupations - Sales and office occupations (%)
Most Common Occupations - Sales and related occupations (%)
Most Common Occupations - Office and administrative support occupations (%)
Most Common Occupations - Natural resources, construction, and maintenance occupations (%)
Most Common Occupations - Farming, fishing, and forestry occupations (%)
Most Common Occupations - Construction and extraction occupations (%)
Most Common Occupations - Installation, maintenance, and repair occupations (%)
Most Common Occupations - Production, transportation, and material moving occupations (%)
Most Common Occupations - Production occupations (%)
Most Common Occupations - Transportation occupations (%)
Most Common Occupations - Material moving occupations (%)
People in Group quarters - Institutionalized population (%)
People in Group quarters - Correctional institutions (%)
People in Group quarters - Federal prisons and detention centers (%)
People in Group quarters - Halfway houses (%)
People in Group quarters - Local jails and other confinement facilities (including police lockups) (%)
People in Group quarters - Military disciplinary barracks (%)
People in Group quarters - State prisons (%)
People in Group quarters - Other types of correctional institutions (%)
People in Group quarters - Nursing homes (%)
People in Group quarters - Hospitals/wards, hospices, and schools for the handicapped (%)
People in Group quarters - Hospitals/wards and hospices for chronically ill (%)
People in Group quarters - Hospices or homes for chronically ill (%)
People in Group quarters - Military hospitals or wards for chronically ill (%)
People in Group quarters - Other hospitals or wards for chronically ill (%)
People in Group quarters - Hospitals or wards for drug/alcohol abuse (%)
People in Group quarters - Mental (Psychiatric) hospitals or wards (%)
People in Group quarters - Schools, hospitals, or wards for the mentally retarded (%)
People in Group quarters - Schools, hospitals, or wards for the physically handicapped (%)
People in Group quarters - Institutions for the deaf (%)
People in Group quarters - Institutions for the blind (%)
People in Group quarters - Orthopedic wards and institutions for the physically handicapped (%)
People in Group quarters - Wards in general hospitals for patients who have no usual home elsewhere (%)
People in Group quarters - Wards in military hospitals for patients who have no usual home elsewhere (%)
People in Group quarters - Juvenile institutions (%)
People in Group quarters - Long-term care (%)
People in Group quarters - Homes for abused, dependent, and neglected children (%)
People in Group quarters - Residential treatment centers for emotionally disturbed children (%)
People in Group quarters - Training schools for juvenile delinquents (%)
People in Group quarters - Short-term care, detention or diagnostic centers for delinquent children (%)
People in Group quarters - Type of juvenile institution unknown (%)
People in Group quarters - Noninstitutionalized population (%)
People in Group quarters - College dormitories (includes college quarters off campus) (%)
People in Group quarters - Military quarters (%)
People in Group quarters - On base (%)
People in Group quarters - Barracks, unaccompanied personnel housing (UPH), (Enlisted/Officer), ;and similar group living quarters for military personnel (%)
People in Group quarters - Transient quarters for temporary residents (%)
People in Group quarters - Military ships (%)
People in Group quarters - Group homes (%)
People in Group quarters - Homes or halfway houses for drug/alcohol abuse (%)
People in Group quarters - Homes for the mentally ill (%)
People in Group quarters - Homes for the mentally retarded (%)
People in Group quarters - Homes for the physically handicapped (%)
People in Group quarters - Other group homes (%)
People in Group quarters - Religious group quarters (%)
People in Group quarters - Dormitories (%)
People in Group quarters - Agriculture workers' dormitories on farms (%)
People in Group quarters - Job Corps and vocational training facilities (%)
People in Group quarters - Other workers' dormitories (%)
People in Group quarters - Crews of maritime vessels (%)
People in Group quarters - Other nonhousehold living situations (%)
People in Group quarters - Other noninstitutional group quarters (%)
Residents speaking English at home (%)
Residents speaking English at home - Born in the United States (%)
Residents speaking English at home - Native, born elsewhere (%)
Residents speaking English at home - Foreign born (%)
Residents speaking Spanish at home (%)
Residents speaking Spanish at home - Born in the United States (%)
Residents speaking Spanish at home - Native, born elsewhere (%)
Residents speaking Spanish at home - Foreign born (%)
Residents speaking other language at home (%)
Residents speaking other language at home - Born in the United States (%)
Residents speaking other language at home - Native, born elsewhere (%)
Residents speaking other language at home - Foreign born (%)
Class of Workers - Employee of private company (%)
Class of Workers - Self-employed in own incorporated business (%)
Class of Workers - Private not-for-profit wage and salary workers (%)
Class of Workers - Local government workers (%)
Class of Workers - State government workers (%)
Class of Workers - Federal government workers (%)
Class of Workers - Self-employed workers in own not incorporated business and Unpaid family workers (%)
House heating fuel used in houses and condos - Utility gas (%)
House heating fuel used in houses and condos - Bottled, tank, or LP gas (%)
House heating fuel used in houses and condos - Electricity (%)
House heating fuel used in houses and condos - Fuel oil, kerosene, etc. (%)
House heating fuel used in houses and condos - Coal or coke (%)
House heating fuel used in houses and condos - Wood (%)
House heating fuel used in houses and condos - Solar energy (%)
House heating fuel used in houses and condos - Other fuel (%)
House heating fuel used in houses and condos - No fuel used (%)
House heating fuel used in apartments - Utility gas (%)
House heating fuel used in apartments - Bottled, tank, or LP gas (%)
House heating fuel used in apartments - Electricity (%)
House heating fuel used in apartments - Fuel oil, kerosene, etc. (%)
House heating fuel used in apartments - Coal or coke (%)
House heating fuel used in apartments - Wood (%)
House heating fuel used in apartments - Solar energy (%)
House heating fuel used in apartments - Other fuel (%)
House heating fuel used in apartments - No fuel used (%)
Armed forces status - In Armed Forces (%)
Armed forces status - Civilian (%)
Armed forces status - Civilian - Veteran (%)
Armed forces status - Civilian - Nonveteran (%)
Fatal accidents locations in years 2005-2021
Fatal accidents locations in 2005
Fatal accidents locations in 2006
Fatal accidents locations in 2007
Fatal accidents locations in 2008
Fatal accidents locations in 2009
Fatal accidents locations in 2010
Fatal accidents locations in 2011
Fatal accidents locations in 2012
Fatal accidents locations in 2013
Fatal accidents locations in 2014
Fatal accidents locations in 2015
Fatal accidents locations in 2016
Fatal accidents locations in 2017
Fatal accidents locations in 2018
Fatal accidents locations in 2019
Fatal accidents locations in 2020
Fatal accidents locations in 2021
Alcohol use - People drinking some alcohol every month (%)
Alcohol use - People not drinking at all (%)
Alcohol use - Average days/month drinking alcohol
Alcohol use - Average drinks/week
Alcohol use - Average days/year people drink much
Audiometry - Average condition of hearing (%)
Audiometry - People that can hear a whisper from across a quiet room (%)
Audiometry - People that can hear normal voice from across a quiet room (%)
Audiometry - Ears ringing, roaring, buzzing (%)
Audiometry - Had a job exposure to loud noise (%)
Audiometry - Had off-work exposure to loud noise (%)
Blood Pressure & Cholesterol - Has high blood pressure (%)
Blood Pressure & Cholesterol - Checking blood pressure at home (%)
Blood Pressure & Cholesterol - Frequently checking blood cholesterol (%)
Blood Pressure & Cholesterol - Has high cholesterol level (%)
Consumer Behavior - Money monthly spent on food at supermarket/grocery store
Consumer Behavior - Money monthly spent on food at other stores
Consumer Behavior - Money monthly spent on eating out
Consumer Behavior - Money monthly spent on carryout/delivered foods
Consumer Behavior - Income spent on food at supermarket/grocery store (%)
Consumer Behavior - Income spent on food at other stores (%)
Consumer Behavior - Income spent on eating out (%)
Consumer Behavior - Income spent on carryout/delivered foods (%)
Current Health Status - General health condition (%)
Current Health Status - Blood donors (%)
Current Health Status - Has blood ever tested for HIV virus (%)
Current Health Status - Left-handed people (%)
Dermatology - People using sunscreen (%)
Diabetes - Diabetics (%)
Diabetes - Had a blood test for high blood sugar (%)
Diabetes - People taking insulin (%)
Diet Behavior & Nutrition - Diet health (%)
Diet Behavior & Nutrition - Milk product consumption (# of products/month)
Diet Behavior & Nutrition - Meals not home prepared (#/week)
Diet Behavior & Nutrition - Meals from fast food or pizza place (#/week)
Diet Behavior & Nutrition - Ready-to-eat foods (#/month)
Diet Behavior & Nutrition - Frozen meals/pizza (#/month)
Drug Use - People that ever used marijuana or hashish (%)
Drug Use - Ever used hard drugs (%)
Drug Use - Ever used any form of cocaine (%)
Drug Use - Ever used heroin (%)
Drug Use - Ever used methamphetamine (%)
Health Insurance - People covered by health insurance (%)
Kidney Conditions-Urology - Avg. # of times urinating at night
Medical Conditions - People with asthma (%)
Medical Conditions - People with anemia (%)
Medical Conditions - People with psoriasis (%)
Medical Conditions - People with overweight (%)
Medical Conditions - Elderly people having difficulties in thinking or remembering (%)
Medical Conditions - People who ever received blood transfusion (%)
Medical Conditions - People having trouble seeing even with glass/contacts (%)
Medical Conditions - People with arthritis (%)
Medical Conditions - People with gout (%)
Medical Conditions - People with congestive heart failure (%)
Medical Conditions - People with coronary heart disease (%)
Medical Conditions - People with angina pectoris (%)
Medical Conditions - People who ever had heart attack (%)
Medical Conditions - People who ever had stroke (%)
Medical Conditions - People with emphysema (%)
Medical Conditions - People with thyroid problem (%)
Medical Conditions - People with chronic bronchitis (%)
Medical Conditions - People with any liver condition (%)
Medical Conditions - People who ever had cancer or malignancy (%)
Mental Health - People who have little interest in doing things (%)
Mental Health - People feeling down, depressed, or hopeless (%)
Mental Health - People who have trouble sleeping or sleeping too much (%)
Mental Health - People feeling tired or having little energy (%)
Mental Health - People with poor appetite or overeating (%)
Mental Health - People feeling bad about themself (%)
Mental Health - People who have trouble concentrating on things (%)
Mental Health - People moving or speaking slowly or too fast (%)
Mental Health - People having thoughts they would be better off dead (%)
Oral Health - Average years since last visit a dentist
Oral Health - People embarrassed because of mouth (%)
Oral Health - People with gum disease (%)
Oral Health - General health of teeth and gums (%)
Oral Health - Average days a week using dental floss/device
Oral Health - Average days a week using mouthwash for dental problem
Oral Health - Average number of teeth
Pesticide Use - Households using pesticides to control insects (%)
Pesticide Use - Households using pesticides to kill weeds (%)
Physical Activity - People doing vigorous-intensity work activities (%)
Physical Activity - People doing moderate-intensity work activities (%)
Physical Activity - People walking or bicycling (%)
Physical Activity - People doing vigorous-intensity recreational activities (%)
Physical Activity - People doing moderate-intensity recreational activities (%)
Physical Activity - Average hours a day doing sedentary activities
Physical Activity - Average hours a day watching TV or videos
Physical Activity - Average hours a day using computer
Physical Functioning - People having limitations keeping them from working (%)
Physical Functioning - People limited in amount of work they can do (%)
Physical Functioning - People that need special equipment to walk (%)
Physical Functioning - People experiencing confusion/memory problems (%)
Physical Functioning - People requiring special healthcare equipment (%)
Prescription Medications - Average number of prescription medicines taking
Preventive Aspirin Use - Adults 40+ taking low-dose aspirin (%)
Reproductive Health - Vaginal deliveries (%)
Reproductive Health - Cesarean deliveries (%)
Reproductive Health - Deliveries resulted in a live birth (%)
Reproductive Health - Pregnancies resulted in a delivery (%)
Reproductive Health - Women breastfeeding newborns (%)
Reproductive Health - Women that had a hysterectomy (%)
Reproductive Health - Women that had both ovaries removed (%)
Reproductive Health - Women that have ever taken birth control pills (%)
Reproductive Health - Women taking birth control pills (%)
Reproductive Health - Women that have ever used Depo-Provera or injectables (%)
Reproductive Health - Women that have ever used female hormones (%)
Sexual Behavior - People 18+ that ever had sex (vaginal, anal, or oral) (%)
Sexual Behavior - Males 18+ that ever had vaginal sex with a woman (%)
Sexual Behavior - Males 18+ that ever performed oral sex on a woman (%)
Sexual Behavior - Males 18+ that ever had anal sex with a woman (%)
Sexual Behavior - Males 18+ that ever had any sex with a man (%)
Sexual Behavior - Females 18+ that ever had vaginal sex with a man (%)
Sexual Behavior - Females 18+ that ever performed oral sex on a man (%)
Sexual Behavior - Females 18+ that ever had anal sex with a man (%)
Sexual Behavior - Females 18+ that ever had any kind of sex with a woman (%)
Sexual Behavior - Average age people first had sex
Sexual Behavior - Average number of female sex partners in lifetime (males 18+)
Sexual Behavior - Average number of female vaginal sex partners in lifetime (males 18+)
Sexual Behavior - Average age people first performed oral sex on a woman (18+)
Sexual Behavior - Average number of woman performed oral sex on in lifetime (18+)
Sexual Behavior - Average number of male sex partners in lifetime (males 18+)
Sexual Behavior - Average number of male anal sex partners in lifetime (males 18+)
Sexual Behavior - Average age people first performed oral sex on a man (18+)
Sexual Behavior - Average number of male oral sex partners in lifetime (18+)
Sexual Behavior - People using protection when performing oral sex (%)
Sexual Behavior - Average number of times people have vaginal or anal sex a year
Sexual Behavior - People having sex without condom (%)
Sexual Behavior - Average number of male sex partners in lifetime (females 18+)
Sexual Behavior - Average number of male vaginal sex partners in lifetime (females 18+)
Sexual Behavior - Average number of female sex partners in lifetime (females 18+)
Sexual Behavior - Circumcised males 18+ (%)
Sleep Disorders - Average hours sleeping at night
Sleep Disorders - People that has trouble sleeping (%)
Smoking-Cigarette Use - People smoking cigarettes (%)
Taste & Smell - People 40+ having problems with smell (%)
Taste & Smell - People 40+ having problems with taste (%)
Taste & Smell - People 40+ that ever had wisdom teeth removed (%)
Taste & Smell - People 40+ that ever had tonsils teeth removed (%)
Taste & Smell - People 40+ that ever had a loss of consciousness because of a head injury (%)
Taste & Smell - People 40+ that ever had a broken nose or other serious injury to face or skull (%)
Taste & Smell - People 40+ that ever had two or more sinus infections (%)
Weight - Average height (inches)
Weight - Average weight (pounds)
Weight - Average BMI
Weight - People that are obese (%)
Weight - People that ever were obese (%)
Weight - People trying to lose weight (%)
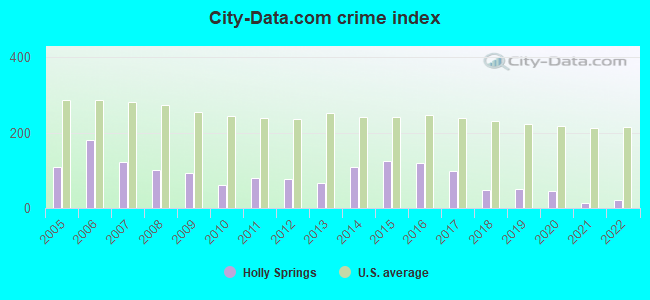
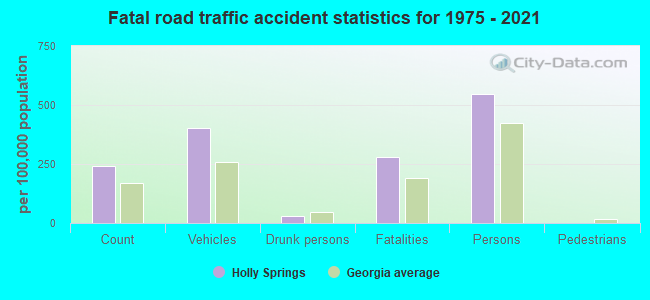
Officers per 1,000 residents here:
2.06Georgia average:
2.45
Latest news from Holly Springs, GA collected exclusively by city-data.com from local newspapers, TV, and radio stations
Ancestries: English (21.6%), American (8.1%), European (7.4%), German (6.3%), Irish (5.9%), Welsh (3.1%).
Current Local Time:
Land area: 3.17 square miles.
Population density: 5,915 people per square mile (average).
1,382 residents are foreign born (3.1% Latin America , 1.9% Asia , 1.6% Europe , 1.0% Africa ).
This city:
7.9%Georgia:
10.4%
Median real estate property taxes paid for housing units with mortgages in 2022: $3,666 (0.8%)Median real estate property taxes paid for housing units with no mortgage in 2022: $1,998 (0.6%)
Nearest city with pop. 50,000+: Northeast Cobb, GA
Nearest city with pop. 200,000+: Atlanta, GA
Nearest city with pop. 1,000,000+: Chicago, IL
Nearest cities:
Latitude: 34.17 N, Longitude: 84.50 W
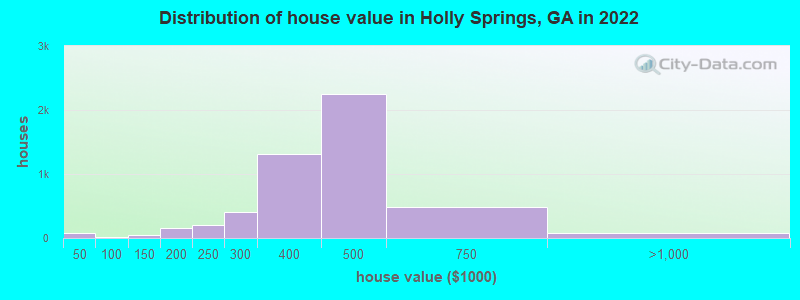
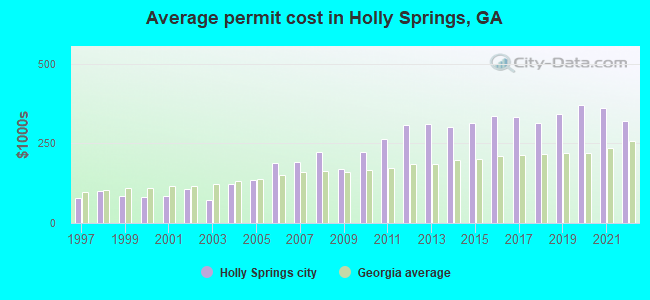
Property values in Holly Springs, GA
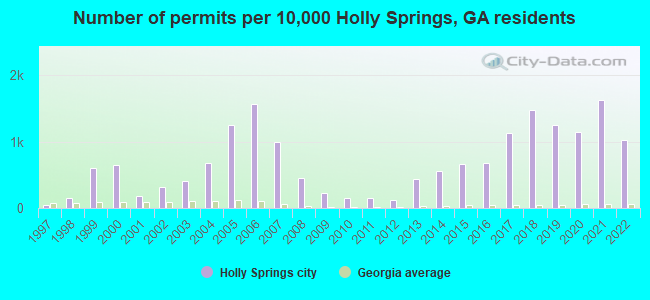
Single-family new house construction building permits:
2022: 328 buildings , average cost: $321,0002021: 521 buildings , average cost: $360,9002020: 368 buildings , average cost: $370,4002019: 398 buildings , average cost: $341,0002018: 471 buildings , average cost: $312,7002017: 364 buildings , average cost: $332,7002016: 216 buildings , average cost: $336,7002015: 213 buildings , average cost: $315,3002014: 179 buildings , average cost: $300,7002013: 141 buildings , average cost: $310,4002012: 38 buildings , average cost: $307,4002011: 50 buildings , average cost: $263,3002010: 50 buildings , average cost: $223,5002009: 70 buildings , average cost: $167,9002008: 143 buildings , average cost: $222,3002007: 317 buildings , average cost: $190,8002006: 500 buildings , average cost: $188,8002005: 401 buildings , average cost: $135,5002004: 215 buildings , average cost: $121,9002003: 132 buildings , average cost: $71,7002002: 102 buildings , average cost: $108,4002001: 57 buildings , average cost: $83,5002000: 208 buildings , average cost: $80,2001999: 194 buildings , average cost: $84,5001998: 46 buildings , average cost: $98,6001997: 12 buildings , average cost: $78,400Unemployment in December 2023:
Most common occupations in Holly Springs, GA (%)
Both Males Females
Other sales and related occupations, including supervisors (7.7%)
Computer specialists (6.2%)
Other office and administrative support workers, including supervisors (3.9%)
Electrical equipment mechanics and other installation, maintenance, and repair workers, including supervisors (3.8%)
Building and grounds cleaning and maintenance occupations (3.5%)
Driver/sales workers and truck drivers (3.2%)
Sales representatives, services, wholesale and manufacturing (3.1%)
Other sales and related occupations, including supervisors (8.4%)
Computer specialists (7.5%)
Electrical equipment mechanics and other installation, maintenance, and repair workers, including supervisors (5.6%)
Driver/sales workers and truck drivers (5.5%)
Vehicle and mobile equipment mechanics, installers, and repairers (5.0%)
Building and grounds cleaning and maintenance occupations (4.8%)
Law enforcement workers, including supervisors (4.5%)
Other office and administrative support workers, including supervisors (7.5%)
Secretaries and administrative assistants (6.7%)
Other sales and related occupations, including supervisors (6.7%)
Cashiers (6.5%)
Personal appearance workers (5.3%)
Customer service representatives (5.0%)
Computer specialists (4.5%)
Air pollution and air quality trends(lower is better)
AQI SO2 Ozone
Tornado activity:
Holly Springs-area historical tornado activity is slightly above Georgia state average. It is 65% greater than the overall U.S. average.
On 11/22/1992, a category F4 (max. wind speeds 207-260 mph) tornado 4.1 miles away from the Holly Springs city center injured 46 people and caused between $5,000,000 and $50,000,000 in damages.
On 4/3/1974, a category F4 tornado 17.1 miles away from the city center killed 6 people and injured 30 people and caused between $500,000 and $5,000,000 in damages.
Earthquake activity:
Holly Springs-area historical earthquake activity is significantly above Georgia state average. It is 67% greater than the overall U.S. average. On 4/29/2003 at 08:59:39, a magnitude 4.9 (4.4 MB, 4.6 MW, 4.9 LG, Class: Light, Intensity: IV - V) earthquake occurred 68.3 miles away from Holly Springs center On 8/2/1974 at 08:52:09, a magnitude 4.9 (4.3 MB, 4.9 LG) earthquake occurred 117.2 miles away from the city center On 4/29/2003 at 08:59:39, a magnitude 4.6 (4.6 MW, Depth: 12.3 mi) earthquake occurred 68.3 miles away from Holly Springs center On 11/30/1973 at 07:48:41, a magnitude 4.7 (4.7 MB, 4.6 ML) earthquake occurred 117.0 miles away from the city center On 1/18/1999 at 07:00:53, a magnitude 4.8 (4.8 MB, 4.0 LG, Depth: 0.6 mi) earthquake occurred 166.8 miles away from Holly Springs center On 12/12/2018 at 09:14:43, a magnitude 4.4 (4.4 MW, Depth: 4.9 mi) earthquake occurred 100.9 miles away from the city center Magnitude types: regional Lg-wave magnitude (LG), body-wave magnitude (MB), local magnitude (ML), moment magnitude (MW) Natural disasters: The number of natural disasters in Cherokee County (13) is near the US average (15).Major Disasters (Presidential) Declared: 8Emergencies Declared: 4Floods: 4, Storms: 4, Tornadoes: 4, Hurricanes: 3, Winter Storms: 3, Winds: 2, Drought: 1, Heavy Rain: 1, Snowfall: 1, Other: 1 (Note: some incidents may be assigned to more than one category). Hospitals and medical centers near Holly Springs: BODDY NURSING CENTER (Nursing Home, about 5 miles away; WOODSTOCK, GA)
WOODSTOCK NURSING AND REHAB CTR (Nursing Home, about 5 miles away; WOODSTOCK, GA)
BRIAN CENTER (Nursing Home, about 5 miles away; CANTON, GA)
NORTHSIDE HOSPITAL CHEROKEE (about 6 miles away; CANTON, GA)
NORTHWEST GEORGIA RENAL CENTER (Dialysis Facility, about 6 miles away; CANTON, GA)
CANTON NURSING CENTER (Nursing Home, about 6 miles away; CANTON, GA)
FMC NORTHERN GEORGIA INC (Dialysis Facility, about 6 miles away; CANTON, GA)
Colleges/universities with over 2000 students nearest to Holly Springs:
Kennesaw State University (about 11 miles; Kennesaw, GA ; Full-time enrollment: 21,215)
Southern Polytechnic State University (about 16 miles; Marietta, GA ; FT enrollment: 5,258)
Chattahoochee Technical College (about 17 miles; Marietta, GA ; FT enrollment: 8,173)
The Art Institute of Atlanta (about 18 miles; Atlanta, GA ; FT enrollment: 3,140)
Strayer University-Georgia (about 24 miles; Atlanta, GA ; FT enrollment: 4,447)
Emory University (about 28 miles; Atlanta, GA ; FT enrollment: 14,382)
Georgia Institute of Technology-Main Campus (about 28 miles; Atlanta, GA ; FT enrollment: 24,183)
Cherokee County has a predicted average indoor radon screening level between 2 and 4 pCi/L (pico curies per liter) - Moderate Potential Average household size: This city:
2.8 peopleGeorgia:
2.6 people
Percentage of family households: This city:
75.1%Whole state:
68.5%
Percentage of households with unmarried partners: This city:
5.9%Whole state:
5.9%
Likely homosexual households (counted as self-reported same-sex unmarried-partner households)
Lesbian couples: 0.6% of all households Gay men: 0.3% of all households
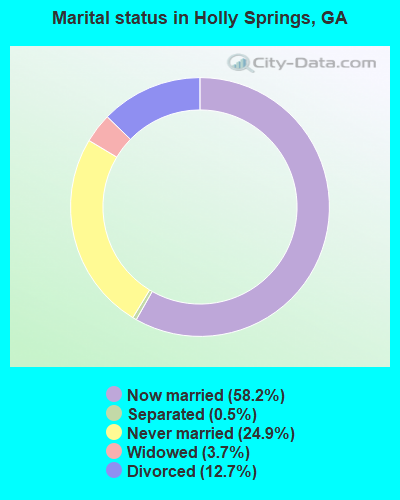
For population 15 years and over in Holly Springs:
Never married: 24.9%Now married: 58.2%Separated: 0.5%Widowed: 3.7%Divorced: 12.7% For population 25 years and over in Holly Springs:
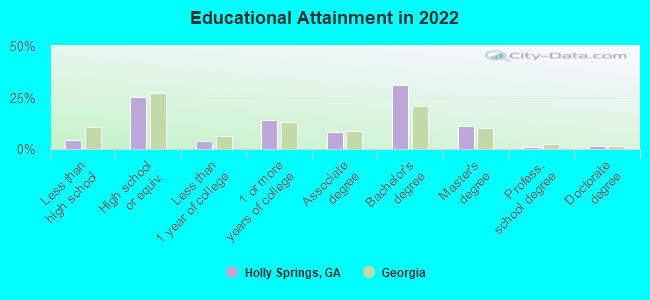
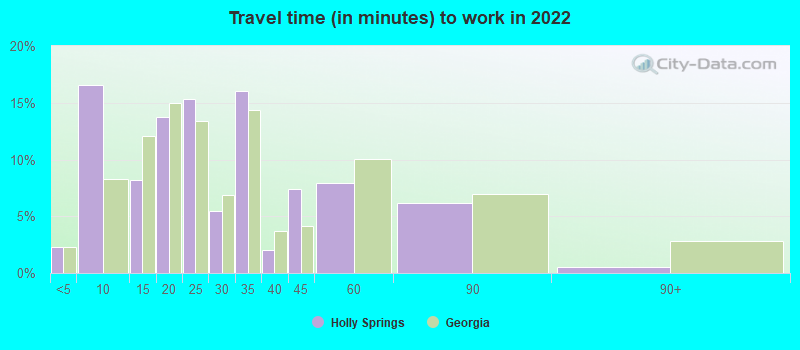
High school or higher: 95.5%Bachelor's degree or higher: 42.6%Graduate or professional degree: 11.3%Unemployed: 0.9%Mean travel time to work (commute): 24.9 minutes
Education Gini index (Inequality in education) Here:
9.4Georgia average:
12.2
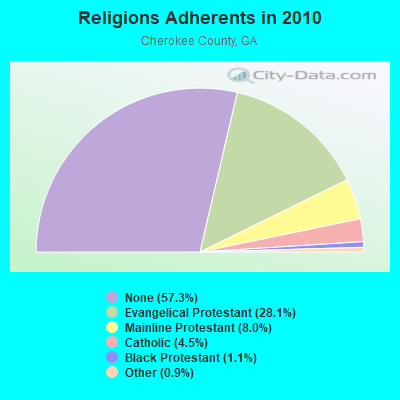
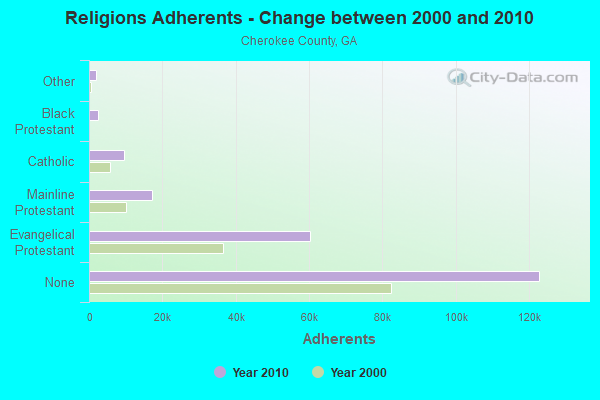
Religion statistics for Holly Springs, GA (based on Cherokee County data)
Religion Adherents Congregations Evangelical Protestant 60,308 110 Mainline Protestant 17,177 28 Catholic 9,617 2 Black Protestant 2,427 5 Other 1,861 8 Orthodox 60 1 None 122,896 -
Source: Clifford Grammich, Kirk Hadaway, Richard Houseal, Dale E.Jones, Alexei Krindatch, Richie Stanley and Richard H.Taylor. 2012. 2010 U.S.Religion Census: Religious Congregations & Membership Study. Association of Statisticians of American Religious Bodies. Jones, Dale E., et al. 2002. Congregations and Membership in the United States 2000. Nashville, TN: Glenmary Research Center. Graphs represent county-level data
Food Environment Statistics: Number of grocery stores : 30Cherokee County :
1.47 / 10,000 pop.Georgia :
1.91 / 10,000 pop.
Number of supercenters and club stores : 4Cherokee County :
0.20 / 10,000 pop.State :
0.15 / 10,000 pop.
Number of convenience stores (no gas) : 9Here :
0.44 / 10,000 pop.State :
0.86 / 10,000 pop.
Number of convenience stores (with gas) : 62Cherokee County :
3.04 / 10,000 pop.State :
5.12 / 10,000 pop.
Number of full-service restaurants : 144Cherokee County :
7.07 / 10,000 pop.State :
7.41 / 10,000 pop.
Adult diabetes rate : Cherokee County :
7.5%Georgia :
10.4%
Low-income preschool obesity rate : This county :
16.8%Georgia :
14.6%
Health and Nutrition: Healthy diet rate : Holly Springs:
46.8%Georgia:
48.9%
Average overall health of teeth and gums : This city:
42.6%State:
46.5%
Average BMI : Holly Springs:
29.0Georgia:
28.9
People feeling badly about themselves : People not drinking alcohol at all : Holly Springs:
10.0%State:
10.8%
Average hours sleeping at night : General health condition : Holly Springs:
55.7%State:
56.2%
Average condition of hearing : This city:
80.0%State:
80.8%
More about Health and Nutrition of Holly Springs, GA Residents
Local government employment and payroll (March 2022)
Function
Full-time employees
Monthly full-time payroll
Average yearly full-time wage
Part-time employees
Monthly part-time payroll
Police Protection - Officers
30 $138,809 $55,524 0 $0 Other Government Administration
6 $40,301 $80,602 0 $0 Housing and Community Development (Local)
5 $19,635 $47,124 0 $0 Police - Other
5 $29,167 $70,001 1 $2,173 Financial Administration
3 $16,055 $64,220 0 $0 Judicial and Legal
3 $11,860 $47,440 1 $659 Sewerage
2 $8,563 $51,378 0 $0 Other and Unallocable
1 $3,813 $45,756 4 $1,026 Correction
1 $4,471 $53,652 0 $0
Totals for Government
56 $272,674 $58,430 6 $3,857
Holly Springs government finances - Expenditure in 2017 (per resident):
Construction - Regular Highways: $3,898,000 ($208.02)
Parks and Recreation: $3,374,000 ($180.05)Financial Administration: $322,000 ($17.18)Current Operations - Police Protection: $2,129,000 ($113.61)
Local Fire Protection: $1,265,000 ($67.51)Financial Administration: $738,000 ($39.38)General - Other: $618,000 ($32.98)Protective Inspection and Regulation - Other: $460,000 ($24.55)Regular Highways: $443,000 ($23.64)Judicial and Legal Services: $256,000 ($13.66)Parks and Recreation: $251,000 ($13.39)Central Staff Services: $70,000 ($3.74)Libraries: $4,000 ($0.21)General - Interest on Debt: $28,000 ($1.49)
Intergovernmental to Local - Other - Local Fire Protection: $1,265,000 ($67.51)
Other - General - Other: $11,000 ($0.59)Other Capital Outlay - Police Protection: $233,000 ($12.43)
Local Fire Protection: $85,000 ($4.54)Financial Administration: $50,000 ($2.67)Judicial and Legal Services: $5,000 ($0.27)
Holly Springs government finances - Revenue in 2017 (per resident):
Charges - Sewerage: $363,000 ($19.37)
Other: $109,000 ($5.82)Federal Intergovernmental - Housing and Community Development: $215,000 ($11.47)
Local Intergovernmental - Other: $1,322,000 ($70.55)
Miscellaneous - Fines and Forfeits: $335,000 ($17.88)
Special Assessments: $87,000 ($4.64)Rents: $83,000 ($4.43)General Revenue - Other: $37,000 ($1.97)Sale of Property: $35,000 ($1.87)Donations From Private Sources: $18,000 ($0.96)Interest Earnings: $16,000 ($0.85)State Intergovernmental - Other: $2,030,000 ($108.33)
Public Welfare: $225,000 ($12.01)General Local Government Support: $19,000 ($1.01)Tax - Property: $3,563,000 ($190.14)
Other License: $783,000 ($41.78)Public Utilities Sales: $629,000 ($33.57)Insurance Premiums Sales: $575,000 ($30.68)Alcoholic Beverage Sales: $328,000 ($17.50)Occupation and Business License - Other: $111,000 ($5.92)Alcoholic Beverage License: $72,000 ($3.84)Other: $9,000 ($0.48)Other Selective Sales: $6,000 ($0.32)
Holly Springs government finances - Debt in 2017 (per resident):
Long Term Debt - Issue, Unspecified Public Purpose: $3,200,000 ($170.77)
Outstanding Unspecified Public Purpose: $3,048,000 ($162.66)Retired Unspecified Public Purpose: $152,000 ($8.11)
Holly Springs government finances - Cash and Securities in 2017 (per resident):
Other Funds - Cash and Securities: $9,499,000 ($506.91)
Businesses in Holly Springs, GA
Strongest AM radio stations in Holly Springs:
WFTD (1080 AM; daytime; 50 kW; MARIETTA, GA; Owner: PRIETO ENTERPRISES, INC.)
WCNN (680 AM; 50 kW; NORTH ATLANTA, GA; Owner: DICKEY BROADCASTING COMPANY)
WCHK (1290 AM; 5 kW; CANTON, GA; Owner: CHEROKEE BROADCASTING CO., INC.)
WGST (640 AM; 50 kW; ATLANTA, GA; Owner: CITICASTERS LICENSES, L.P.)
WSB (750 AM; 50 kW; ATLANTA, GA; Owner: CXR HOLDINGS, INC.)
WAZX (1550 AM; 50 kW; SMYRNA, GA; Owner: GA-MEX BROADCASTING, INC.)
WMLB (1160 AM; 50 kW; EAST POINT, GA; Owner: ATLANTA AREA BROADCASTING, INC.)
WQXI (790 AM; 28 kW; ATLANTA, GA; Owner: JEFFERSON-PILOT COMMUNICATIONS COMPANY OF GEORGIA)
WAOK (1380 AM; 50 kW; ATLANTA, GA; Owner: INFINITY BROADCASTING OPERATIONS, INC.)
WGUN (1010 AM; 50 kW; ATLANTA, GA; Owner: WGUN, INC.)
WGKA (1190 AM; 25 kW; ATLANTA, GA; Owner: SALEM MEDIA OF GEORGIA, INC.)
WAOS (1600 AM; 20 kW; AUSTELL, GA; Owner: LA FAVORITA, INC.)
WKNG (1060 AM; daytime; 50 kW; TALLAPOOSA, GA; Owner: WKNG, INC.)
Strongest FM radio stations in Holly Springs:
WLCL (105.7 FM; CANTON, GA; Owner: CHEROKEE BROADCASTING CO., INC.)
W265BD (100.9 FM; WOODSTOCK, GA; Owner: IMMANUEL BROADCASTING NETWORK, INC.)
W221AW (92.1 FM; NORTH CANTON, GA; Owner: IMMANUEL BROADCASTING NETWORK, INC.)
W214AS (90.7 FM; WALESKA, GA; Owner: CALVARY CHAPEL OF TWIN FALLS, INC.)
WCCV (91.7 FM; CARTERSVILLE, GA; Owner: IMMANUEL BROADCASTING NETWORK, INC.)
WWEV-FM (91.5 FM; CUMMING, GA; Owner: CURRICULUM DEVELOPMENT FOUNDATION)
WWWQ (100.5 FM; ANNISTON, AL; Owner: WNNX LICO, INC.)
WKHX-FM (101.5 FM; MARIETTA, GA; Owner: ABC, INC.)
WNNX (99.7 FM; ATLANTA, GA; Owner: WNNX LICO, INC.)
WFOX (97.1 FM; GAINESVILLE, GA; Owner: COX RADIO, INC.)
WKLS (96.1 FM; ATLANTA, GA; Owner: CITICASTERS LICENSES, L.P.)
WLTM (94.9 FM; ATLANTA, GA; Owner: CITICASTERS LICENSES, L.P.)
WYAY (106.7 FM; GAINESVILLE, GA; Owner: ABC, INC.)
WSB-FM (98.5 FM; ATLANTA, GA; Owner: CXR HOLDINGS, INC.)
WSTR (94.1 FM; SMYRNA, GA; Owner: JEFFERSON-PILOT COMMUNICATIONS COMPANY OF GEORGIA)
WVEE (103.3 FM; ATLANTA, GA; Owner: INFINITY BROADCASTING OPERATIONS, INC.)
WZGC (92.9 FM; ATLANTA, GA; Owner: INFINITY BROADCASTING CORP. OF ATLANTA)
W234AG (94.7 FM; CHATSWORTH, GA; Owner: IMMANUEL BROADCASTING NETWORK, INC.)
WRFG (89.3 FM; ATLANTA, GA; Owner: RADIO FREE GEORGIA BROADCASTING FOUNDATION INC)
WABE (90.1 FM; ATLANTA, GA; Owner: BOARD OF EDUCATION, CITY OF ATLANTA)
TV broadcast stations around Holly Springs:
WSKC-LP (Channel 59; ATLANTA, GA; Owner: KM LPTV OF ATLANTA, L.L.C.)
WPXA (Channel 14; ROME, GA; Owner: PAXSON ATLANTA LICENSE, INC.)
W38CU (Channel 38; ATLANTA, GA; Owner: KOREAN AMERICAN TV BROADCASTING CORP.)
WUVG (Channel 34; ATHENS, GA; Owner: UNIVISION ATLANTA LLC)
WAGA (Channel 5; ATLANTA, GA; Owner: FOX TELEVISION STATIONS, INC.)
WSB-TV (Channel 2; ATLANTA, GA; Owner: WSB-TV HOLDINGS, INC.)
WATL (Channel 36; ATLANTA, GA; Owner: WATL, LLC)
WTBS (Channel 17; ATLANTA, GA; Owner: SUPERSTATION, INC.)
WGCL-TV (Channel 46; ATLANTA, GA; Owner: MEREDITH CORPORATION)
WXIA-TV (Channel 11; ATLANTA, GA; Owner: GANNETT GEORGIA, L.P.)
W50AB (Channel 50; HIAWASSEE, GA; Owner: GEORGIA PUBLIC TELECOMMUNICATIONS COMMISSION)
WHSG (Channel 63; MONROE, GA; Owner: TRINITY BROADCASTING NETWORK)
WANN-LP (Channel 32; ATLANTA, GA; Owner: PRISM BROADCASTING NETWORK, INC.)
WDTA-LP (Channel 53; FAYETTEVILLE, GA; Owner: WORD OF GOD FELLOWSHIP, INC.)
WPBA (Channel 30; ATLANTA, GA; Owner: BOARD OF EDUCATION OF THE CITY OF ATLANTA)
WUPA (Channel 69; ATLANTA, GA; Owner: VIACOM STATIONS GROUP OF ATLANTA INC.)
WIRE-CA (Channel 40; ATLANTA, GA; Owner: COMMERCIAL BROADCASTING CORP.)
WTHC-LP (Channel 42; ATLANTA, GA; Owner: THE ATLANTA CHANNEL, INC.)
WANX-LP (Channel 26; ATLANTA, GA; Owner: PRISM BROADCASTING NETWORK, INC.)
W55BM (Channel 55; MARIETTA, GA; Owner: TRINITY BROADCASTING NETWORK)
W24AL (Channel 24; ATLANTA, GA; Owner: VENTANA TELEVISION, INC.)
WATC (Channel 57; ATLANTA, GA; Owner: COMMUNITY TELEVISION, INC.)
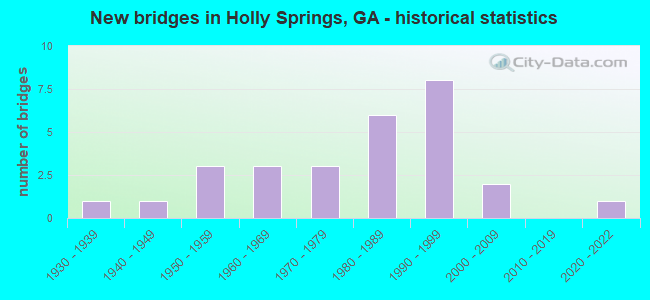
National Bridge Inventory (NBI) Statistics 32 Number of bridges308ft / 93.7m Total length $35,450,000 Total costs349,408 Total average daily traffic4,715 Total average daily truck traffic
New bridges - historical statistics
1 1930-1939 1 1940-1949 3 1950-1959 3 1960-1969 3 1970-1979 6 1980-1989 8 1990-1999 2 2000-2009 1 2020-2022
See full National Bridge Inventory statistics for Holly Springs, GA
FCC Registered Antenna Towers: 46 (
See the full list of FCC Registered Antenna Towers in Holly Springs )
FCC Registered Broadcast Land Mobile Towers: 1
Main St Water Tank (Lat: 34.173694 Lon: -84.500750), Type: Tank, Structure height: 15 m, Overall height: 17 m, Call Sign: KTO324, Assigned Frequencies: 154.740 MHz, 154.905 MHz, 154.935 MHz, 155.370 MHz, Grant Date: 12/01/2020, Expiration Date: 02/22/2031, Certifier: Robert J Chester, Registrant: Cherokee County, 150 Chattin Dr, Canton, GA 30114, Phone: (404) 317-3760, Fax: (678) 493-4199, Email:
FCC Registered Microwave Towers: 4
GA-ATL685B, 3019 Holly St (026129 / Holly Springs) (Lat: 34.175333 Lon: -84.503556), Type: Tower, Structure height: 76.2 m, Overall height: 81.7 m, Call Sign: WQKM493, Assigned Frequencies: 10775.0 MHz, 10975.0 MHz, 17965.0 MHz, 10855.0 MHz, 11055.0 MHz, 18065.0 MHz, Grant Date: 07/14/2009, Expiration Date: 07/14/2019, Cancellation Date: 05/02/2019, Certifier: Nadja S Sodos-Wallace, Registrant: Sprint Corporation, 12502 Sunrise Valley Drive, M/S: Varesa, Reston, VA 20196, Phone: (800) 572-8256, Fax: (703) 433-4483, Email:
Holly Springs, Lat: 34.175333 Lon: -84.503556, Type: Ltower, Structure height: 76.2 m, Overall height: 81.7 m, Call Sign: WQSG985, Assigned Frequencies: 3650.00 MHz, Grant Date: 09/19/2013, Expiration Date: 09/19/2023, Cancellation Date: 10/03/2023, Certifier: Jerold Kenyon, Registrant: Lucas, Lafuria, Lantor, & Sachs LLP, 8350 Broad Street, Suite 1450, Tysons, VA 22102, Phone: (703) 584-8663, Fax: (703) 584-8696, Email:
HOLLY SPRING, 3019 Holly St (026129 / Holly Springs) (Lat: 34.175333 Lon: -84.503556), Type: Ltower, Structure height: 76.2 m, Overall height: 81.7 m, Call Sign: WRCB866, Assigned Frequencies: 10735.0 MHz, 10815.0 MHz, 10735.0 MHz, 10815.0 MHz, 10735.0 MHz, 10815.0 MHz, 10735.0 MHz, 10815.0 MHz, 10735.0 MHz, 10815.0 MHz... (+6 more), Grant Date: 08/21/2018, Expiration Date: 08/21/2028, Certifier: Larry F Butts, Registrant: Southern Company Services, 600 N. 18th St / Bin 5n-5409, Birmingham, AL 35203, Phone: (205) 257-7600, Fax: (205) 257-2134, Email:
HOLLYSPRINGS, 1539 Marble Quarry Road (Lat: 34.173722 Lon: -84.509333), Type: Ltower, Structure height: 76.2 m, Overall height: 82.3 m, Call Sign: WRCY752, Assigned Frequencies: 10915.0 MHz, 11155.0 MHz, 10915.0 MHz, 11155.0 MHz, 10915.0 MHz, 11155.0 MHz, 10915.0 MHz, 11155.0 MHz, 10915.0 MHz, 11155.0 MHz... (+10 more), Grant Date: 02/28/2019, Expiration Date: 02/28/2029, Certifier: David Fowler, Registrant: Lucas, Lafuria, Lantor, & Sachs LLP, 8350 Broad Street, Suite 1450, Tysons, VA 22102, Phone: (703) 584-8663, Email:
FCC Registered Amateur Radio Licenses: 12 (
See the full list of FCC Registered Amateur Radio Licenses in Holly Springs )
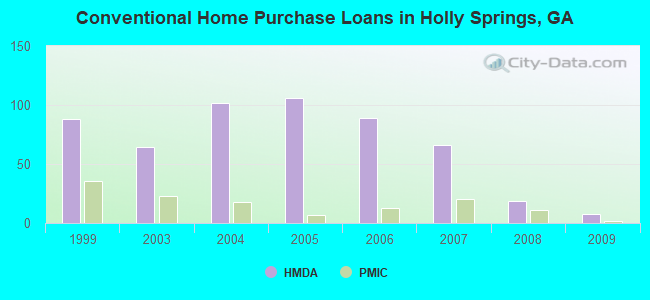
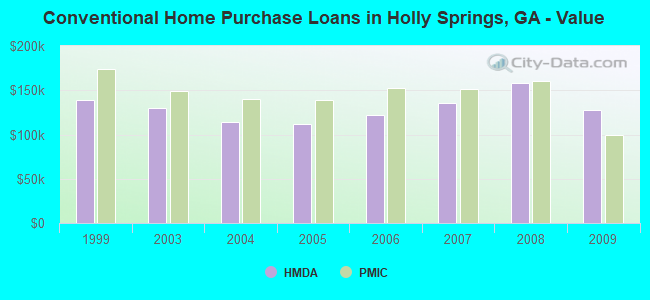
Home Mortgage Disclosure Act Aggregated Statistics For Year 2009(Based on 1 partial tract) A) FHA, FSA/RHS & VA B) Conventional C) Refinancings D) Home Improvement Loans F) Non-occupant Loans on Number Average Value Number Average Value Number Average Value Number Average Value Number Average Value
LOANS ORIGINATED 21 $127,750 8 $127,765 54 $151,582 3 $30,147 9 $198,704 APPLICATIONS APPROVED, NOT ACCEPTED 2 $117,020 1 $119,750 5 $147,678 0 $0 0 $0 APPLICATIONS DENIED 4 $113,542 2 $266,340 33 $149,718 2 $38,760 1 $100,370 APPLICATIONS WITHDRAWN 3 $123,893 1 $75,530 23 $147,795 0 $0 1 $101,860 FILES CLOSED FOR INCOMPLETENESS 0 $0 0 $0 6 $154,205 0 $0 0 $0
Aggregated Statistics For Year 2008(Based on 1 partial tract) A) FHA, FSA/RHS & VA B) Conventional C) Refinancings D) Home Improvement Loans F) Non-occupant Loans on G) Loans On Manufactured Number Average Value Number Average Value Number Average Value Number Average Value Number Average Value Number Average Value
LOANS ORIGINATED 15 $159,173 19 $158,171 57 $146,455 2 $15,900 8 $168,511 0 $0 APPLICATIONS APPROVED, NOT ACCEPTED 1 $197,770 3 $107,163 7 $138,849 1 $30,310 2 $82,980 0 $0 APPLICATIONS DENIED 3 $185,840 8 $154,660 32 $134,924 7 $101,154 2 $245,470 1 $47,210 APPLICATIONS WITHDRAWN 0 $0 5 $144,896 8 $131,989 1 $78,010 0 $0 0 $0 FILES CLOSED FOR INCOMPLETENESS 0 $0 0 $0 4 $129,940 0 $0 0 $0 0 $0
Aggregated Statistics For Year 2007(Based on 1 partial tract) A) FHA, FSA/RHS & VA B) Conventional C) Refinancings D) Home Improvement Loans F) Non-occupant Loans on G) Loans On Manufactured Number Average Value Number Average Value Number Average Value Number Average Value Number Average Value Number Average Value
LOANS ORIGINATED 9 $162,376 66 $135,413 76 $125,173 6 $62,692 15 $141,418 1 $40,750 APPLICATIONS APPROVED, NOT ACCEPTED 0 $0 5 $176,400 13 $110,045 3 $51,513 2 $136,645 0 $0 APPLICATIONS DENIED 1 $173,910 8 $160,809 39 $142,585 7 $53,381 2 $121,490 0 $0 APPLICATIONS WITHDRAWN 2 $167,950 7 $223,179 29 $146,500 2 $107,580 0 $0 0 $0 FILES CLOSED FOR INCOMPLETENESS 0 $0 0 $0 6 $187,083 1 $45,220 0 $0 0 $0
Aggregated Statistics For Year 2006(Based on 1 partial tract) A) FHA, FSA/RHS & VA B) Conventional C) Refinancings D) Home Improvement Loans F) Non-occupant Loans on G) Loans On Manufactured Number Average Value Number Average Value Number Average Value Number Average Value Number Average Value Number Average Value
LOANS ORIGINATED 8 $148,821 89 $122,198 86 $120,071 11 $33,699 13 $136,915 0 $0 APPLICATIONS APPROVED, NOT ACCEPTED 0 $0 7 $126,780 12 $121,947 2 $30,810 0 $0 0 $0 APPLICATIONS DENIED 0 $0 12 $130,395 68 $128,032 11 $44,721 3 $128,530 1 $82,490 APPLICATIONS WITHDRAWN 0 $0 8 $132,361 35 $133,311 2 $50,185 1 $133,170 0 $0 FILES CLOSED FOR INCOMPLETENESS 0 $0 3 $145,093 9 $131,237 0 $0 1 $88,950 0 $0
Aggregated Statistics For Year 2005(Based on 1 partial tract) A) FHA, FSA/RHS & VA B) Conventional C) Refinancings D) Home Improvement Loans F) Non-occupant Loans on G) Loans On Manufactured Number Average Value Number Average Value Number Average Value Number Average Value Number Average Value Number Average Value
LOANS ORIGINATED 8 $156,151 106 $111,418 100 $118,605 15 $36,439 17 $104,583 0 $0 APPLICATIONS APPROVED, NOT ACCEPTED 0 $0 7 $123,373 15 $130,552 4 $30,188 2 $131,680 0 $0 APPLICATIONS DENIED 1 $150,060 15 $111,339 65 $125,976 9 $40,083 3 $94,743 2 $90,935 APPLICATIONS WITHDRAWN 0 $0 5 $125,914 45 $121,586 4 $136,400 1 $268,330 0 $0 FILES CLOSED FOR INCOMPLETENESS 0 $0 2 $141,865 19 $135,497 1 $61,120 0 $0 0 $0
Aggregated Statistics For Year 2004(Based on 1 partial tract) A) FHA, FSA/RHS & VA B) Conventional C) Refinancings D) Home Improvement Loans F) Non-occupant Loans on G) Loans On Manufactured Number Average Value Number Average Value Number Average Value Number Average Value Number Average Value Number Average Value
LOANS ORIGINATED 24 $144,080 102 $113,566 105 $118,556 8 $66,646 20 $106,436 0 $0 APPLICATIONS APPROVED, NOT ACCEPTED 1 $226,590 7 $130,614 17 $115,748 1 $17,390 1 $95,400 1 $86,960 APPLICATIONS DENIED 2 $140,125 14 $134,163 58 $121,458 9 $44,721 2 $95,405 1 $57,140 APPLICATIONS WITHDRAWN 0 $0 8 $137,579 23 $118,975 2 $21,865 2 $82,980 0 $0 FILES CLOSED FOR INCOMPLETENESS 0 $0 4 $144,225 13 $141,540 0 $0 0 $0 0 $0
Aggregated Statistics For Year 2003(Based on 1 partial tract) A) FHA, FSA/RHS & VA B) Conventional C) Refinancings D) Home Improvement Loans F) Non-occupant Loans on Number Average Value Number Average Value Number Average Value Number Average Value Number Average Value
LOANS ORIGINATED 17 $149,070 64 $129,877 217 $115,153 7 $23,851 13 $98,883 APPLICATIONS APPROVED, NOT ACCEPTED 1 $162,980 4 $139,008 18 $97,668 0 $0 1 $109,320 APPLICATIONS DENIED 2 $175,905 15 $95,405 43 $112,149 5 $13,316 3 $93,750 APPLICATIONS WITHDRAWN 2 $169,940 9 $105,288 20 $122,014 1 $66,090 0 $0 FILES CLOSED FOR INCOMPLETENESS 0 $0 2 $147,580 6 $125,882 0 $0 0 $0
Aggregated Statistics For Year 1999(Based on 1 partial tract) A) FHA, FSA/RHS & VA B) Conventional C) Refinancings D) Home Improvement Loans F) Non-occupant Loans on Number Average Value Number Average Value Number Average Value Number Average Value Number Average Value
LOANS ORIGINATED 21 $130,575 88 $138,773 46 $94,400 7 $25,030 5 $93,626 APPLICATIONS APPROVED, NOT ACCEPTED 1 $104,480 6 $123,742 10 $78,099 4 $21,902 1 $79,170 APPLICATIONS DENIED 2 $105,915 12 $138,008 22 $75,974 9 $25,049 1 $124,220 APPLICATIONS WITHDRAWN 1 $105,050 7 $156,263 20 $96,320 2 $63,455 0 $0 FILES CLOSED FOR INCOMPLETENESS 0 $0 1 $96,810 4 $93,310 0 $0 0 $0
Detailed HMDA statistics for the following Tracts:
0907.02
Private Mortgage Insurance Companies Aggregated Statistics For Year 2009(Based on 1 partial tract) A) Conventional B) Refinancings Number Average Value Number Average Value
LOANS ORIGINATED 2 $99,380 2 $142,115 APPLICATIONS APPROVED, NOT ACCEPTED 0 $0 1 $199,750 APPLICATIONS DENIED 0 $0 0 $0 APPLICATIONS WITHDRAWN 0 $0 0 $0 FILES CLOSED FOR INCOMPLETENESS 0 $0 0 $0
Aggregated Statistics For Year 2008(Based on 1 partial tract) A) Conventional B) Refinancings Number Average Value Number Average Value
LOANS ORIGINATED 11 $160,860 7 $170,294 APPLICATIONS APPROVED, NOT ACCEPTED 4 $154,162 2 $188,325 APPLICATIONS DENIED 1 $131,680 0 $0 APPLICATIONS WITHDRAWN 0 $0 0 $0 FILES CLOSED FOR INCOMPLETENESS 0 $0 0 $0
Aggregated Statistics For Year 2007(Based on 1 partial tract) A) Conventional B) Refinancings C) Non-occupant Loans on Number Average Value Number Average Value Number Average Value
LOANS ORIGINATED 20 $150,983 7 $160,499 1 $144,100 APPLICATIONS APPROVED, NOT ACCEPTED 0 $0 2 $199,755 0 $0 APPLICATIONS DENIED 0 $0 0 $0 0 $0 APPLICATIONS WITHDRAWN 0 $0 0 $0 0 $0 FILES CLOSED FOR INCOMPLETENESS 0 $0 0 $0 0 $0
Aggregated Statistics For Year 2006(Based on 1 partial tract) A) Conventional B) Refinancings Number Average Value Number Average Value
LOANS ORIGINATED 13 $152,625 7 $161,280 APPLICATIONS APPROVED, NOT ACCEPTED 1 $153,050 2 $160,995 APPLICATIONS DENIED 0 $0 0 $0 APPLICATIONS WITHDRAWN 0 $0 0 $0 FILES CLOSED FOR INCOMPLETENESS 0 $0 0 $0
Aggregated Statistics For Year 2005(Based on 1 partial tract) A) Conventional B) Refinancings C) Non-occupant Loans on Number Average Value Number Average Value Number Average Value
LOANS ORIGINATED 7 $139,416 10 $140,175 0 $0 APPLICATIONS APPROVED, NOT ACCEPTED 2 $162,485 1 $195,280 1 $101,370 APPLICATIONS DENIED 0 $0 0 $0 0 $0 APPLICATIONS WITHDRAWN 0 $0 0 $0 0 $0 FILES CLOSED FOR INCOMPLETENESS 0 $0 0 $0 0 $0
Aggregated Statistics For Year 2004(Based on 1 partial tract) A) Conventional B) Refinancings Number Average Value Number Average Value
LOANS ORIGINATED 18 $140,126 12 $140,332 APPLICATIONS APPROVED, NOT ACCEPTED 3 $168,450 3 $139,133 APPLICATIONS DENIED 0 $0 0 $0 APPLICATIONS WITHDRAWN 0 $0 2 $172,175 FILES CLOSED FOR INCOMPLETENESS 0 $0 0 $0
Aggregated Statistics For Year 2003(Based on 1 partial tract) A) Conventional B) Refinancings Number Average Value Number Average Value
LOANS ORIGINATED 23 $149,632 31 $135,622 APPLICATIONS APPROVED, NOT ACCEPTED 4 $134,785 5 $154,636 APPLICATIONS DENIED 0 $0 0 $0 APPLICATIONS WITHDRAWN 2 $146,335 3 $153,047 FILES CLOSED FOR INCOMPLETENESS 0 $0 0 $0
Aggregated Statistics For Year 1999(Based on 1 partial tract) A) Conventional B) Refinancings C) Non-occupant Loans on Number Average Value Number Average Value Number Average Value
LOANS ORIGINATED 36 $173,946 6 $109,173 1 $82,620 APPLICATIONS APPROVED, NOT ACCEPTED 3 $168,183 1 $72,460 0 $0 APPLICATIONS DENIED 1 $307,870 0 $0 0 $0 APPLICATIONS WITHDRAWN 1 $205,310 0 $0 0 $0 FILES CLOSED FOR INCOMPLETENESS 0 $0 0 $0 0 $0
Detailed PMIC statistics for the following Tracts:
0907.02
Holly Springs compared to Georgia state average:
Median house value above state average. Unemployed percentage significantly below state average. Hispanic race population percentage significantly above state average. Median age below state average. Foreign-born population percentage significantly above state average. Renting percentage below state average. Length of stay since moving in significantly below state average. House age significantly below state average. Number of college students significantly above state average. Percentage of population with a bachelor's degree or higher above state average. Holly Springs on our top lists :
#70 on the list of "Top 101 cities with the most people taking a ferryboat to work (population 5,000+)"
#100 on the list of "Top 101 cities with largest percentage of females in occupations: education, training, and library occupations (population 5,000+)"
#16 on the list of "Top 101 counties with highest percentage of residents voting for Romney (Republican) in the 2012 Presidential Election (pop. 50,000+)"
#27 on the list of "Top 101 counties with the largest decrease in the number of births per 1000 residents 2000-2006 to 2007-2013 (pop 50,000+)"
#56 on the list of "Top 101 counties with the lowest number of deaths per 1000 residents 2007-2013 (pop. 50,000+)"
#58 on the list of "Top 101 counties with the largest number of children under 18 without health insurance coverage in 2000 (pop. 50,000+)"
#92 on the list of "Top 101 counties with the lowest ground withdrawal of fresh water for public supply (pop. 50,000+)"
Top Patent Applicants
Alex Berkobin (4)
Paul Panichelli (1)
Lesley Ann Pfitzenmayer (1)
John R. Prisco (1)
Christopher Adams (1)
Total of 8 patent applications in 2008-2024.


 Recent articles from our blog. Our writers, many of them Ph.D. graduates or candidates, create easy-to-read articles on a wide variety of topics.

 (11.1 miles
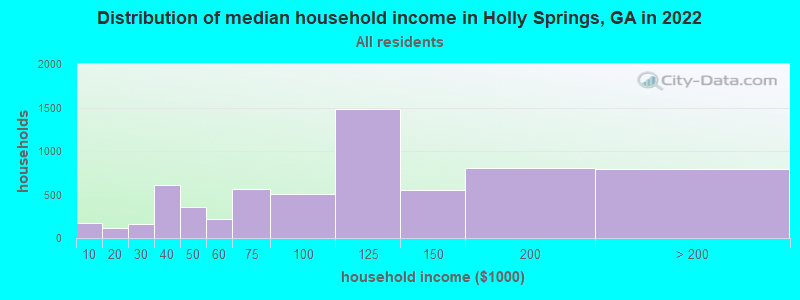
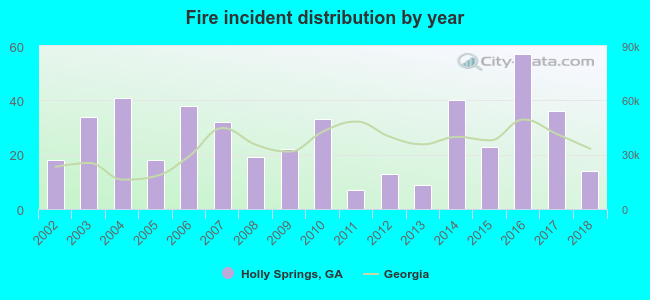 According to the data from the years 2002 - 2018 the average number of fire incidents per year is 27. The highest number of reported fires - 57 took place in 2016, and the least - 7 in 2011. The data has a dropping trend.
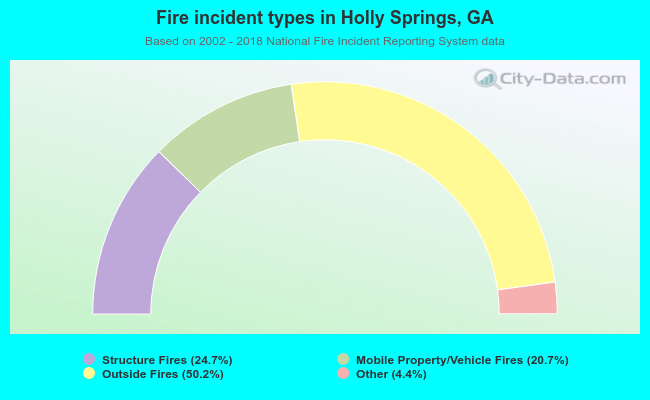 When looking into fire subcategories, the most incidents belonged to: Outside Fires (50.2%), and Structure Fires (24.7%).