Estimated zip code population in 2022: 65,907 Zip code population in 2010: 52,380 Zip code population in 2000: 36,613
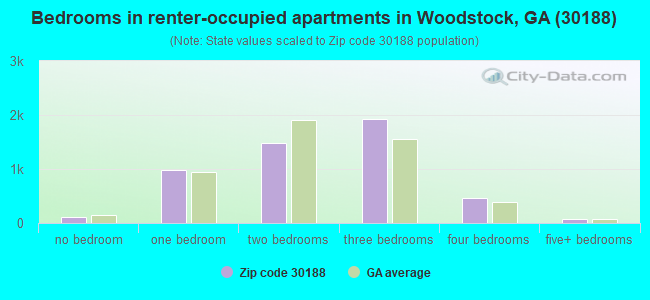
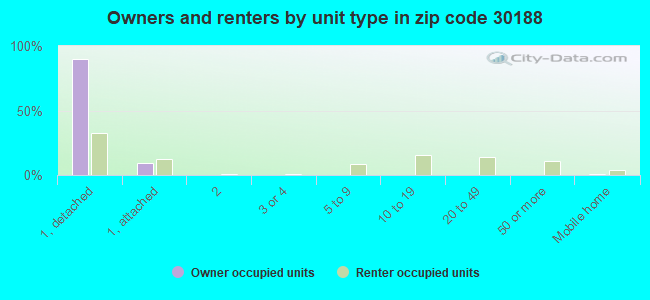
Houses and condos: 26,472 Renter-occupied apartments: 5,032
% of renters here:
20%
State:
34%
March 2022 cost of living index in zip code 30188: 102.8 (near average, U.S. average is 100)
Land area: 44.0 sq. mi. Water area: 0.5 sq. mi.
Population density: 1,499 people per square mile
(low).
OSM Map
General Map
Google Map
MSN Map
OSM Map
General Map
Google Map
MSN Map
OSM Map
General Map
Google Map
MSN Map
OSM Map
General Map
Google Map
MSN Map
Please wait while loading the map...
Real estate property taxes paid for housing units in 2022:
This zip code:
0.6% ($2,686)
Georgia:
0.7% ($2,160)
Median real estate property taxes paid for housing units with mortgages in 2022: $2,960 (0.7%) Median real estate property taxes paid for housing units with no mortgage in 2022: $1,814 (0.4%)
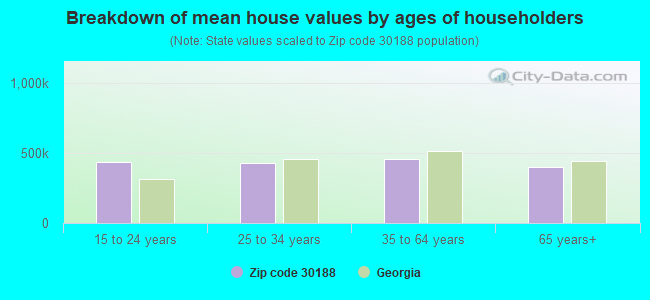
Estimated median house/condo value in 2022: $439,025
30188:
$439,025
Georgia:
$297,400
According to our research of Georgia and other state lists, there were 47 registered sex offenders living in 30188 zip code as of April 27, 2024. The ratio of all residents to sex offenders in zip code 30188 is 1,275 to 1. The ratio of registered sex offenders to all residents in this zip code is much lower than the state average.
Median resident age:
This zip code:
40.3 years
Georgia median age:
37.6 years
Average household size:
This zip code:
2.6 people
Georgia:
2.6 people
Averages for the 2020 tax year for zip code 30188, filed in 2021:
Average Adjusted Gross Income (AGI) in 2020: $87,018 (Individual Income Tax Returns)
Here:
$87,018
State:
$70,847
Salary/wage: $76,662 (reported on 80.3% of returns)
Here:
$76,662
State:
$59,126
(% of AGI for various income ranges: 1105.3% for AGIs below $25k, 3593.1% for AGIs $25k-50k, 6883.6% for AGIs $50k-75k, 10130.9% for AGIs $75k-100k, 20039.1% for AGIs $100k-200k, 74652.3% for AGIs over 200k)
Taxable interest for individuals: $1,525 (reported on 30.7% of returns)
This zip code:
$1,525
Georgia:
$2,011
(% of AGI for various income ranges: 16.4% for AGIs below $25k, 30.4% for AGIs $25k-50k, 45.8% for AGIs $50k-75k, 70.2% for AGIs $75k-100k, 104.2% for AGIs $100k-200k, 733.1% for AGIs over 200k)
Ordinary dividends: $5,088 (reported on 24.5% of returns)
Here:
$5,088
State:
$8,996
(% of AGI for various income ranges: 35.7% for AGIs below $25k, 61.2% for AGIs $25k-50k, 120.5% for AGIs $50k-75k, 161.5% for AGIs $75k-100k, 335.8% for AGIs $100k-200k, 1943.0% for AGIs over 200k)
Net capital gain/loss in AGI: +$16,807 (reported on 22.4% of returns)
Here:
+$16,807
State:
+$28,402
(% of AGI for various income ranges: 15.8% for AGIs below $25k, 41.2% for AGIs $25k-50k, 101.8% for AGIs $50k-75k, 223.9% for AGIs $75k-100k, 556.4% for AGIs $100k-200k, 10860.8% for AGIs over 200k)
Profit/loss from business: +$11,229 (reported on 22.3% of returns)
Here:
+$11,229
State:
+$6,707
(% of AGI for various income ranges: 202.6% for AGIs below $25k, 291.4% for AGIs $25k-50k, 260.0% for AGIs $50k-75k, 357.1% for AGIs $75k-100k, 595.3% for AGIs $100k-200k, 2184.1% for AGIs over 200k)
Taxable individual retirement arrangement distribution: $22,774 (reported on 10.5% of returns)
30188:
$22,774
Georgia:
$20,525
(% of AGI for various income ranges: 70.6% for AGIs below $25k, 147.3% for AGIs $25k-50k, 272.8% for AGIs $50k-75k, 499.4% for AGIs $75k-100k, 837.4% for AGIs $100k-200k, 2133.0% for AGIs over 200k)
Self-employed (Keogh) retirement plans: $19,567 (reported on 0.5% of returns)
30188:
$19,567
Georgia:
$27,751
(% of AGI for various income ranges: 5.0% for AGIs $25k-50k, 10.1% for AGIs $75k-100k, 24.2% for AGIs $100k-200k, 251.3% for AGIs over 200k)
Total itemized deductions: $30,282 (reported on 16.4% of returns)
Here:
$30,282
State:
$34,001
(% of AGI for various income ranges: 66.7% for AGIs below $25k, 197.9% for AGIs $25k-50k, 505.7% for AGIs $50k-75k, 800.9% for AGIs $75k-100k, 1580.9% for AGIs $100k-200k, 7072.5% for AGIs over 200k)
Charity contributions: $10,130 (reported on 14.0% of returns)
Here:
$10,130
State:
$14,164
(% of AGI for various income ranges: 6.3% for AGIs below $25k, 32.4% for AGIs $25k-50k, 86.2% for AGIs $50k-75k, 156.5% for AGIs $75k-100k, 391.8% for AGIs $100k-200k, 2864.9% for AGIs over 200k)
Taxes paid: $7,872 (reported on 16.4% of returns)
30188:
$7,872
State:
$7,540
(% of AGI for various income ranges: 8.9% for AGIs below $25k, 39.6% for AGIs $25k-50k, 122.2% for AGIs $50k-75k, 224.8% for AGIs $75k-100k, 485.4% for AGIs $100k-200k, 1640.0% for AGIs over 200k)
Earned income credit: $2,140 (reported on 10.9% of returns)
Here:
$2,140
State:
$2,530
(% of AGI for various income ranges: 75.2% for AGIs below $25k, 60.7% for AGIs $25k-50k, 1.2% for AGIs $50k-75k)
Percentage of individuals using paid preparers for their 2020 taxes: 92.6%
Here:
93%
State:
93%
(% for various income ranges: 90.6% for AGIs below $25k, 92.4% for AGIs $25k-50k, 92.8% for AGIs $50k-75k, 92.4% for AGIs $75k-100k, 93.9% for AGIs $100k-200k, 95.9% for AGIs over 200k)
Averages for the 2012 tax year for zip code 30188, filed in 2013:
Average Adjusted Gross Income (AGI) in 2012: $63,904 (Individual Income Tax Returns)
Here:
$63,904
State:
$56,131
Salary/wage: $58,603 (reported on 85.4% of returns)
Here:
$58,603
State:
$47,942
(% of AGI for various income ranges: 73.1% for AGIs below $25k, 81.1% for AGIs $25k-50k, 81.0% for AGIs $50k-75k, 82.9% for AGIs $75k-100k, 82.3% for AGIs $100k-200k, 65.3% for AGIs over 200k)
Taxable interest for individuals: $935 (reported on 31.7% of returns)
This zip code:
$935
Georgia:
$1,706
(% of AGI for various income ranges: 1.1% for AGIs below $25k, 0.5% for AGIs $25k-50k, 0.4% for AGIs $50k-75k, 0.4% for AGIs $75k-100k, 0.3% for AGIs $100k-200k, 0.6% for AGIs over 200k)
Ordinary dividends: $4,253 (reported on 21.3% of returns)
Here:
$4,253
State:
$7,265
(% of AGI for various income ranges: 1.5% for AGIs below $25k, 0.9% for AGIs $25k-50k, 0.8% for AGIs $50k-75k, 0.9% for AGIs $75k-100k, 0.8% for AGIs $100k-200k, 3.8% for AGIs over 200k)
Net capital gain/loss in AGI: +$8,806 (reported on 15.4% of returns)
Here:
+$8,806
State:
+$16,323
(% of AGI for various income ranges: 0.1% for AGIs $25k-50k, 0.3% for AGIs $50k-75k, 0.3% for AGIs $75k-100k, 0.8% for AGIs $100k-200k, 9.5% for AGIs over 200k)
Profit/loss from business: +$9,435 (reported on 20.7% of returns)
Here:
+$9,435
State:
+$7,583
(% of AGI for various income ranges: 11.6% for AGIs below $25k, 4.3% for AGIs $25k-50k, 2.4% for AGIs $50k-75k, 2.0% for AGIs $75k-100k, 2.2% for AGIs $100k-200k, 2.3% for AGIs over 200k)
Taxable individual retirement arrangement distribution: $17,179 (reported on 9.6% of returns)
30188:
$17,179
Georgia:
$17,199
(% of AGI for various income ranges: 3.3% for AGIs below $25k, 2.4% for AGIs $25k-50k, 2.9% for AGIs $50k-75k, 2.4% for AGIs $75k-100k, 2.8% for AGIs $100k-200k, 2.0% for AGIs over 200k)
Self-employment retirement plans: $15,550 (reported on 0.5% of returns)
30188:
$15,550
Georgia:
$23,277
(% of AGI for various income ranges: 0.2% for AGIs $50k-75k, 0.1% for AGIs $100k-200k, 0.2% for AGIs over 200k)
Total itemized deductions: $21,562 (22% of AGI, reported on 47.5% of returns)
Here:
$21,562
State:
$23,886
Here:
21.5% of AGI
State:
21.5% of AGI
(% of AGI for various income ranges: 13.6% for AGIs below $25k, 15.3% for AGIs $25k-50k, 17.1% for AGIs $50k-75k, 16.9% for AGIs $75k-100k, 16.5% for AGIs $100k-200k, 14.9% for AGIs over 200k)
Charity contributions: $4,264 (reported on 40.7% of returns)
Here:
$4,264
State:
$5,507
(% of AGI for various income ranges: 1.2% for AGIs below $25k, 1.8% for AGIs $25k-50k, 2.3% for AGIs $50k-75k, 2.5% for AGIs $75k-100k, 2.7% for AGIs $100k-200k, 4.3% for AGIs over 200k)
Taxes paid: $6,905 (reported on 47.3% of returns)
30188:
$6,905
State:
$7,838
(% of AGI for various income ranges: 2.3% for AGIs below $25k, 3.1% for AGIs $25k-50k, 4.5% for AGIs $50k-75k, 5.3% for AGIs $75k-100k, 6.1% for AGIs $100k-200k, 6.0% for AGIs over 200k)
Earned income credit: $2,174 (reported on 14.6% of returns)
Here:
$2,174
State:
$2,589
(% of AGI for various income ranges: 5.8% for AGIs below $25k, 1.1% for AGIs $25k-50k)
Percentage of individuals using paid preparers for their 2012 taxes: 46.7%
Here:
47%
State:
55%
(% for various income ranges: 44.2% for AGIs below $25k, 47.5% for AGIs $25k-50k, 47.6% for AGIs $50k-75k, 45.1% for AGIs $75k-100k, 47.0% for AGIs $100k-200k, 67.4% for AGIs over 200k)
Averages for the 2004 tax year for zip code 30188, filed in 2005:
Average Adjusted Gross Income (AGI) in 2004: $54,157 (Individual Income Tax Returns)
Here:
$54,157
State:
$47,553
Salary/wage: $50,931 (reported on 88.0% of returns)
Here:
$50,931
State:
$42,178
(% of AGI for various income ranges: 160.5% for AGIs below $10k, 77.4% for AGIs $10k-25k, 85.3% for AGIs $25k-50k, 87.4% for AGIs $50k-75k, 88.4% for AGIs $75k-100k, 75.8% for AGIs over 100k)
Taxable interest for individuals: $1,158 (reported on 42.8% of returns)
This zip code:
$1,158
Georgia:
$1,772
(% of AGI for various income ranges: 5.8% for AGIs below $10k, 1.8% for AGIs $10k-25k, 0.9% for AGIs $25k-50k, 0.6% for AGIs $50k-75k, 0.6% for AGIs $75k-100k, 1.0% for AGIs over 100k)
Taxable dividends: $2,026 (reported on 25.3% of returns)
Here:
$2,026
State:
$4,283
(% of AGI for various income ranges: 6.0% for AGIs below $10k, 1.2% for AGIs $10k-25k, 0.6% for AGIs $25k-50k, 0.6% for AGIs $50k-75k, 0.5% for AGIs $75k-100k, 1.4% for AGIs over 100k)
Net capital gain/loss: +$8,990 (reported on 19.0% of returns)
Here:
+$8,990
State:
+$16,461
(% of AGI for various income ranges: -2.6% for AGIs below $10k, -0.2% for AGIs $10k-25k, 0.3% for AGIs $25k-50k, 0.5% for AGIs $50k-75k, 0.9% for AGIs $75k-100k, 7.4% for AGIs over 100k)
Profit/loss from business: +$8,852 (reported on 18.8% of returns)
Here:
+$8,852
State:
+$8,201
(% of AGI for various income ranges: 17.0% for AGIs below $10k, 9.4% for AGIs $10k-25k, 4.0% for AGIs $25k-50k, 2.4% for AGIs $50k-75k, 2.0% for AGIs $75k-100k, 2.4% for AGIs over 100k)
IRA payment deduction: $3,020 (reported on 2.6% of returns)
30188:
$3,020
Georgia:
$2,969
(% of AGI for various income ranges: 0.3% for AGIs below $10k, 0.2% for AGIs $10k-25k, 0.2% for AGIs $25k-50k, 0.2% for AGIs $50k-75k, 0.1% for AGIs $75k-100k, 0.1% for AGIs over 100k)
Self-employed pension: $10,901 (reported on 0.7% of returns)
Here:
$10,901
Georgia:
$16,203
(% of AGI for various income ranges: 0.0% for AGIs $25k-50k, 0.0% for AGIs $50k-75k, 0.1% for AGIs $75k-100k, 0.3% for AGIs over 100k)
Total itemized deductions: $18,404 (23% of AGI, reported on 55.0% of returns)
Here:
$18,404
State:
$19,944
Here:
23.2% of AGI
State:
22.6% of AGI
(% of AGI for various income ranges: 32.0% for AGIs below $10k, 16.6% for AGIs $10k-25k, 19.9% for AGIs $25k-50k, 20.2% for AGIs $50k-75k, 20.1% for AGIs $75k-100k, 16.8% for AGIs over 100k)
Charity contributions deductions: $3,091 (4% of AGI, reported on 48.4% of returns)
Here:
$3,091
State:
$4,354
Here:
3.7% of AGI
State:
4.7% of AGI
(% of AGI for various income ranges: 1.6% for AGIs below $10k, 1.7% for AGIs $10k-25k, 2.6% for AGIs $25k-50k, 2.7% for AGIs $50k-75k, 2.9% for AGIs $75k-100k, 3.0% for AGIs over 100k)
Total tax: $7,460 (reported on 81.9% of returns)
30188:
$7,460
State:
$8,223
(% of AGI for various income ranges: 6.0% for AGIs below $10k, 5.0% for AGIs $10k-25k, 7.1% for AGIs $25k-50k, 8.9% for AGIs $50k-75k, 10.0% for AGIs $75k-100k, 15.9% for AGIs over 100k)
Earned income credit: $1,660 (reported on 9.4% of returns)
Here:
$1,660
State:
$1,986
Percentage of individuals using paid preparers for their 2004 taxes: 49.5%
Here:
49%
State:
62%
(% for various income ranges: 38.9% for AGIs below $10k, 52.5% for AGIs $10k-25k, 51.2% for AGIs $25k-50k, 49.7% for AGIs $50k-75k, 50.0% for AGIs $75k-100k, 54.8% for AGIs over 100k)
Likely homosexual households (counted as self-reported same-sex unmarried-partner households)
Lesbian couples: 0.1% of all households
Gay men: 0.2% of all households
Household received Food Stamps/SNAP in the past 12 months: 708 Household did not receive Food Stamps/SNAP in the past 12 months: 24,663
Women who had a birth in the past 12 months: 1,232 (1,120 now married, 113 unmarried) Women who did not have a birth in the past 12 months: 14,737 (7,439 now married, 7,282 unmarried)
Housing units in zip code 30188 with a mortgage: 14,759 (1,552 second mortgage, 109 home equity loan, 1,157 both second mortgage and home equity loan) Houses without a mortgage: 248
Median monthly owner costs for units with a mortgage: $1,793 Median monthly owner costs for units without a mortgage: $536
Residents with income below the poverty level in 2022:
This zip code:
6.5%
Whole state:
12.7%
Residents with income below 50% of the poverty level in 2022:
This zip code:
3.3%
Whole state:
6.3%
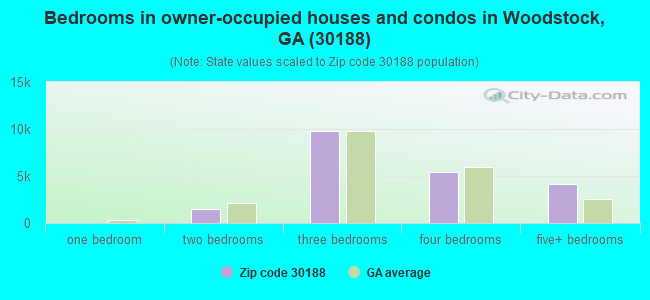
Median number of rooms in houses and condos:
Here:
7.0
State:
6.8
Median number of rooms in apartments:
Here:
4.8
State:
4.6
Notable locations in this zip code not listed on our city pages
Notable locations in zip code 30188: Parkway Business Center (A), Bell Industrial Park (B), Hickory Flat Fire Department Station 23 (C), Cherokee County Sheriff East Precinct (D), Cherokee County East Precinct Sheriff Station (E), Cherokee County Fire Department Little River Station (F), Woodstock Fire Department Station 10 (G), Woodstock Police Station (H), Woodstock Fire Department Station 14 (I), Cherokee County EMS 2 Fire Station (J), Woodstock Public Library (K), Woodstock Fire Department Station 24 (L). Display/hide their locations on the map
Shopping Centers: Woodstock Commons Shopping Center (1), Woodstock Village Shopping Center (2), Crossroads Village Shopping Center (3), Woodstock Place Shopping Center (4), Woodstock Square Shopping Center (5), Centre at Woodstock Shopping Center (6), Woodstock Crossing Shopping Center (7), Hickory Grove Shopping Center (8). Display/hide their locations on the map
Churches in zip code 30188 include: Allen Temple (A), Timothy Lutheran Church (B), Woodstock Presbyterian Church (C), Oasis of Love Church (D), Woodstock First Baptist Church (E), Cherokee Presbyterian Church (F), Welcome All Baptist Church (G), Hillcrest Baptist Church (H), Bethel Church (I). Display/hide their locations on the map
Reservoirs: Lake Cherful (A), Gordy Lake (B), Reece Lake (C), Michael Lake (D), Waters Lake (E), Lake Cherful Dam (F), Great Southeastern Land Fund Lake (G), Colony Land Development Lake (H). Display/hide their locations on the map
Creeks: Tate Creek (A), Rubes Creek (B), Rocky Creek (C), Copper Sandy Creek (D), Avery Creek (E), Mill Creek (F), Badger Creek (G). Display/hide their locations on the map
11,124 married couples with children.
2,314 single-parent households (889 men, 1,425 women).
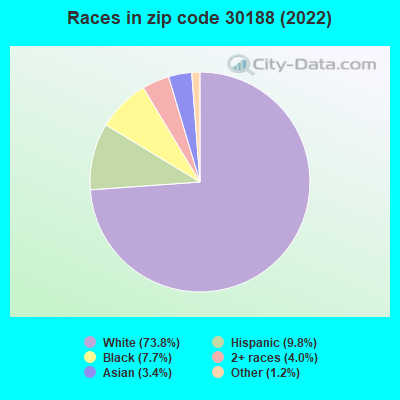
86.1% of residents of 30188 zip code speak English at home.
7.8% of residents speak Spanish at home (58% very well, 24% well, 11% not well, 7% not at all).
3.9% of residents speak other Indo-European language at home (78% very well, 13% well, 6% not well, 3% not at all).
1.5% of residents speak Asian or Pacific Island language at home (52% very well, 24% well, 21% not well, 3% not at all).
0.7% of residents speak other language at home (90% very well, 10% well).
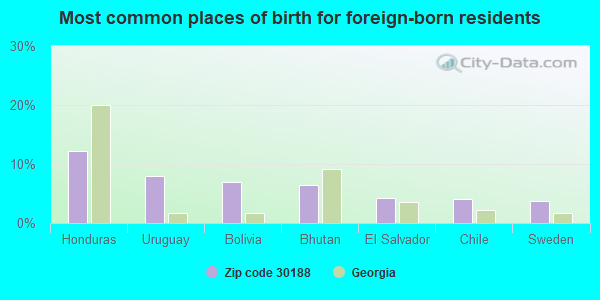
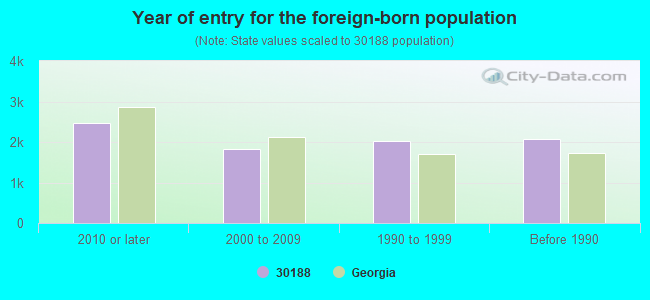
Foreign born population: 7,772 (11.8%) (58.9% of them are naturalized citizens)
Major facilities with environmental interests located in this zip code:
JD'S GLASSWORKS, INC. (11075 HIGHWAY 92 in WOODSTOCK, GA)
(Integrated Compliance Information System) - ICIS-04-2005-2017, ENFORCEMENT/COMPLIANCE ACTIVITY FORMAL ENFORCEMENT ACTION (Integrated Compliance Information System) - ICIS-04-2005-2017, ENFORCEMENT/COMPLIANCE ACTIVITY TRI REPORTER (Tracking of toxic chemicals releasing facilities) Business SIC classification: MILLWORK; GLASS PRODUCTS, MADE OF PURCHASED GLASS
CIRCLE K #2131 (3801 HWY 140 in WOODSTOCK, GA)
STATE MASTER (Georgia's Geographic Environmental Information) - UST-2, UNDERGROUND STORAGE TANK PROGRAM, UST-3, UST-1, (Resource Conservation and Recovery Act (tracking hazardous waste)) Organizations: CIRCLE K STORES INC (CONTACT/OPERATOR)
, APEX CONSTRUCTION COMPANY (INSTALLER)
JOHNSTON ELEMENTARY SCHOOL (2031 EAST CHEROKEE DRIVE in WOODSTOCK, GA)
(Geographic Names Information System) (National Center for Education Statistics) - STATE ID-0182 Organizations: CHEROKEE COUNTY (SCHOOL DISTRICT)
LITTLE RIVER ELEMENTARY SCHOOL (3170 TRICKUM ROAD in WOODSTOCK, GA)
(Geographic Names Information System) (National Center for Education Statistics) - STATE ID-0177 Organizations: CHEROKEE COUNTY (SCHOOL DISTRICT)
ARNOLD MILL ELEMENTARY SCHOOL (710 ARNOLD MILL ROAD in WOODSTOCK, GA)
(National Center for Education Statistics) - STATE ID-0397 Organizations: CHEROKEE COUNTY (SCHOOL DISTRICT)
MOUNTAIN ROAD ELEMENTARY SCHOOL (615 MOUNTAIN ROAD in WOODSTOCK, GA)
(National Center for Education Statistics) - STATE ID-0190 Organizations: CHEROKEE COUNTY (SCHOOL DISTRICT)
CACHET CLEANERS (1517J HWY 92 WEST in WOODSTOCK, GA)
Conditionally Exempt Small Quantity Generators, less than 100 kg/month of hazardous waste (Resource Conservation and Recovery Act (tracking hazardous waste)) Organizations: OPERNAME (CONTACT/OPERATOR)
, DAVE MUKESH (CONTACT/OPERATOR)
, WITMER CAROL C (CONTACT/OWNER)
PRECISION AUTO BODY SHOP (602 BASCOMB COMM PKWY EAST in WOODSTOCK, GA)
(Resource Conservation and Recovery Act (tracking hazardous waste)) Organizations: OPERNAME (CONTACT/OPERATOR)
, MATTINGLY GARY (CONTACT/OWNER)
CALLS USED AUTO PARTS (840 HWY 5 in WOODSTOCK, GA)
Housing units lacking complete plumbing facilities: 0.0% Housing units lacking complete kitchen facilities: 1.1%
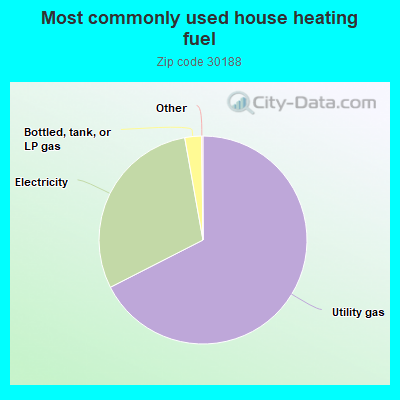
67.5%Utility gas
29.7%Electricity
2.6%Bottled, tank, or LP gas
Population in 1990: 33,172. Population change in the 1990s: +3,441 (+10.4%).
Place of birth for U.S.-born residents:
This state: 27,266
Northeast: 7,017
Midwest: 7,557
South: 12,447
West: 3,340
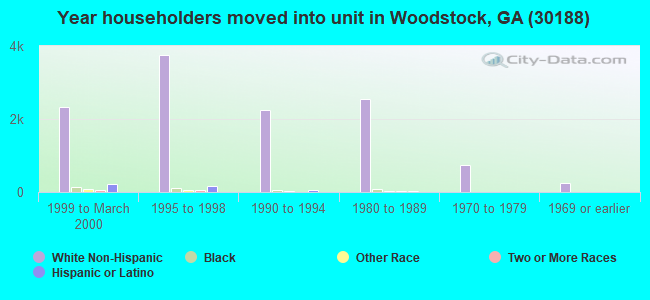
51% of the 30188 zip code residents lived in the same house 5 years ago. Out of people who lived in different houses, 25% lived in this county. Out of people who lived in different counties, 50% lived in Georgia.
89% of the 30188 zip code residents lived in the same house 1 year ago. Out of people who lived in different houses, 30% moved from this county. Out of people who lived in different houses, 39% moved from different county within same state. Out of people who lived in different houses, 30% moved from different state. Out of people who lived in different houses, 3% moved from abroad.
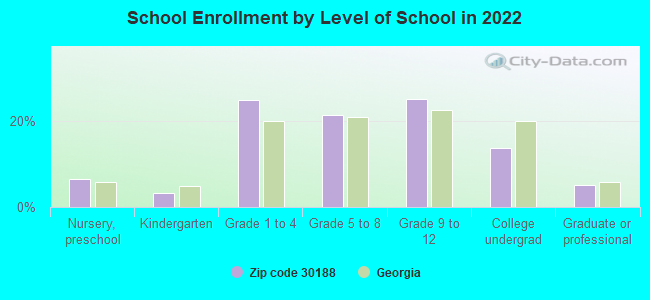
Private vs. public school enrollment:
Students in private schools in grades 1 to 8 (elementary and middle school): 1,182
Here:
17.2%
Georgia:
12.1%
Students in private schools in grades 9 to 12 (high school): 313
Here:
8.5%
Georgia:
10.8%
Students in private undergraduate colleges: 208
Here:
10.4%
Georgia:
17.1%
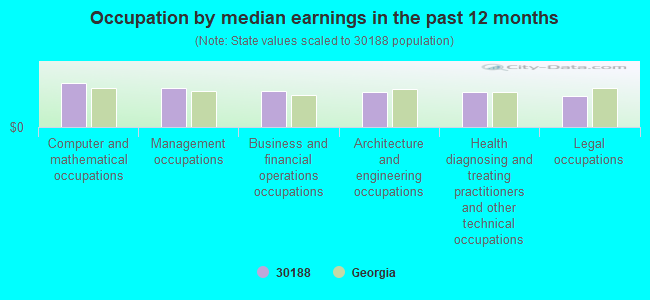
Occupation by median earnings in the past 12 months ($)
103,420Computer and mathematical occupations
92,518Management occupations
83,714Business and financial operations occupations
82,251Architecture and engineering occupations
81,611Health diagnosing and treating practitioners and other technical occupations
73,700Legal occupations
Companies with federal contracts located in this zip code (WOODSTOCK, GA):
SYSTEMS ATLANTA INC (405 TOONIGH RD; small business) : $5,318,666 in 29 contractsfrom 2001 to 2006
Contracts for Invalid code: AC67, ADP Software, Pressure, Temperature, and Humidity Measuring and Controlling Instruments, ADPE System Configuration, and moreby Air Force, Army Signed by year:2000: $0; 2001: $96,071; 2002: $217,049; 2003: $163,719; 2004: $340,927; 2005: $2,408,245; 2006: $2,092,655.
Biggest contracts:
$2,370,014 with Air Force for Invalid code: AC67. Signed on 2005-08-22. Completion date: 2008-08-25.
$1,973,209 with Air Force for ADP Software. Signed on 2006-03-01. Completion date: 2007-02-21.
$99,486 with Army for Pressure, Temperature, and Humidity Measuring and Controlling Instruments. Taking place in SC. Signed on 2002-09-30. Completion date: 2002-12-30.
$86,500 with Air Force for ADPE System Configuration. Signed on 2004-09-27. Completion date: 2004-11-01.
PREMIER ENERGY SERVICES, INC (140 COLONY CENTER DR; small business) : $5,140,117 in 11 contractsfrom 2003 to 2005
Contracts for Installation of Equipment -- Furnace, Steam Plant, and Drying Equipment; and Nuclear Reactors, Technical Representation Services -- Plumbing, Heating, and Waste Disposal Equipment, Maintenance, Repair and Rebuilding of Equipment -- Instruments and Laboratory Equipment by Army Signed by year:2000: $0; 2001: $0; 2002: $0; 2003: $4,055,860; 2004: $441,912; 2005: $642,345; 2006: $0.
Biggest contracts:
$2,786,849 with Army for Installation of Equipment -- Furnace, Steam Plant, and Drying Equipment; and Nuclear Reactors. Taking place in NJ. Signed on 2003-07-28. Completion date: 2003-12-30.
$708,780, same as above.Signed on 2003-12-17. Completion date: 2004-12-31.
$481,720 with Army for Technical Representation Services -- Plumbing, Heating, and Waste Disposal Equipment. Taking place in NJ. Signed on 2005-01-13. Completion date: 2005-08-31.
$260,110 with Army for Installation of Equipment -- Furnace, Steam Plant, and Drying Equipment; and Nuclear Reactors. Taking place in NJ. Signed on 2003-09-23. Completion date: 2003-11-30.
UPTRONIX, INC (296 BELL PARK DR; small business) : $916,667 in 52 contractsfrom 1999 to 2006
Contracts for Miscellaneous Electric Power and Distribution Equipment, Installation of Equipment -- Miscellaneous, Maintenance, Repair and Rebuilding of Equipment -- Prefabricated Structures and Scaffolding, Maintenance, Repair and Rebuilding of Equipment -- Electric Wire, and Power and Distribution Equipment, and moreby Internal Revenue Service, Air Force, Public Buildings Service, Navy, and others Signed by year:2000: $185,572; 2001: $140,000; 2002: $107,646; 2003: $83,011; 2004: $121,916; 2005: $112,276; 2006: $78,246.
Biggest contracts:
$73,021 with Internal Revenue Service for Miscellaneous Electric Power and Distribution Equipment. Signed on 2006-01-11. Effective on 2005-12-23. Completion date: 2005-09-30.
$72,125, same as above.Signed on 2005-02-08. Effective on 2004-11-01. Completion date: 2005-09-30.
$71,500 with Internal Revenue Service for Installation of Equipment -- Miscellaneous. Taking place in NC. Signed on 2003-06-15. Completion date: 2003-07-15.
$52,572 with Air Force for Maintenance, Repair and Rebuilding of Equipment -- Prefabricated Structures and Scaffolding. Signed on 2000-09-29. Completion date: 2001-01-08.
BOBBY LASHLEY CORP (601 BELL PARK CIR; small business) : $159,809 in 3 contractsfrom 2005 to 2006
$98,298 with Indian Health Service for Construction of Structures and Facilities -- Other Utilities. Taking place in MT. Signed on 2005-06-24. Completion date: 2005-08-19.
$37,174 with Air Force for Maintenance, Repair and Rebuilding of Equipment -- Metalworking Machinery. Signed on 2006-05-19. Completion date: 2006-06-30.
$24,337 with Public Health Service for Construction of Structures and Facilities -- Other Utilities. Taking place in MT. Signed on 2005-08-22. Completion date: 2005-08-12.
HEALTHTRONICS SERVICE CENTER, (229 ARNOLD MILL ROAD, SUIT; small business) : $111,000 in 3 contractsfrom 2003 to 2006
$69,000 with Navy for Maintenance, Repair and Rebuilding of Equipment -- Medical, Dental, and Veterinary Equipment and Supplies. Signed on 2003-10-01. Completion date: 2003-10-01.
$59,000, same as above.Signed on 2005-10-05. Completion date: 2006-09-30.
-$17,000, same as above.Signed on 2006-03-10. Completion date: 2006-09-30.
AAA SANITATION INC (2093 E CHEROKEE DR; small business)
$72,000 with Army for Trash/Garbage Collection Services - Including Portable Sanitation Services. Signed on 1999-11-24. Completion date: 2000-10-31.
LAW & COMPANY (100 ARNOLD MILL WAY A; small business)
$8,375 with Navy for Water Quality Support Services. Signed on 2004-12-27. Completion date: 2005-12-31.
MUNICIPAL SALES & LEASING INC (208 BELL PL; small business)
$5,640 with Army for Physical Properties Testing and Inspection. Taking place in IN. Signed on 2004-09-08. Completion date: 2004-10-15.
AQUASCAPE, INC (605 B MAULDIN DR; small business)
$5,280 with Air Force for Other Environmental Services, Studies, and Analytical Support. Taking place in AL. Signed on 2006-03-27. Completion date: 2006-11-30.
Top industries in this zip code by the number of employees in 2005:
2002 - 2018 National Fire Incident Reporting System (NFIRS) incidents
According to the data from the years 2002 - 2018 the average number of fire incidents per year is 156. The highest number of reported fire incidents - 201 took place in 2007, and the least - 72 in 2004. The data has a dropping trend.
When looking into fire subcategories, the most reports belonged to: Structure Fires (41.1%), and Outside Fires (39.8%).
Fire incident types reported to NFIRS in Zip Code 30188

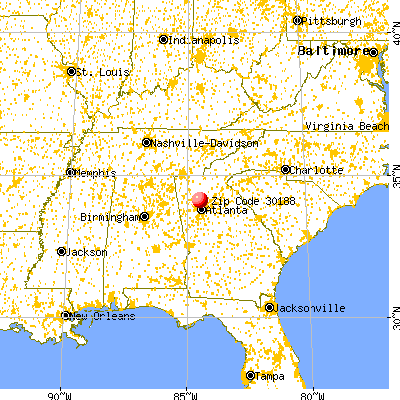


 Nearest zip codes: 30075, 30115, 30066, 30189, 30062, 30114.
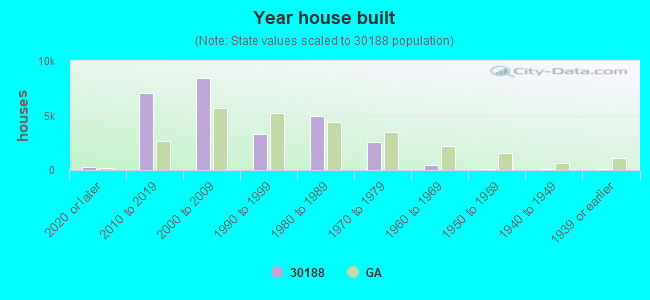


 According to the data from the years 2002 - 2018 the average number of fire incidents per year is 156. The highest number of reported fire incidents - 201 took place in 2007, and the least - 72 in 2004. The data has a dropping trend.
 When looking into fire subcategories, the most reports belonged to: Structure Fires (41.1%), and Outside Fires (39.8%).