Estimated zip code population in 2022: 39,792 Zip code population in 2010: 33,617 Zip code population in 2000: 28,885
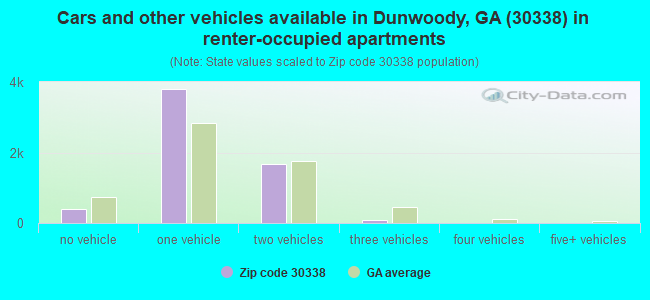
Houses and condos: 17,757 Renter-occupied apartments: 5,985
% of renters here:
36%
State:
34%
March 2022 cost of living index in zip code 30338: 104.2 (near average, U.S. average is 100)
Land area: 9.8 sq. mi. Water area: 0.1 sq. mi.
Population density: 4,053 people per square mile
(average).
OSM Map
General Map
Google Map
MSN Map
OSM Map
General Map
Google Map
MSN Map
OSM Map
General Map
Google Map
MSN Map
OSM Map
General Map
Google Map
MSN Map
Please wait while loading the map...
Real estate property taxes paid for housing units in 2022:
This zip code:
0.8% ($5,596)
Georgia:
0.7% ($2,160)
Median real estate property taxes paid for housing units with mortgages in 2022: $5,664 (0.8%) Median real estate property taxes paid for housing units with no mortgage in 2022: $5,374 (0.9%)
Estimated median house/condo value in 2022: $675,348
30338:
$675,348
Georgia:
$297,400
According to our research of Georgia and other state lists, there were 4 registered sex offenders living in 30338 zip code as of April 26, 2024. The ratio of all residents to sex offenders in zip code 30338 is 8,726 to 1. The ratio of registered sex offenders to all residents in this zip code is much lower than the state average.
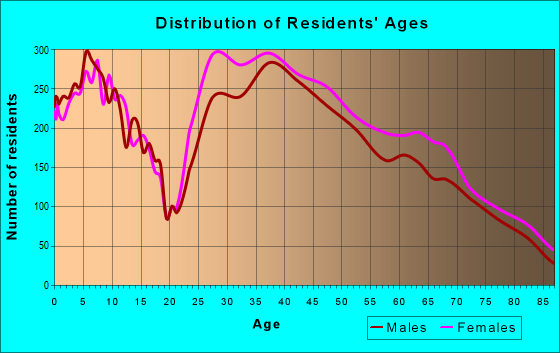
Median resident age:
This zip code:
38.6 years
Georgia median age:
37.6 years
Average household size:
This zip code:
2.4 people
Georgia:
2.6 people
Averages for the 2020 tax year for zip code 30338, filed in 2021:
Average Adjusted Gross Income (AGI) in 2020: $148,456 (Individual Income Tax Returns)
Here:
$148,456
State:
$70,847
Salary/wage: $124,171 (reported on 80.1% of returns)
Here:
$124,171
State:
$59,126
(% of AGI for various income ranges: 1189.6% for AGIs below $25k, 3823.6% for AGIs $25k-50k, 6906.9% for AGIs $50k-75k, 10223.7% for AGIs $75k-100k, 19197.2% for AGIs $100k-200k, 98684.7% for AGIs over 200k)
Taxable interest for individuals: $2,755 (reported on 46.7% of returns)
This zip code:
$2,755
Georgia:
$2,011
(% of AGI for various income ranges: 34.1% for AGIs below $25k, 48.6% for AGIs $25k-50k, 100.2% for AGIs $50k-75k, 114.6% for AGIs $75k-100k, 243.6% for AGIs $100k-200k, 1251.4% for AGIs over 200k)
Ordinary dividends: $11,250 (reported on 45.3% of returns)
Here:
$11,250
State:
$8,996
(% of AGI for various income ranges: 82.1% for AGIs below $25k, 153.5% for AGIs $25k-50k, 331.2% for AGIs $50k-75k, 515.5% for AGIs $75k-100k, 1001.4% for AGIs $100k-200k, 5082.7% for AGIs over 200k)
Net capital gain/loss in AGI: +$30,291 (reported on 43.0% of returns)
Here:
+$30,291
State:
+$28,402
(% of AGI for various income ranges: 46.8% for AGIs below $25k, 114.2% for AGIs $25k-50k, 197.5% for AGIs $50k-75k, 373.2% for AGIs $75k-100k, 946.6% for AGIs $100k-200k, 18731.2% for AGIs over 200k)
Profit/loss from business: +$20,839 (reported on 20.8% of returns)
Here:
+$20,839
State:
+$6,707
(% of AGI for various income ranges: 131.8% for AGIs below $25k, 189.9% for AGIs $25k-50k, 295.0% for AGIs $50k-75k, 337.4% for AGIs $75k-100k, 671.6% for AGIs $100k-200k, 4521.2% for AGIs over 200k)
Taxable individual retirement arrangement distribution: $28,670 (reported on 12.1% of returns)
30338:
$28,670
Georgia:
$20,525
(% of AGI for various income ranges: 76.8% for AGIs below $25k, 181.3% for AGIs $25k-50k, 305.9% for AGIs $50k-75k, 481.7% for AGIs $75k-100k, 1095.5% for AGIs $100k-200k, 2252.7% for AGIs over 200k)
Self-employed (Keogh) retirement plans: $31,370 (reported on 2.2% of returns)
30338:
$31,370
Georgia:
$27,751
(% of AGI for various income ranges: 42.2% for AGIs $50k-75k, 63.9% for AGIs $100k-200k, 940.4% for AGIs over 200k)
Total itemized deductions: $35,517 (reported on 23.6% of returns)
Here:
$35,517
State:
$34,001
(% of AGI for various income ranges: 156.5% for AGIs below $25k, 237.3% for AGIs $25k-50k, 546.2% for AGIs $50k-75k, 802.1% for AGIs $75k-100k, 1784.2% for AGIs $100k-200k, 8111.1% for AGIs over 200k)
Charity contributions: $13,217 (reported on 20.9% of returns)
Here:
$13,217
State:
$14,164
(% of AGI for various income ranges: 11.0% for AGIs below $25k, 42.3% for AGIs $25k-50k, 105.5% for AGIs $50k-75k, 157.3% for AGIs $75k-100k, 412.0% for AGIs $100k-200k, 3373.4% for AGIs over 200k)
Taxes paid: $8,755 (reported on 23.5% of returns)
30338:
$8,755
State:
$7,540
(% of AGI for various income ranges: 15.0% for AGIs below $25k, 46.3% for AGIs $25k-50k, 122.8% for AGIs $50k-75k, 221.3% for AGIs $75k-100k, 541.0% for AGIs $100k-200k, 1857.9% for AGIs over 200k)
Earned income credit: $1,881 (reported on 6.4% of returns)
Here:
$1,881
State:
$2,530
(% of AGI for various income ranges: 60.6% for AGIs below $25k, 39.3% for AGIs $25k-50k)
Percentage of individuals using paid preparers for their 2020 taxes: 92.3%
Here:
92%
State:
93%
(% for various income ranges: 89.4% for AGIs below $25k, 91.2% for AGIs $25k-50k, 91.4% for AGIs $50k-75k, 91.6% for AGIs $75k-100k, 93.6% for AGIs $100k-200k, 95.3% for AGIs over 200k)
Averages for the 2012 tax year for zip code 30338, filed in 2013:
Average Adjusted Gross Income (AGI) in 2012: $111,706 (Individual Income Tax Returns)
Here:
$111,706
State:
$56,131
Salary/wage: $94,507 (reported on 81.1% of returns)
Here:
$94,507
State:
$47,942
(% of AGI for various income ranges: 74.9% for AGIs below $25k, 78.3% for AGIs $25k-50k, 73.0% for AGIs $50k-75k, 71.5% for AGIs $75k-100k, 72.3% for AGIs $100k-200k, 64.1% for AGIs over 200k)
Taxable interest for individuals: $2,462 (reported on 47.9% of returns)
This zip code:
$2,462
Georgia:
$1,706
(% of AGI for various income ranges: 1.9% for AGIs below $25k, 1.2% for AGIs $25k-50k, 1.2% for AGIs $50k-75k, 1.1% for AGIs $75k-100k, 0.9% for AGIs $100k-200k, 1.0% for AGIs over 200k)
Ordinary dividends: $8,467 (reported on 41.7% of returns)
Here:
$8,467
State:
$7,265
(% of AGI for various income ranges: 5.1% for AGIs below $25k, 3.1% for AGIs $25k-50k, 3.2% for AGIs $50k-75k, 3.2% for AGIs $75k-100k, 3.1% for AGIs $100k-200k, 3.1% for AGIs over 200k)
Net capital gain/loss in AGI: +$16,220 (reported on 36.5% of returns)
Here:
+$16,220
State:
+$16,323
(% of AGI for various income ranges: 0.2% for AGIs below $25k, 0.3% for AGIs $25k-50k, 0.8% for AGIs $50k-75k, 1.5% for AGIs $75k-100k, 1.6% for AGIs $100k-200k, 9.4% for AGIs over 200k)
Profit/loss from business: +$19,094 (reported on 20.3% of returns)
Here:
+$19,094
State:
+$7,583
(% of AGI for various income ranges: 8.6% for AGIs below $25k, 3.7% for AGIs $25k-50k, 2.3% for AGIs $50k-75k, 2.8% for AGIs $75k-100k, 3.8% for AGIs $100k-200k, 3.3% for AGIs over 200k)
Taxable individual retirement arrangement distribution: $26,604 (reported on 15.5% of returns)
30338:
$26,604
Georgia:
$17,199
(% of AGI for various income ranges: 4.8% for AGIs below $25k, 4.0% for AGIs $25k-50k, 4.5% for AGIs $50k-75k, 5.0% for AGIs $75k-100k, 5.1% for AGIs $100k-200k, 2.6% for AGIs over 200k)
Self-employment retirement plans: $24,695 (reported on 2.3% of returns)
30338:
$24,695
Georgia:
$23,277
(% of AGI for various income ranges: 0.4% for AGIs below $25k, 0.2% for AGIs $75k-100k, 0.4% for AGIs $100k-200k, 0.8% for AGIs over 200k)
Total itemized deductions: $31,505 (18% of AGI, reported on 53.6% of returns)
Here:
$31,505
State:
$23,886
Here:
18.0% of AGI
State:
21.5% of AGI
(% of AGI for various income ranges: 23.1% for AGIs below $25k, 14.5% for AGIs $25k-50k, 15.9% for AGIs $50k-75k, 15.8% for AGIs $75k-100k, 16.7% for AGIs $100k-200k, 13.7% for AGIs over 200k)
Charity contributions: $6,686 (reported on 48.3% of returns)
Here:
$6,686
State:
$5,507
(% of AGI for various income ranges: 1.7% for AGIs below $25k, 2.0% for AGIs $25k-50k, 2.2% for AGIs $50k-75k, 2.3% for AGIs $75k-100k, 2.6% for AGIs $100k-200k, 3.4% for AGIs over 200k)
Taxes paid: $12,788 (reported on 53.4% of returns)
30338:
$12,788
State:
$7,838
(% of AGI for various income ranges: 3.7% for AGIs below $25k, 3.2% for AGIs $25k-50k, 4.2% for AGIs $50k-75k, 5.2% for AGIs $75k-100k, 6.9% for AGIs $100k-200k, 6.6% for AGIs over 200k)
Earned income credit: $1,775 (reported on 7.6% of returns)
Here:
$1,775
State:
$2,589
(% of AGI for various income ranges: 3.9% for AGIs below $25k, 0.4% for AGIs $25k-50k)
Percentage of individuals using paid preparers for their 2012 taxes: 52.8%
Here:
53%
State:
55%
(% for various income ranges: 47.9% for AGIs below $25k, 45.8% for AGIs $25k-50k, 51.6% for AGIs $50k-75k, 52.9% for AGIs $75k-100k, 56.1% for AGIs $100k-200k, 66.5% for AGIs over 200k)
Averages for the 2004 tax year for zip code 30338, filed in 2005:
Average Adjusted Gross Income (AGI) in 2004: $94,353 (Individual Income Tax Returns)
Here:
$94,353
State:
$47,553
Salary/wage: $80,314 (reported on 80.2% of returns)
Here:
$80,314
State:
$42,178
(% of AGI for various income ranges: 71.8% for AGIs $10k-25k, 77.3% for AGIs $25k-50k, 71.1% for AGIs $50k-75k, 70.3% for AGIs $75k-100k, 65.7% for AGIs over 100k)
Taxable interest for individuals: $2,871 (reported on 62.2% of returns)
This zip code:
$2,871
Georgia:
$1,772
(% of AGI for various income ranges: 4.2% for AGIs $10k-25k, 2.2% for AGIs $25k-50k, 2.6% for AGIs $50k-75k, 2.3% for AGIs $75k-100k, 1.5% for AGIs over 100k)
Taxable dividends: $5,721 (reported on 52.1% of returns)
Here:
$5,721
State:
$4,283
(% of AGI for various income ranges: 4.7% for AGIs $10k-25k, 3.3% for AGIs $25k-50k, 3.3% for AGIs $50k-75k, 3.1% for AGIs $75k-100k, 3.0% for AGIs over 100k)
Net capital gain/loss: +$14,001 (reported on 45.0% of returns)
Here:
+$14,001
State:
+$16,461
(% of AGI for various income ranges: 1.0% for AGIs $10k-25k, 1.0% for AGIs $25k-50k, 1.4% for AGIs $50k-75k, 1.6% for AGIs $75k-100k, 8.7% for AGIs over 100k)
Profit/loss from business: +$20,109 (reported on 18.3% of returns)
Here:
+$20,109
State:
+$8,201
(% of AGI for various income ranges: 5.9% for AGIs $10k-25k, 3.3% for AGIs $25k-50k, 3.8% for AGIs $50k-75k, 4.7% for AGIs $75k-100k, 3.7% for AGIs over 100k)
IRA payment deduction: $3,598 (reported on 3.9% of returns)
30338:
$3,598
Georgia:
$2,969
(% of AGI for various income ranges: 0.3% for AGIs $10k-25k, 0.3% for AGIs $25k-50k, 0.3% for AGIs $50k-75k, 0.3% for AGIs $75k-100k, 0.1% for AGIs over 100k)
Self-employed pension: $17,374 (reported on 3.2% of returns)
Here:
$17,374
Georgia:
$16,203
(% of AGI for various income ranges: 0.2% for AGIs $25k-50k, 0.2% for AGIs $50k-75k, 0.5% for AGIs $75k-100k, 0.7% for AGIs over 100k)
Total itemized deductions: $26,827 (18% of AGI, reported on 55.9% of returns)
Here:
$26,827
State:
$19,944
Here:
18.3% of AGI
State:
22.6% of AGI
(% of AGI for various income ranges: 19.0% for AGIs $10k-25k, 16.6% for AGIs $25k-50k, 18.6% for AGIs $50k-75k, 20.6% for AGIs $75k-100k, 14.6% for AGIs over 100k)
Charity contributions deductions: $5,435 (4% of AGI, reported on 51.5% of returns)
Here:
$5,435
State:
$4,354
Here:
3.6% of AGI
State:
4.7% of AGI
(% of AGI for various income ranges: 2.0% for AGIs $10k-25k, 2.4% for AGIs $25k-50k, 2.9% for AGIs $50k-75k, 3.1% for AGIs $75k-100k, 3.0% for AGIs over 100k)
Total tax: $19,176 (reported on 84.9% of returns)
30338:
$19,176
State:
$8,223
(% of AGI for various income ranges: 4.8% for AGIs $10k-25k, 8.2% for AGIs $25k-50k, 10.5% for AGIs $50k-75k, 11.1% for AGIs $75k-100k, 20.1% for AGIs over 100k)
Earned income credit: $1,414 (reported on 5.5% of returns)
Here:
$1,414
State:
$1,986
Percentage of individuals using paid preparers for their 2004 taxes: 55.1%
Here:
55%
State:
62%
(% for various income ranges: 49.8% for AGIs below $10k, 55.1% for AGIs $10k-25k, 48.9% for AGIs $25k-50k, 54.1% for AGIs $50k-75k, 54.2% for AGIs $75k-100k, 62.5% for AGIs over 100k)
Likely homosexual households (counted as self-reported same-sex unmarried-partner households)
Lesbian couples: 0.0% of all households
Gay men: 0.2% of all households
Household received Food Stamps/SNAP in the past 12 months: 260 Household did not receive Food Stamps/SNAP in the past 12 months: 16,360
Women who had a birth in the past 12 months: 368 (343 now married, 25 unmarried) Women who did not have a birth in the past 12 months: 9,773 (5,027 now married, 4,735 unmarried)
Housing units in zip code 30338 with a mortgage: 7,182 (768 second mortgage, 14 home equity loan, 745 both second mortgage and home equity loan) Houses without a mortgage: 138
Median monthly owner costs for units with a mortgage: $2,563 Median monthly owner costs for units without a mortgage: $852
Residents with income below the poverty level in 2022:
This zip code:
3.7%
Whole state:
12.7%
Residents with income below 50% of the poverty level in 2022:
This zip code:
1.0%
Whole state:
6.3%
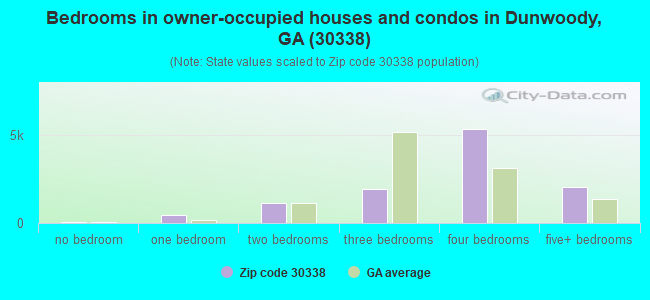
Median number of rooms in houses and condos:
Here:
8.2
State:
6.8
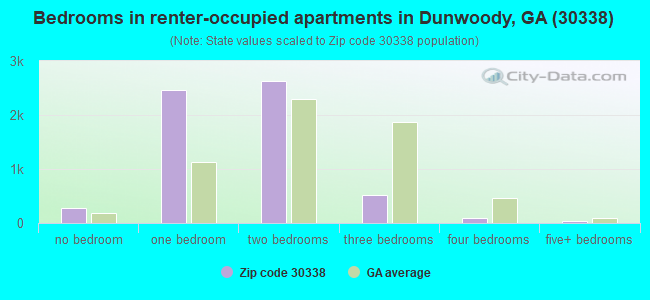
Median number of rooms in apartments:
Here:
3.4
State:
4.6
Notable locations in this zip code not listed on our city pages
Notable locations in zip code 30338: DeKalb County Fire and Rescue Department Station 21 (A), DeKalb County Fire and Rescue Department Station 18 (B), DeKalb County Fire and Rescue Department Station 12 (C), Dunwoody Library (D). Display/hide their locations on the map
Shopping Centers: The Shops at Dunwoody Shopping Center (1), Williamsburg at Dunwoody Shopping Center (2), Mount Vernon Shopping Center (3), Georgetown Shopping Center (4), Dunwoody Village Shopping Center (5), Dunwoody Hall Shopping Center (6), Perimeter Village Shopping Center (7). Display/hide their locations on the map
In group quarters: 81 (-1 institutionalized population)
Size of family households: 4,177 2-persons, 2,687 3-persons, 2,191 4-persons, 862 5-persons, 113 6-persons, 50 7-or-more-persons
Size of nonfamily households: 5,612 1-person, 945 2-persons, 115 3-persons
8,212 married couples with children.
926 single-parent households (248 men, 678 women).
76.8% of residents of 30338 zip code speak English at home.
2.4% of residents speak Spanish at home (80% very well, 20% well).
7.9% of residents speak other Indo-European language at home (76% very well, 16% well, 7% not well, 2% not at all).
12.6% of residents speak Asian or Pacific Island language at home (75% very well, 22% well, 3% not well).
1.2% of residents speak other language at home (100% very well).
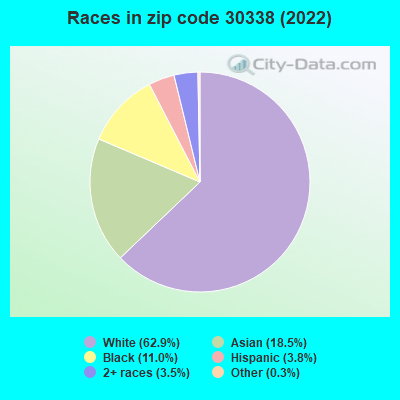
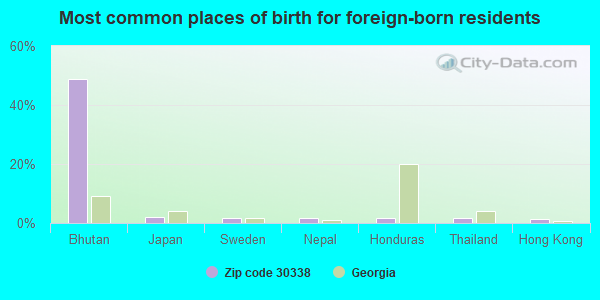
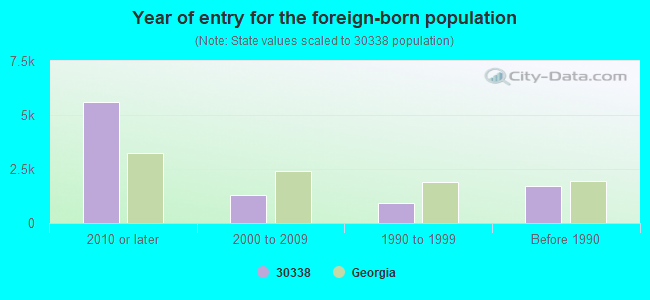
Foreign born population: 7,995 (20.1%) (35.5% of them are naturalized citizens)
Major facilities with environmental interests located in this zip code:
BST DNWDGAMA F5403 (5375 CHAMBLEE-DUNWOODY RD in DUNWOODY, GA)
AIR SYNTHETIC MINOR (AIRS/AFS) STATE MASTER (Georgia's Geographic Environmental Information) - UST-1, UNDERGROUND STORAGE TANK PROGRAM, UST-2, (Resource Conservation and Recovery Act (tracking hazardous waste)) Organizations: OPERNAME (CONTACT/OPERATOR)
, BELLSOUTH TELECOMMUNICATIONS (CONTACT/OPERATOR)
, OMEGA ENV SVCS (INSTALLER)
Alternative names: BELLSOUTH TELECOMMUNICATIONS, BELLSOUTH TELECOMMUNICATIONS/5375 CHAMBL, BST/DUNWOODY CO/F5403
BP OIL CO #18903 (5418 CHAMBLEE DUNWOODY RD in DUNWOODY, GA)
STATE MASTER (Georgia's Geographic Environmental Information) - UST-1, UNDERGROUND STORAGE TANK PROGRAM, UST-1A, UST-2, UST-2A, UST-3, UST-3A, UST-4, UST-4A, Conditionally Exempt Small Quantity Generators, less than 100 kg/month of hazardous waste (Resource Conservation and Recovery Act (tracking hazardous waste)) Organizations: PANGEAN SOLUTIONS (CONTACT/AGENT)
, BP PRODUCTS NORTH AMERICA INC (CONTACT/OPERATOR)
Alternative names: BP/AMOCO #469, BP #18903, BP/AMOCO #469
NORTHRIDGE EXXON (8325 ROSWELL RD in DUNWOODY, GA)
STATE MASTER (Georgia's Geographic Environmental Information) - UST-1, UNDERGROUND STORAGE TANK PROGRAM, UST-4, UST-5, UST-2, UST-3, Conditionally Exempt Small Quantity Generators, less than 100 kg/month of hazardous waste (Resource Conservation and Recovery Act (tracking hazardous waste)) - notification Organizations: EXXON MOBIL CORPORATION (CONTACT/OPERATOR)
, GOLDEN EAGLE PARTNERS LLC (CONTACT/OWNER)
, EXXON MOBIL (CONTACT/OWNER)
Alternative names: EXXON R/S #46865, EXXON RAS 46865
BROOK RUN/ GA DHR (4770 N PEACHTREE RD in DUNWOODY, GA)
(Integrated Compliance Information System) - ICIS-04-1995-0501, FORMAL ENFORCEMENT ACTION COMPLIANCE ACTIVITY (Tracking inspections of insecticide, fungicide, and rodenticide, and toxic substances)
AUSTIN ELEMENTARY SCHOOL (5435 ROBERTS DRIVE in DUNWOODY, GA)
(Geographic Names Information System) (National Center for Education Statistics) - STATE ID-0175 Organizations: DEKALB COUNTY (SCHOOL DISTRICT)
KINGSLEY ELEMENTARY SCHOOL (2051 BRENDON DRIVE in DUNWOODY, GA)
(Geographic Names Information System) (National Center for Education Statistics) - STATE ID-5059 Organizations: DEKALB COUNTY (SCHOOL DISTRICT)
CHESNUT ELEMENTARY SCHOOL (4576 NORTH PEACHTREE ROAD in DUNWOODY, GA)
(National Center for Education Statistics) - STATE ID-3053 Organizations: DEKALB COUNTY (SCHOOL DISTRICT)
PEACHTREE MIDDLE SCHOOL (4664 NORTH PEACHTREE ROAD in ATLANTA, GA)
(National Center for Education Statistics) - STATE ID-0189 Organizations: DEKALB COUNTY (SCHOOL DISTRICT)
EVERGREEN WASTE LLC (1536 DUNWOODY VILLAGE PKWY #140 in ATLANTA, GA)
TRANSPORTER (Resource Conservation and Recovery Act (tracking hazardous waste)) USED OIL PROGRAM (Resource Conservation and Recovery Act (tracking hazardous waste)) Business NAICS classification: SOLID WASTE COLLECTION.; HAZARDOUS WASTE COLLECTION. Organizations: EVERGREEN WASTE INC (CONTACT/OPERATOR)
, DECK DUNWOODY VILG. COURT, LLC (CONTACT/OWNER)
, BLAIR BRIDGE HOLDING LLC (CONTACT/OWNER)
Alternative names: EVERGREEN WASTE INC
ATLANTA WASTE OIL COMPANY (5315 FOREST SPRINGS DRIVE in ATLANTA, GA)
CHATTAHOOCHEE CLEANERS (8540 ROSWELL RD in ATLANTA, GA)
(Resource Conservation and Recovery Act (tracking hazardous waste)) Organizations: OPERNAME (CONTACT/OPERATOR)
, MCCUTCHEN STEVE (CONTACT/OWNER)
Housing units lacking complete plumbing facilities: 0.4% Housing units lacking complete kitchen facilities: 0.6%
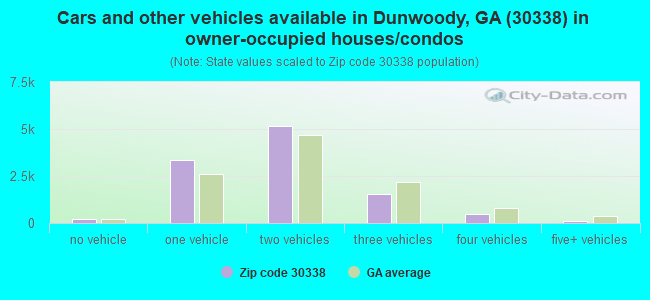
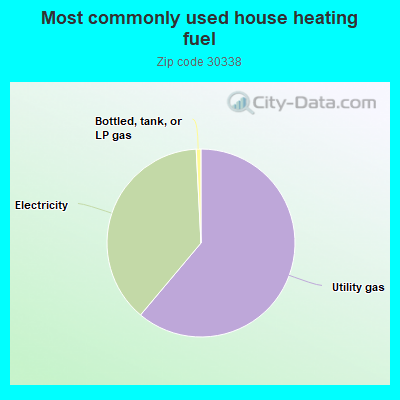
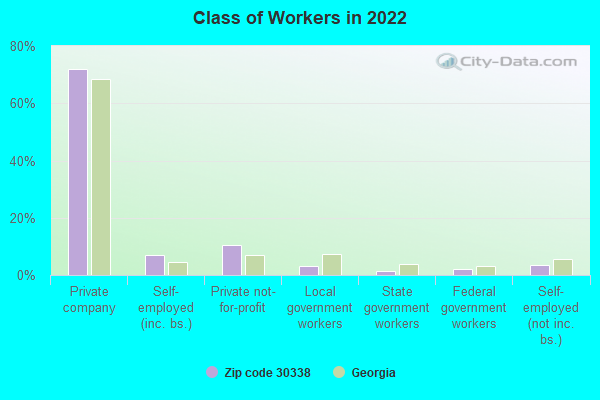
61.0%Utility gas
38.0%Electricity
0.8%Bottled, tank, or LP gas
Population in 1990: 23,565. Population change in the 1990s: +5,320 (+22.6%).
Place of birth for U.S.-born residents:
This state: 14,166
Northeast: 4,617
Midwest: 3,565
South: 6,950
West: 1,695
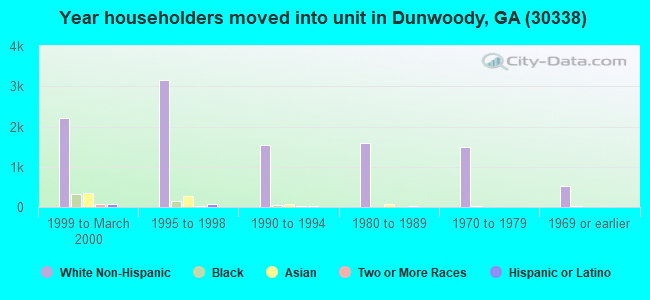
51% of the 30338 zip code residents lived in the same house 5 years ago. Out of people who lived in different houses, 30% lived in this county. Out of people who lived in different counties, 50% lived in Georgia.
89% of the 30338 zip code residents lived in the same house 1 year ago. Out of people who lived in different houses, 32% moved from this county. Out of people who lived in different houses, 38% moved from different county within same state. Out of people who lived in different houses, 26% moved from different state. Out of people who lived in different houses, 6% moved from abroad.
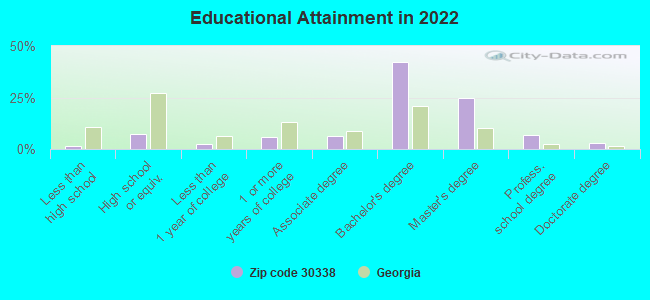
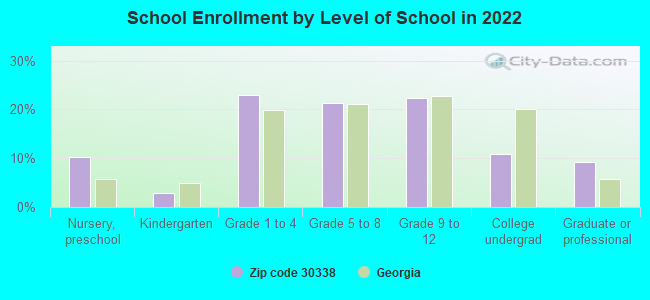
Private vs. public school enrollment:
Students in private schools in grades 1 to 8 (elementary and middle school): 1,623
Here:
35.3%
Georgia:
12.1%
Students in private schools in grades 9 to 12 (high school): 753
Here:
33.1%
Georgia:
10.8%
Students in private undergraduate colleges: 222
Here:
20.0%
Georgia:
17.1%
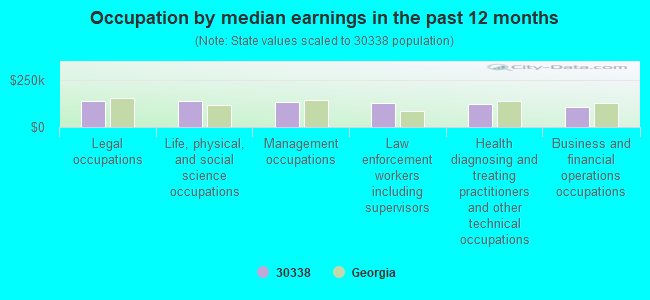
Occupation by median earnings in the past 12 months ($)
138,391Legal occupations
136,632Life, physical, and social science occupations
136,029Management occupations
130,020Law enforcement workers including supervisors
124,294Health diagnosing and treating practitioners and other technical occupations
108,823Business and financial operations occupations
Companies with biggest federal contracts located in this zip code (ATLANTA, GA):
OPTECH MONETTE LLC (1536 DUNWOODY VILLAGE PKWY; small business) : $4,703,229 in 18 contractsfrom 2002 to 2006
Contracts for Operation of Government-Owned Facilities -- Government-Owned Contractor-Operated (GOCO) R&D Facilities, Operation of Government-Owned Facilities -- Sewage and Waste Facilities by Army, Air Force Signed by year:2000: $0; 2001: $0; 2002: $1,261,025; 2003: $910,075; 2004: $1,211,036; 2005: $1,321,093; 2006: $0.
Biggest contracts:
$1,003,650 with Army for Operation of Government-Owned Facilities -- Government-Owned Contractor-Operated (GOCO) R&D Facilities. Taking place in NJ. Signed on 2005-11-15. Completion date: 2006-09-30.
$949,650, same as above.Signed on 2004-10-15. Completion date: 2005-09-30.
$917,643, same as above.Signed on 2003-10-09. Completion date: 2004-09-30.
$768,325, same as above.Signed on 2002-10-10. Completion date: 2002-09-30.
OPERATIONS TECHNOLOGIES (1536 DUNWOODY VILLAGE PARK; small business) : $2,980,487 in 12 contractsfrom 1999 to 2004
Contracts for Operation of Government-Owned Facilities -- Sewage and Waste Facilities, Waste Treatment and Storage by Army, Air Force Signed by year:2000: $1,252,624; 2001: $618,610; 2002: $437,019; 2003: $369,430; 2004: $86,107; 2005: $0; 2006: $0.
Biggest contracts:
$991,410 with Army for Operation of Government-Owned Facilities -- Sewage and Waste Facilities. Taking place in NJ. Signed on 2000-10-19. Completion date: 2001-09-30.
$369,430 with Air Force for Operation of Government-Owned Facilities -- Sewage and Waste Facilities. Taking place in ID. Signed on 2003-07-01. Completion date: 2004-06-30.
$359,350, same as above.Signed on 2002-06-19. Completion date: 2003-06-30.
$350,800 with Air Force for Operation of Government-Owned Facilities -- Sewage and Waste Facilities. Signed on 2001-07-01. Completion date: 2002-07-30.
AMERICAN RAILROAD INDUSTRIES I (5152 MOUNT VERNON WAY; small business) : $1,428,840 in 3 contractsfrom 2002 to 2004
$860,968 with Air Force for Maintenance, Repair or Alteration of Real Property -- Other Non-Building Facilities. Taking place in SC. Signed on 2002-09-12. Completion date: 2002-09-12.
$349,982 with Army for Maintenance, Repair or Alteration of Real Property -- Highways, Roads, Streets, Bridges, and Railways (includes resurfacing). Taking place in AL. Signed on 2004-03-15. Completion date: 2004-12-10.
$217,890, same as above.Signed on 2002-01-23. Completion date: 2002-10-31.
NESTLE USA, INC. (1117 PERIMETER CTR W # 10) : $885,975 in 2 contractsfrom 2001 to 2002
$708,750 with Defense Logistics Agency for Coffee, Tea, and Cocoa. Taking place in NJ. Signed on 2002-01-24. Completion date: 2002-10-15.
$177,225, same as above.Signed on 2001-11-06. Completion date: 2020-11-05.
NESTLE USA INC (1117 PERIMETER CTR W) : $718,458 in 3 contractsfrom 1999 to 2000
$607,500 with Defense Logistics Agency for Coffee, Tea, and Cocoa. Taking place in NJ. Signed on 2000-01-31. Completion date: 2001-01-31.
$62,325, same as above.Signed on 2000-08-22. Completion date: 2000-11-30.
$48,633 with Defense Logistics Agency for Coffee, Tea, and Cocoa. Taking place in VA. Signed on 1999-12-22. Completion date: 2000-02-15.
TRC STAFFING SERVICES INC (100 ASHFORD CTR N STE 500; small business) : $375,440 in 16 contractsfrom 2003 to 2006
Contracts for Other Professional Services, Educational Services, Technical Assistance by Army Signed by year:2000: $0; 2001: $0; 2002: $0; 2003: $134,902; 2004: $48,526; 2005: $102,078; 2006: $89,934.
Biggest contracts:
$89,934 with Army for Other Professional Services. Signed on 2006-03-15. Completion date: 2006-05-31.
$87,334, same as above.Signed on 2005-06-01. Completion date: 2006-05-31.
$58,656 with Army for Educational Services. Signed on 2003-09-20. Completion date: 2004-09-29.
$29,328, same as above.Signed on 2004-11-17. Completion date: 2004-09-29.
NATIONAL SYSTEMS, INC (200 ASHFORD CENTER NOTHER) : $348,613 in 10 contractsfrom 2001 to 2003
Contracts for Hospital Furniture, Equipment, Utensils, and Supplies, Office Furniture, Household Furniture, Cabinets, Lockers, Bins, and Shelving by Army, Defense Logistics Agency Signed by year:2000: $0; 2001: $34,423; 2002: $307,452; 2003: $6,738; 2004: $0; 2005: $0; 2006: $0.
Biggest contracts:
$83,783 with Army for Hospital Furniture, Equipment, Utensils, and Supplies. Signed on 2002-09-26. Completion date: 2002-11-29.
$82,175, same as above.Signed on 2002-09-26. Completion date: 2002-11-20.
$75,481 with Army for Office Furniture. Signed on 2002-09-24. Completion date: 2002-10-31.
$46,248 with Army for Household Furniture. Signed on 2002-09-24. Completion date: 2002-10-31.
PEARLNET LLC (1200 ASHWOOD PARKWAY; small business) : $319,783 in 7 contractsfrom 2004 to 2006
Contracts for Cable, Cord, and Wire Assemblies: Communications Equipment, ADPE System Configuration by Army, U.S. Special Operations Command Signed by year:2000: $0; 2001: $0; 2002: $0; 2003: $0; 2004: $18,200; 2005: $230,981; 2006: $70,602.
Biggest contracts:
$92,700 with Army for Cable, Cord, and Wire Assemblies: Communications Equipment. Signed on 2005-09-07. Completion date: 2005-10-07.
$70,602 with U.S. Special Operations Command for ADPE System Configuration. Taking place in NC. Signed on 2006-04-20. Completion date: 2006-05-15.
$55,379 with Army for ADPE System Configuration. Signed on 2005-03-29. Completion date: 2005-03-31.
$55,000, same as above.Signed on 2005-03-23. Completion date: 2005-03-01.
THE HARTFORD STEAM BOILER INSP (200 ASHFORD CTR N STE 300; small business) : $199,703 in 6 contractsfrom 2000 to 2002
Contracts for Maintenance, Repair and Rebuilding of Equipment -- Plumbing, Heating, and Waste Disposal Equipment, Inspection Services (including commercial testing and lab services, except medical/dental) -- Miscellaneous by Air Force, Army Signed by year:2000: $105,803; 2001: $60,000; 2002: $33,900; 2003: $0; 2004: $0; 2005: $0; 2006: $0.
Biggest contracts:
$53,803 with Air Force for Maintenance, Repair and Rebuilding of Equipment -- Plumbing, Heating, and Waste Disposal Equipment. Signed on 2000-11-28. Completion date: 2000-11-20.
$52,000, same as above.Signed on 2000-11-28. Completion date: 2000-11-20.
$35,000, same as above.Signed on 2001-01-17. Completion date: 2001-09-28.
$31,500, same as above.Signed on 2002-01-21. Completion date: 2002-03-31.
CLOROX SALES COMPANY, THE (INC (2498 JETT FERRY RD)
$146,668 with Department of Defense for Food Items For Resale. Signed on 1999-10-31. Completion date: 1999-10-31.
Top industries in this zip code by the number of employees in 2005:
Administrative and Support and Waste Management and Remediation Services: Temporary Help Services (over 1000 employees: 1 establishment, 100-249 employees: 2 establishments, 50-99 employees: 3 establishments, 20-49 employees: 2 establishments, 10-19 employees: 2 establishments, 5-9 employees: 1 establishment, 1-4 employees: 6 establishments)
Administrative and Support and Waste Management and Remediation Services: Professional Employer Organizations (over 1000: 1, 100-249: 1, 50-99: 2, 20-49: 1, 10-19: 1, 5-9: 1)
2002 - 2018 National Fire Incident Reporting System (NFIRS) incidents
According to the data from the years 2002 - 2018 the average number of fire incidents per year is 48. The highest number of fires - 79 took place in 2011, and the least - 0 in 2004. The data has a declining trend.
When looking into fire subcategories, the most incidents belonged to: Outside Fires (38.7%), and Structure Fires (30.7%).
Fire incident types reported to NFIRS in Zip Code 30338


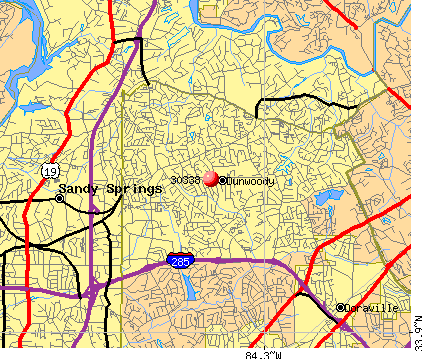 Nearest zip codes: 30346, 30350, 30360, 30341, 30328, 30319.
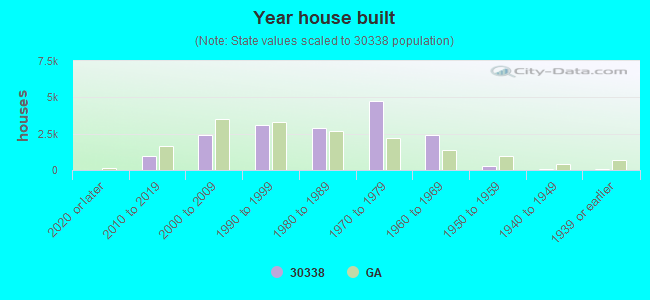


 According to the data from the years 2002 - 2018 the average number of fire incidents per year is 48. The highest number of fires - 79 took place in 2011, and the least - 0 in 2004. The data has a declining trend.
 When looking into fire subcategories, the most incidents belonged to: Outside Fires (38.7%), and Structure Fires (30.7%).