Estimated zip code population in 2022: 17,237 Zip code population in 2010: 18,408 Zip code population in 2000: 19,121
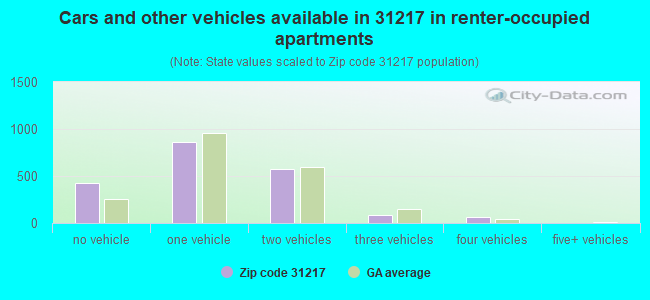
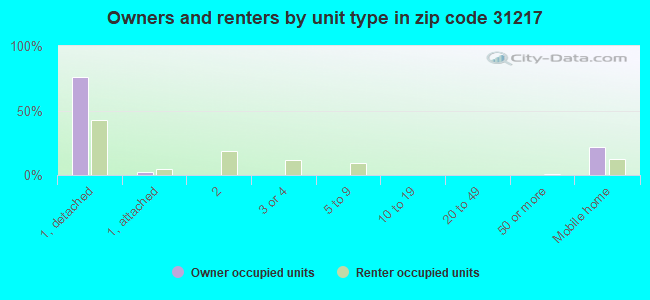
Houses and condos: 8,293 Renter-occupied apartments: 2,015
% of renters here:
30%
State:
34%
March 2022 cost of living index in zip code 31217: 86.9 (less than average, U.S. average is 100)
Land area: 98.7 sq. mi. Water area: 1.1 sq. mi.
Population density: 175 people per square mile
(very low).
OSM Map
General Map
Google Map
MSN Map
OSM Map
General Map
Google Map
MSN Map
OSM Map
General Map
Google Map
MSN Map
OSM Map
General Map
Google Map
MSN Map
Please wait while loading the map...
Real estate property taxes paid for housing units in 2022:
This zip code:
0.8% ($929)
Georgia:
0.7% ($2,160)
Median real estate property taxes paid for housing units with mortgages in 2022: $1,203 (1.0%) Median real estate property taxes paid for housing units with no mortgage in 2022: $779 (0.8%)
Averages for the 2020 tax year for zip code 31217, filed in 2021:
Average Adjusted Gross Income (AGI) in 2020: $32,857 (Individual Income Tax Returns)
Here:
$32,857
State:
$70,847
Salary/wage: $30,518 (reported on 82.5% of returns)
Here:
$30,518
State:
$59,126
(% of AGI for various income ranges: 1192.7% for AGIs below $25k, 3508.7% for AGIs $25k-50k, 6823.1% for AGIs $50k-75k, 8887.0% for AGIs $75k-100k, 17870.6% for AGIs $100k-200k)
Taxable interest for individuals: $451 (reported on 12.7% of returns)
This zip code:
$451
Georgia:
$2,011
(% of AGI for various income ranges: 3.0% for AGIs below $25k, 3.8% for AGIs $25k-50k, 16.7% for AGIs $50k-75k, 48.7% for AGIs $75k-100k, 38.1% for AGIs $100k-200k)
Ordinary dividends: $1,870 (reported on 3.7% of returns)
Here:
$1,870
State:
$8,996
(% of AGI for various income ranges: 2.4% for AGIs below $25k, 1.4% for AGIs $25k-50k, 18.6% for AGIs $50k-75k, 36.5% for AGIs $75k-100k, 140.6% for AGIs $100k-200k)
Net capital gain/loss in AGI: +$2,950 (reported on 2.7% of returns)
Here:
+$2,950
State:
+$28,402
(% of AGI for various income ranges: 0.5% for AGIs below $25k, 1.5% for AGIs $25k-50k, 7.3% for AGIs $50k-75k, 13.0% for AGIs $75k-100k, 299.4% for AGIs $100k-200k)
Taxable individual retirement arrangement distribution: $13,813 (reported on 4.2% of returns)
31217:
$13,813
Georgia:
$20,525
(% of AGI for various income ranges: 16.8% for AGIs below $25k, 46.4% for AGIs $25k-50k, 142.0% for AGIs $50k-75k, 302.2% for AGIs $75k-100k, 926.2% for AGIs $100k-200k)
Total itemized deductions: $24,733 (reported on 5.7% of returns)
Here:
$24,733
State:
$34,001
(% of AGI for various income ranges: 27.6% for AGIs below $25k, 150.6% for AGIs $25k-50k, 458.6% for AGIs $50k-75k, 920.9% for AGIs $75k-100k, 1441.9% for AGIs $100k-200k)
Charity contributions: $10,643 (reported on 5.0% of returns)
Here:
$10,643
State:
$14,164
(% of AGI for various income ranges: 8.0% for AGIs below $25k, 54.8% for AGIs $25k-50k, 179.8% for AGIs $50k-75k, 332.6% for AGIs $75k-100k, 626.2% for AGIs $100k-200k)
Taxes paid: $4,576 (reported on 5.6% of returns)
31217:
$4,576
State:
$7,540
(% of AGI for various income ranges: 3.3% for AGIs below $25k, 22.3% for AGIs $25k-50k, 90.2% for AGIs $50k-75k, 165.7% for AGIs $75k-100k, 327.5% for AGIs $100k-200k)
Earned income credit: $2,893 (reported on 39.0% of returns)
Here:
$2,893
State:
$2,530
(% of AGI for various income ranges: 192.5% for AGIs below $25k, 119.3% for AGIs $25k-50k)
Percentage of individuals using paid preparers for their 2020 taxes: 93.2%
Here:
93%
State:
93%
(% for various income ranges: 94.5% for AGIs below $25k, 92.8% for AGIs $25k-50k, 90.5% for AGIs $50k-75k, 90.9% for AGIs $75k-100k, 90.3% for AGIs $100k-200k)
Averages for the 2012 tax year for zip code 31217, filed in 2013:
Average Adjusted Gross Income (AGI) in 2012: $29,140 (Individual Income Tax Returns)
Here:
$29,140
State:
$56,131
Salary/wage: $26,632 (reported on 85.1% of returns)
Here:
$26,632
State:
$47,942
(% of AGI for various income ranges: 79.9% for AGIs below $25k, 83.6% for AGIs $25k-50k, 75.8% for AGIs $50k-75k, 73.2% for AGIs $75k-100k, 65.6% for AGIs $100k-200k)
Taxable interest for individuals: $503 (reported on 11.9% of returns)
This zip code:
$503
Georgia:
$1,706
(% of AGI for various income ranges: 0.2% for AGIs below $25k, 0.2% for AGIs $25k-50k, 0.2% for AGIs $50k-75k, 0.1% for AGIs $75k-100k, 0.3% for AGIs $100k-200k)
Ordinary dividends: $1,787 (reported on 4.2% of returns)
Here:
$1,787
State:
$7,265
(% of AGI for various income ranges: 0.2% for AGIs below $25k, 0.1% for AGIs $25k-50k, 0.6% for AGIs $50k-75k, 0.2% for AGIs $75k-100k, 0.3% for AGIs $100k-200k)
Net capital gain/loss in AGI: +$6,762 (reported on 2.2% of returns)
Here:
+$6,762
State:
+$16,323
(% of AGI for various income ranges: 0.3% for AGIs $75k-100k, 4.0% for AGIs $100k-200k)
Profit/loss from business: +$3,652 (reported on 19.2% of returns)
Here:
+$3,652
State:
+$7,583
(% of AGI for various income ranges: 9.4% for AGIs below $25k, 1.1% for AGIs $75k-100k)
Taxable individual retirement arrangement distribution: $12,888 (reported on 4.3% of returns)
31217:
$12,888
Georgia:
$17,199
(% of AGI for various income ranges: 0.9% for AGIs below $25k, 1.3% for AGIs $25k-50k, 3.0% for AGIs $50k-75k, 2.3% for AGIs $75k-100k, 3.4% for AGIs $100k-200k)
Total itemized deductions: $17,633 (32% of AGI, reported on 21.6% of returns)
Here:
$17,633
State:
$23,886
Here:
31.9% of AGI
State:
21.5% of AGI
(% of AGI for various income ranges: 5.8% for AGIs below $25k, 13.8% for AGIs $25k-50k, 17.0% for AGIs $50k-75k, 17.2% for AGIs $75k-100k, 16.8% for AGIs $100k-200k)
Charity contributions: $4,774 (reported on 18.8% of returns)
Here:
$4,774
State:
$5,507
(% of AGI for various income ranges: 1.0% for AGIs below $25k, 2.9% for AGIs $25k-50k, 4.4% for AGIs $50k-75k, 4.5% for AGIs $75k-100k, 4.7% for AGIs $100k-200k)
Taxes paid: $3,915 (reported on 21.5% of returns)
31217:
$3,915
State:
$7,838
(% of AGI for various income ranges: 0.8% for AGIs below $25k, 2.5% for AGIs $25k-50k, 3.7% for AGIs $50k-75k, 4.9% for AGIs $75k-100k, 5.0% for AGIs $100k-200k)
Earned income credit: $2,812 (reported on 44.6% of returns)
Here:
$2,812
State:
$2,589
(% of AGI for various income ranges: 14.2% for AGIs below $25k, 1.9% for AGIs $25k-50k)
Percentage of individuals using paid preparers for their 2012 taxes: 51.9%
Here:
52%
State:
55%
(% for various income ranges: 51.2% for AGIs below $25k, 50.3% for AGIs $25k-50k, 56.8% for AGIs $50k-75k, 59.3% for AGIs $75k-100k, 55.6% for AGIs $100k-200k)
Averages for the 2004 tax year for zip code 31217, filed in 2005:
Average Adjusted Gross Income (AGI) in 2004: $27,404 (Individual Income Tax Returns)
Here:
$27,404
State:
$47,553
Salary/wage: $25,997 (reported on 89.6% of returns)
Here:
$25,997
State:
$42,178
(% of AGI for various income ranges: 87.1% for AGIs below $10k, 87.5% for AGIs $10k-25k, 86.7% for AGIs $25k-50k, 86.4% for AGIs $50k-75k, 85.4% for AGIs $75k-100k, 69.5% for AGIs over 100k)
Taxable interest for individuals: $684 (reported on 17.1% of returns)
This zip code:
$684
Georgia:
$1,772
(% of AGI for various income ranges: 1.1% for AGIs below $10k, 0.5% for AGIs $10k-25k, 0.4% for AGIs $25k-50k, 0.3% for AGIs $50k-75k, 0.2% for AGIs $75k-100k, 0.7% for AGIs over 100k)
Taxable dividends: $801 (reported on 5.8% of returns)
Here:
$801
State:
$4,283
(% of AGI for various income ranges: 0.3% for AGIs below $10k, 0.1% for AGIs $10k-25k, 0.1% for AGIs $25k-50k, 0.1% for AGIs $50k-75k, 0.1% for AGIs $75k-100k, 0.4% for AGIs over 100k)
Net capital gain/loss: +$4,040 (reported on 3.7% of returns)
Here:
+$4,040
State:
+$16,461
(% of AGI for various income ranges: -0.2% for AGIs below $10k, -0.1% for AGIs $10k-25k, 0.1% for AGIs $25k-50k, 0.1% for AGIs $50k-75k, 0.7% for AGIs $75k-100k, 4.4% for AGIs over 100k)
Profit/loss from business: +$3,868 (reported on 11.8% of returns)
Here:
+$3,868
State:
+$8,201
(% of AGI for various income ranges: 10.3% for AGIs below $10k, 2.3% for AGIs $10k-25k, 0.5% for AGIs $25k-50k, 0.3% for AGIs $50k-75k, -0.3% for AGIs $75k-100k, 5.1% for AGIs over 100k)
IRA payment deduction: $1,925 (reported on 0.7% of returns)
31217:
$1,925
Georgia:
$2,969
Total itemized deductions: $15,022 (28% of AGI, reported on 22.4% of returns)
Here:
$15,022
State:
$19,944
Here:
28.4% of AGI
State:
22.6% of AGI
(% of AGI for various income ranges: 2.9% for AGIs below $10k, 6.3% for AGIs $10k-25k, 14.0% for AGIs $25k-50k, 16.7% for AGIs $50k-75k, 14.8% for AGIs $75k-100k, 13.4% for AGIs over 100k)
Charity contributions deductions: $4,317 (8% of AGI, reported on 20.6% of returns)
Here:
$4,317
State:
$4,354
Here:
8.1% of AGI
State:
4.7% of AGI
(% of AGI for various income ranges: 0.3% for AGIs below $10k, 1.3% for AGIs $10k-25k, 3.4% for AGIs $25k-50k, 4.2% for AGIs $50k-75k, 4.6% for AGIs $75k-100k, 5.0% for AGIs over 100k)
Total tax: $3,289 (reported on 56.8% of returns)
31217:
$3,289
State:
$8,223
(% of AGI for various income ranges: 2.3% for AGIs below $10k, 2.4% for AGIs $10k-25k, 5.3% for AGIs $25k-50k, 8.1% for AGIs $50k-75k, 10.5% for AGIs $75k-100k, 17.0% for AGIs over 100k)
Earned income credit: $2,250 (reported on 41.3% of returns)
Here:
$2,250
State:
$1,986
Percentage of individuals using paid preparers for their 2004 taxes: 63.3%
Here:
63%
State:
62%
(% for various income ranges: 60.9% for AGIs below $10k, 65.3% for AGIs $10k-25k, 63.6% for AGIs $25k-50k, 59.6% for AGIs $50k-75k, 64.5% for AGIs $75k-100k, 59.7% for AGIs over 100k)
Likely homosexual households (counted as self-reported same-sex unmarried-partner households)
Lesbian couples: 0.0% of all households
Gay men: 0.1% of all households
Household received Food Stamps/SNAP in the past 12 months: 1,853 Household did not receive Food Stamps/SNAP in the past 12 months: 4,894
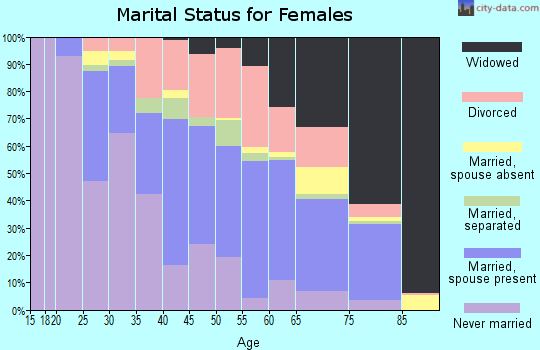
Women who had a birth in the past 12 months: 144 (62 now married, 81 unmarried) Women who did not have a birth in the past 12 months: 3,603 (1,054 now married, 2,552 unmarried)
Housing units in zip code 31217 with a mortgage: 1,974 (212 second mortgage, 20 home equity loan, 172 both second mortgage and home equity loan) Houses without a mortgage: 11
Median monthly owner costs for units with a mortgage: $1,081 Median monthly owner costs for units without a mortgage: $412
Residents with income below the poverty level in 2022:
This zip code:
27.3%
Whole state:
12.7%
Residents with income below 50% of the poverty level in 2022:
This zip code:
10.9%
Whole state:
6.3%
Median number of rooms in houses and condos:
Here:
6.0
State:
6.8
Median number of rooms in apartments:
Here:
5.0
State:
4.6
Notable locations in this zip code not listed on our city pages
Notable locations in zip code 31217: Bowden Golf Course (A), Macon - Bibb County Fire Department Station 1 (B), Macon - Bibb County Fire Department Station 101 (C), Macon - Bibb County Fire Department Station 9 (D), Pearson Volunteer Fire Department (E), Georgia Forestry Commission (F), Jones County Fire Department Station 1 (G). Display/hide their locations on the map
Churches in zip code 31217 include: Swift Creek Baptist Church (A), Chance Hill Church (B), Lanier Heights Church (C), Faith Church (D), Mountain Springs Church (E), Ocmulgee Church (F), Pitts Chapel (G), Gospel Mission (H), Saint Matthews Church (I). Display/hide their locations on the map
Cemeteries: Baker Cemetery (1), Ethridge - Minter Cemetery (2), Happoldt - Stevens Cemetery (3), James Cemetery (4), Mountain Springs Cemetery (5), Watson and Couch Cemetery (6), Kitchens Cemetery (7). Display/hide their locations on the map
Lakes, reservoirs, and swamps: Black Lake (A), Baker Lake (B), Ray Lake (C), Lake Arrowhead (D), Edwards Lake (E), Cauley Lake (F), Harrisons Lake (G), Sawyer Lake (H). Display/hide their locations on the map
Tourist attraction (not listed on the city page) : Georgia State Government - Housekeeping- Education Department Of- Georgia Academy for the B (Cultural Attractions- Events- & Facilities; 4156 Riggins Mill Road) (1). Display/hide its approximate location on the map
In group quarters: 360 (-1 institutionalized population)
Size of family households: 2,366 2-persons, 790 3-persons, 600 4-persons, 397 5-persons, 216 6-persons, 15 7-or-more-persons
Size of nonfamily households: 2,080 1-person, 150 2-persons, 30 3-persons
1,283 married couples with children.
1,796 single-parent households (277 men, 1,519 women).
97.8% of residents of 31217 zip code speak English at home.
0.9% of residents speak Spanish at home (28% very well, 47% well, 12% not well, 13% not at all).
0.1% of residents speak other Indo-European language at home (58% very well, 33% well, 8% not at all).
1.0% of residents speak Asian or Pacific Island language at home (92% very well, 2% well, 5% not well).
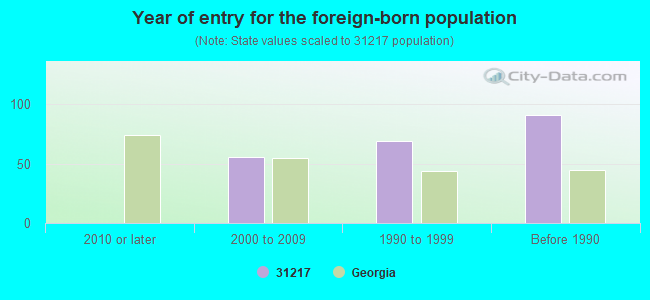
Foreign born population: 184 (1.1%) (54.1% of them are naturalized citizens)
Facilities with environmental interests located in this zip code:
BROWN & WILLIAMSON TOBACCO CORPORATION (2600 WEAVER ROAD in MACON, GA)
AIR MAJOR (AIRS/AFS) - ICIS-04-2005-1787, ENFORCEMENT/COMPLIANCE ACTIVITY STATE MASTER (Georgia's Geographic Environmental Information) - UST-3, UNDERGROUND STORAGE TANK PROGRAM, UST-8, UST-4, UST-7, UST-5, ENFORCEMENT/COMPLIANCE ACTIVITY (Integrated Compliance Information System) - ICIS-HQ-2001-3054, FORMAL ENFORCEMENT ACTION (Integrated Compliance Information System) - ICIS-HQ-2001-3054, FORMAL ENFORCEMENT ACTION CRITERIA AND HAZARDOUS AIR POLLUTANT INVENTORY (Inventory of air pollution sources) AIR MAJOR ("Best Available" air pollution technologies tracking) HAZARDOUS WASTE BIENNIAL REPORTER (Resource Conservation and Recovery Act (tracking hazardous waste)) Large Quantity Generators, more that 1000 kg of hazardous waste/month (Resource Conservation and Recovery Act (tracking hazardous waste)) - notification TRI REPORTER (Tracking of toxic chemicals releasing facilities) Business SIC classification: CIGARETTES; SPECIAL WAREHOUSING AND STORAGE Business NAICS classification: CIGARETTE MANUFACTURING.; CIGARETTE MANUFACTURING. Organizations: RJ REYNOLDS TOBACCO COMPANY (CONTACT/OPERATOR)
, BROWN & WILLIAMSON TABACCO CORP (CONTACT/OWNER)
, RJ REYNOLDS TOBACCO COMPANY (CONTACT/OWNER)
, HARRIS SVC & EQUIP (INSTALLER)
Alternative names: R.J. REYNOLDS TOBACCO CO
ATLANTA GAS LIGHT MACON LNG PLANT (258 HENDERSON RD in MACON, GA)
AIR SYNTHETIC MINOR (AIRS/AFS) STATE MASTER (Georgia's Geographic Environmental Information) - UST-1, UNDERGROUND STORAGE TANK PROGRAM, UST-3, UST-2, CRITERIA AND HAZARDOUS AIR POLLUTANT INVENTORY (Inventory of air pollution sources) Small Quantity Generators, between 100 kg and 1000 kg of hazardous waste/month (Resource Conservation and Recovery Act (tracking hazardous waste)) - notification Business SIC classification: NATURAL GAS TRANSMISSION; NATURAL GAS DISTRIBUTION Organizations: ATLANTA GAS LIGHT CO (CONTACT/OWNER)
, SMITH EQUIPMENT COMPANY INC (INSTALLER)
Alternative names: ATLANTA GAS LIGHT CO
BROWN & WILLIAMSON TOBACCO (PO BOX 1056 in MACON, GA)
ENFORCEMENT/COMPLIANCE ACTIVITY (Integrated Compliance Information System) - ICIS-HQ-2001-3011, FORMAL ENFORCEMENT ACTION (Integrated Compliance Information System) - ICIS-HQ-2001-3011, FORMAL ENFORCEMENT ACTION
BERND ELEMENTARY SCHOOL (4160 OCMULGEE EAST BOULEVARD in MACON, GA)
(National Center for Education Statistics) - STATE ID-1054 Organizations: BIBB COUNTY (SCHOOL DISTRICT)
CLIFTON RIDGE MIDDLE SCHOOL (169 DUSTY LANE in MACON, GA)
(National Center for Education Statistics) - STATE ID-0101 Organizations: JONES COUNTY (SCHOOL DISTRICT)
MATTIE WELLS PRIMARY SCHOOL (101 MATTIE WELLS DRIVE in MACON, GA)
(National Center for Education Statistics) - STATE ID-0102 Organizations: JONES COUNTY (SCHOOL DISTRICT)
MARTIN MARIETTA AGGREGATES (137 PITTS CHAPEL ROAD in MACON, GA)
AIR SYNTHETIC MINOR (AIRS/AFS) Conditionally Exempt Small Quantity Generators, less than 100 kg/month of hazardous waste (Resource Conservation and Recovery Act (tracking hazardous waste)) - notification Business SIC classification: CRUSHED AND BROKEN GRANITE Business NAICS classification: CUT STONE AND STONE PRODUCT MANUFACTURING. Organizations: OPERNAME (CONTACT/OPERATOR)
Alternative names: MARTIN MARIETTA AGGREGATES RUBY QUARRY, MARTIN MARIETTA RUBY QUARRY
Conditionally Exempt Small Quantity Generators, less than 100 kg/month of hazardous waste (Resource Conservation and Recovery Act (tracking hazardous waste)) USED OIL PROGRAM (Resource Conservation and Recovery Act (tracking hazardous waste)) Business NAICS classification: GENERAL AUTOMOTIVE REPAIR.
PHILLIP WADFORD (2322 GRISWOLDVILLE ROAD in MACON, GA)
(Resource Conservation and Recovery Act (tracking hazardous waste))
MACON WIRE CO (2919 JOYCLIFF RD in MACON, GA)
Conditionally Exempt Small Quantity Generators, less than 100 kg/month of hazardous waste (Resource Conservation and Recovery Act (tracking hazardous waste)) - notification Organizations: SWECO DIV OF EMERSON ELECTRIC (CONTACT/OWNER)
APAC GEORGIA, INC. (HWY 49 & PITTS RD in MACON, GA)
AIR SYNTHETIC MINOR (AIRS/AFS) Business SIC classification: ASPHALT PAVING MIXTURES AND BLOCKS Alternative names: APAC-GEORGIA SOUTHERN ROADBUILDERS
ARBOR ESTATES MOBILE HOME PARK AREA (HAWKINSVILLE ROAD in MACON, GA)
SUPERFUND (Superfund database) Alternative names: AVONDALE MOBILE HOME PARK
REEVES CONSTRUCTION CO. (LITE-N-TIE RD in MACON, GA)
AIR SYNTHETIC MINOR (AIRS/AFS) Business SIC classification: ASPHALT PAVING MIXTURES AND BLOCKS
Housing units lacking complete plumbing facilities: 6.2% Housing units lacking complete kitchen facilities: 6.0%
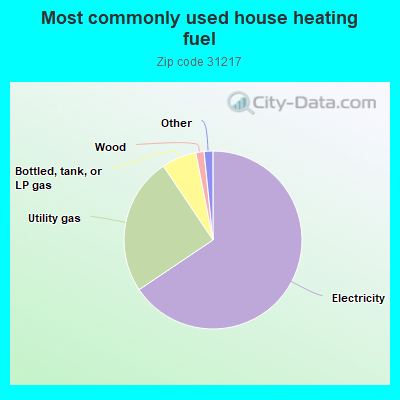
65.6%Electricity
25.0%Utility gas
6.3%Bottled, tank, or LP gas
1.5%Wood
0.7%No fuel used
0.6%Other fuel
Place of birth for U.S.-born residents:
This state: 14,665
Northeast: 417
Midwest: 437
South: 1,173
West: 112
64% of the 31217 zip code residents lived in the same house 5 years ago. Out of people who lived in different houses, 63% lived in this county. Out of people who lived in different counties, 50% lived in Georgia.
93% of the 31217 zip code residents lived in the same house 1 year ago. Out of people who lived in different houses, 42% moved from this county. Out of people who lived in different houses, 43% moved from different county within same state. Out of people who lived in different houses, 15% moved from different state.
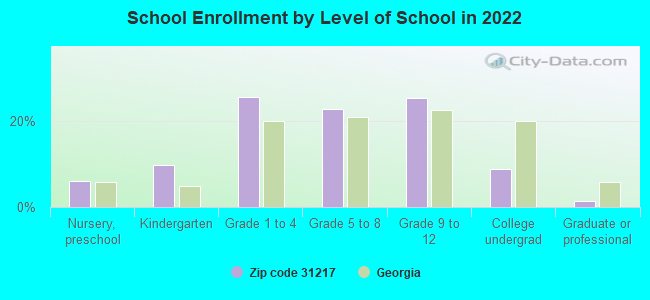
Private vs. public school enrollment:
Students in private schools in grades 1 to 8 (elementary and middle school): 166
Here:
9.0%
Georgia:
12.1%
Students in private schools in grades 9 to 12 (high school): 103
Here:
10.7%
Georgia:
10.8%
Students in private undergraduate colleges: 13
Here:
3.9%
Georgia:
17.1%
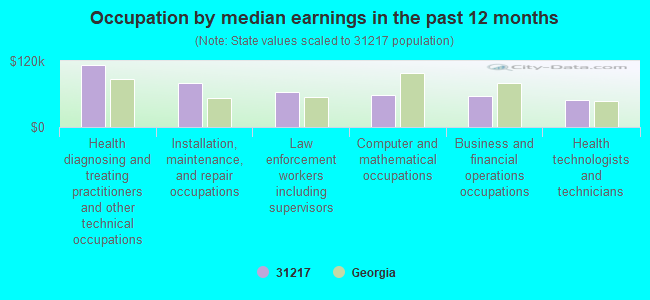
Occupation by median earnings in the past 12 months ($)
113,435Health diagnosing and treating practitioners and other technical occupations
79,556Installation, maintenance, and repair occupations
63,081Law enforcement workers including supervisors
58,587Computer and mathematical occupations
56,888Business and financial operations occupations
49,073Health technologists and technicians
Companies with federal contracts located in this zip code (MACON, GA):
BIBB SUPPLY CO INC (2909 LANIER HEIGHTS RD; small business) : $45,526 in 2 contractsfrom 2004 to 2005
$30,526 with Air Force for Aircraft Maintenance and Repair Shop Specialized Equipment. Signed on 2004-12-17. Completion date: 2005-03-11.
$15,000 with Air Force for Miscellaneous Maintenance and Repair Shop Specialized Equipment. Signed on 2005-01-31. Completion date: 2005-04-22.
NASWORTHY MECHANICAL INC (151 HENDERSON RD; small business)
$25,238 with Air Force for Maintenance, Repair and Rebuilding of Equipment -- Miscellaneous. Signed on 2002-09-30. Completion date: 2002-09-30.
HYDRO-BLAST INDUSTRIAL SERVICE (564 INDUSTRIAL WAY E; small business) : $21,725 in 2 contractsin 2005
$12,825 with Army for Maintenance, Repair and Rebuilding of Equipment -- Vehicular Equipment Components. Taking place in AL. Signed on 2005-01-12. Completion date: 2005-01-28.
$8,900 with Air Force for Maintenance, Repair and Rebuilding of Equipment -- Miscellaneous. Signed on 2005-09-28. Completion date: 2005-10-31.
ELLIOTT MACHINE SHOP, INC (5495 LEVEL ACRES DRIVE; small business)
$20,000 with Navy for Bolts. Signed on 2004-06-07. Completion date: 2004-05-28.
CARTER MECHANICAL INC (4115 RIGGINS MILL RD; small business)
$8,753 with Air Force for Maintenance, Repair or Alteration of Real Property -- Maintenance Buildings. Signed on 2005-01-20. Completion date: 2005-02-21.
Top industries in this zip code by the number of employees in 2005:
Health Care and Social Assistance: General Medical and Surgical Hospitals (over 1000 employees: 1 establishment, 100-249 employees: 1 establishment)
Health Care and Social Assistance: Offices of Physicians (except Mental Health Specialists) (20-49: 5, 10-19: 5, 5-9: 12, 1-4: 14)
Health Care and Social Assistance: Nursing Care Facilities (100-249: 1, 50-99: 2)
Mining: Kaolin and Ball Clay Mining (100-249: 1)
Health Care and Social Assistance: Residential Mental Health and Substance Abuse Facilities (100-249: 1)
Other Services (except Public Administration): Linen Supply (100-249: 1)
2002 - 2018 National Fire Incident Reporting System (NFIRS) incidents
Based on the data from the years 2002 - 2018 the average number of fires per year is 65. The highest number of fires - 139 took place in 2006, and the least - 6 in 2002. The data has a rising trend.
When looking into fire subcategories, the most reports belonged to: Outside Fires (45.7%), and Structure Fires (35.3%).
Fire incident types reported to NFIRS in Zip Code 31217


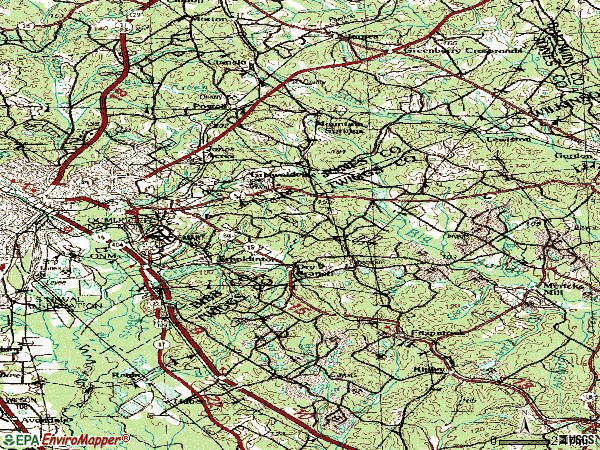
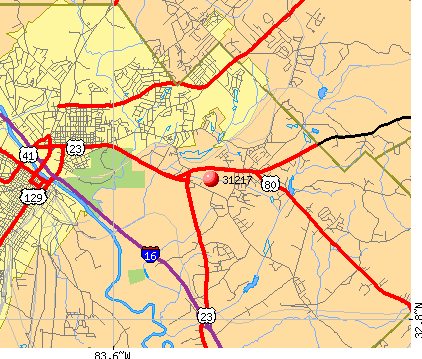 Nearest zip codes: 31211, 31201, 31213, 31207, 31020, 31031.


 Based on the data from the years 2002 - 2018 the average number of fires per year is 65. The highest number of fires - 139 took place in 2006, and the least - 6 in 2002. The data has a rising trend.
 When looking into fire subcategories, the most reports belonged to: Outside Fires (45.7%), and Structure Fires (35.3%).