Estimated zip code population in 2022: 3,312 Zip code population in 2010: 2,979 Zip code population in 2000: 2,977
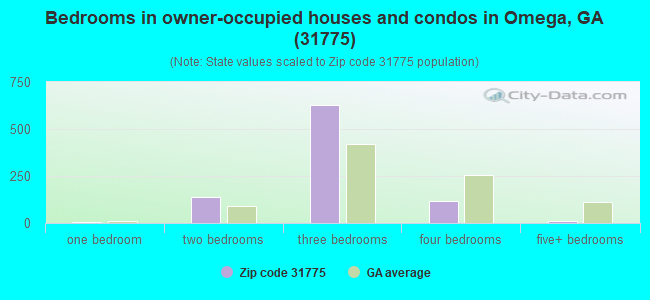
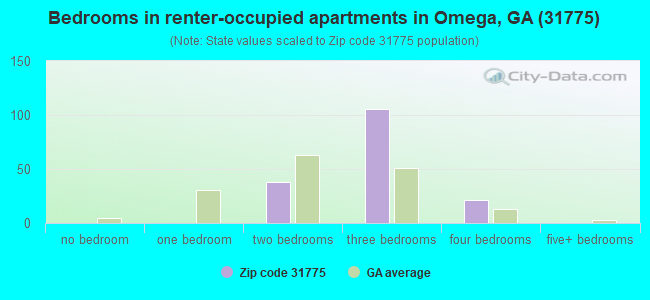
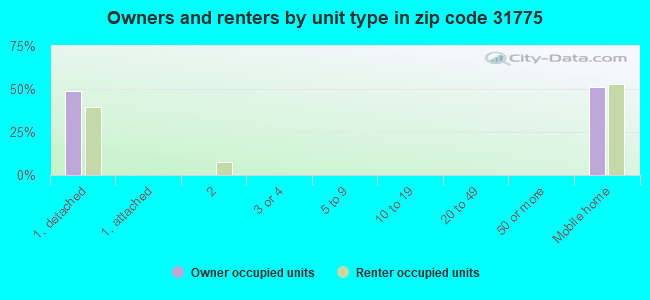
Houses and condos: 1,214 Renter-occupied apartments: 165
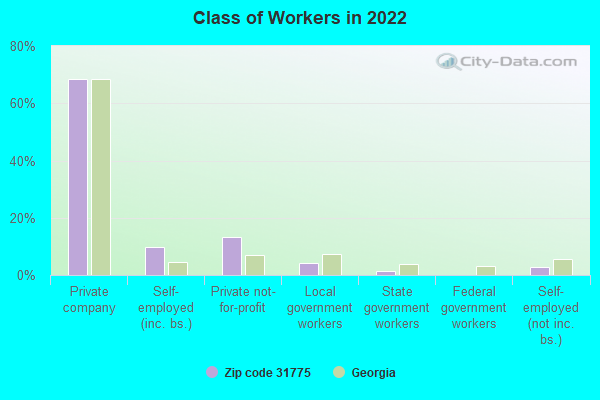
% of renters here:
15%
State:
34%
March 2022 cost of living index in zip code 31775: 78.7 (low, U.S. average is 100)
Land area: 45.4 sq. mi. Water area: 1.4 sq. mi.
Population density: 73 people per square mile
(very low).
OSM Map
General Map
Google Map
MSN Map
OSM Map
General Map
Google Map
MSN Map
OSM Map
General Map
Google Map
MSN Map
OSM Map
General Map
Google Map
MSN Map
Please wait while loading the map...
Real estate property taxes paid for housing units in 2022:
This zip code:
0.7% ($616)
Georgia:
0.7% ($2,160)
Median real estate property taxes paid for housing units with mortgages in 2022: $1,212 (1.0%) Median real estate property taxes paid for housing units with no mortgage in 2022: $451 (0.8%)
Business Search- 14 Million verified businesses
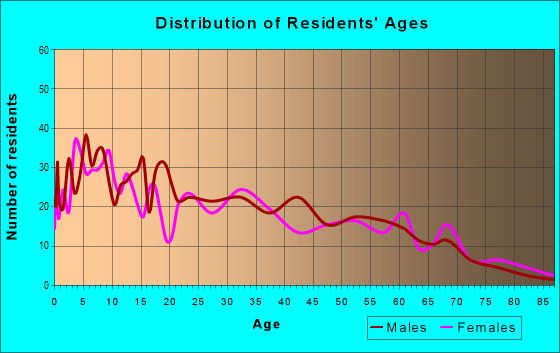
Males: 1,606
(48.5%)
Females: 1,705
(51.5%)
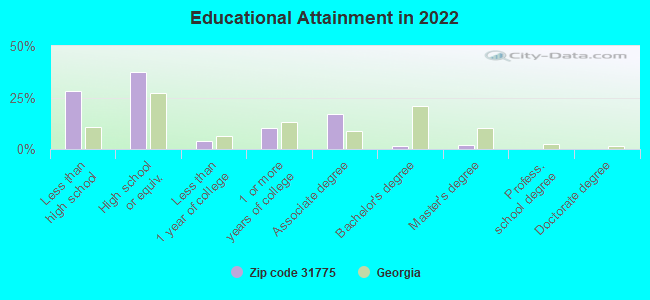
For population 25 years and over in 31775:
High school or higher: 69.0%
Bachelor's degree or higher: 3.5%
Graduate or professional degree: 2.1%
Unemployed: 2.4%
Mean travel time to work (commute): 28.8 minutes
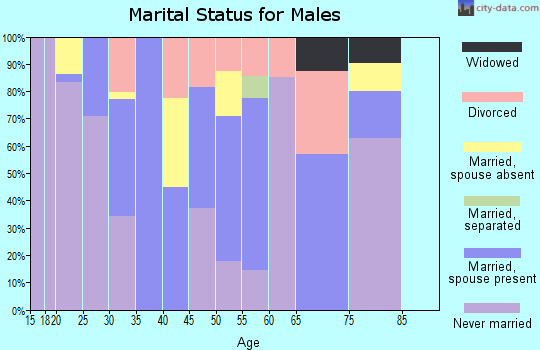
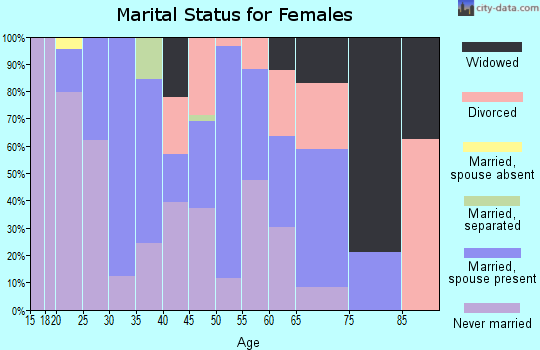
For population 15 years and over in 31775:
Never married: 25.6%
Now married: 60.9%
Separated: 1.0%
Widowed: 3.2%
Divorced: 9.3%
Zip code 31775 compared to state average:
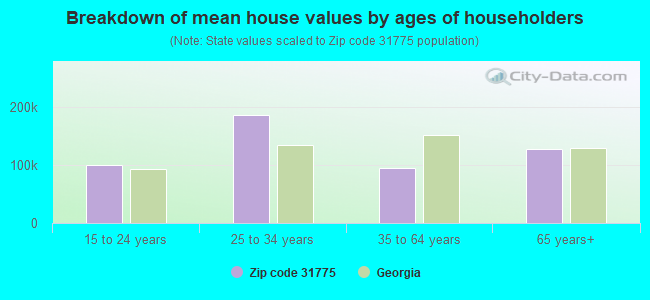
Median house value significantly below state average.
Unemployed percentage below state average.
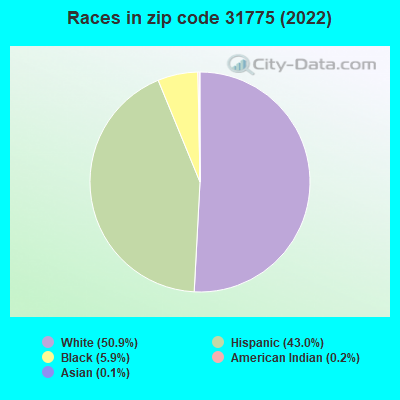
Black race population percentage significantly below state average.
Hispanic race population percentage significantly above state average.
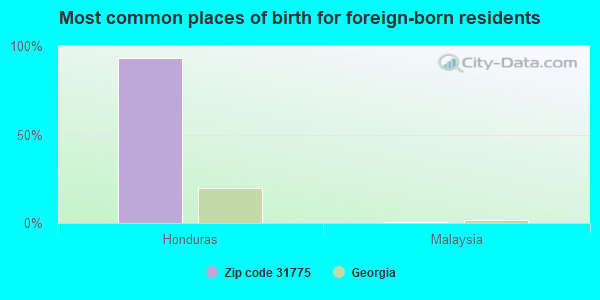
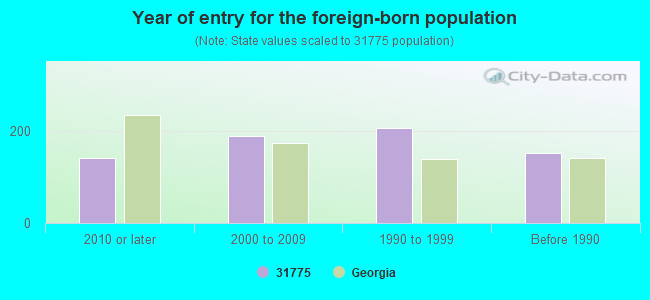
Foreign-born population percentage above state average.
Renting percentage below state average.
Length of stay since moving in significantly above state average.
Number of college students significantly below state average.
Percentage of population with a bachelor's degree or higher significantly below state average.
Estimated median house/condo value in 2022: $89,014
31775:
$89,014
Georgia:
$297,400
According to our research of Georgia and other state lists, there were 8 registered sex offenders living in 31775 zip code as of April 26, 2024. The ratio of all residents to sex offenders in zip code 31775 is 397 to 1. The ratio of registered sex offenders to all residents in this zip code is near the state average.
Median resident age:
This zip code:
39.0 years
Georgia median age:
37.6 years
Average household size:
This zip code:
3.0 people
Georgia:
2.6 people
Averages for the 2020 tax year for zip code 31775, filed in 2021:
Average Adjusted Gross Income (AGI) in 2020: $44,929 (Individual Income Tax Returns)
Here:
$44,929
State:
$70,847
Salary/wage: $37,112 (reported on 85.2% of returns)
Here:
$37,112
State:
$59,126
(% of AGI for various income ranges: 1430.0% for AGIs below $25k, 3838.6% for AGIs $25k-50k, 7393.3% for AGIs $50k-75k, 9463.3% for AGIs $75k-100k, 26186.7% for AGIs $100k-200k)
Taxable interest for individuals: $1,393 (reported on 13.0% of returns)
This zip code:
$1,393
Georgia:
$2,011
(% of AGI for various income ranges: 0.5% for AGIs below $25k, 7.5% for AGIs $25k-50k, 120.0% for AGIs $75k-100k, 380.0% for AGIs $100k-200k)
Ordinary dividends: $5,088 (reported on 7.0% of returns)
Here:
$5,088
State:
$8,996
(% of AGI for various income ranges: 34.6% for AGIs $25k-50k, 1033.3% for AGIs $100k-200k)
Net capital gain/loss in AGI: +$30,333 (reported on 5.2% of returns)
Here:
+$30,333
State:
+$28,402
(% of AGI for various income ranges: 48.2% for AGIs $25k-50k, 5616.7% for AGIs $100k-200k)
Profit/loss from business: +$3,652 (reported on 20.0% of returns)
Here:
+$3,652
State:
+$6,707
(% of AGI for various income ranges: 102.4% for AGIs below $25k, 110.0% for AGIs $25k-50k, 238.3% for AGIs $75k-100k)
Taxable individual retirement arrangement distribution: $9,500 (reported on 3.5% of returns)
31775:
$9,500
Georgia:
$20,525
(% of AGI for various income ranges: 54.5% for AGIs below $25k, 192.2% for AGIs $50k-75k)
Total itemized deductions: $31,383 (reported on 5.2% of returns)
Here:
$31,383
State:
$34,001
(% of AGI for various income ranges: 306.1% for AGIs $25k-50k, 3420.0% for AGIs $100k-200k)
Charity contributions: $19,440 (reported on 4.3% of returns)
Here:
$19,440
State:
$14,164
(% of AGI for various income ranges: 97.5% for AGIs $25k-50k, 2330.0% for AGIs $100k-200k)
Taxes paid: $5,133 (reported on 5.2% of returns)
31775:
$5,133
State:
$7,540
(% of AGI for various income ranges: 40.7% for AGIs $25k-50k, 646.7% for AGIs $100k-200k)
Earned income credit: $3,046 (reported on 35.7% of returns)
Here:
$3,046
State:
$2,530
(% of AGI for various income ranges: 214.7% for AGIs below $25k, 154.6% for AGIs $25k-50k)
Percentage of individuals using paid preparers for their 2020 taxes: 93.9%
Here:
94%
State:
93%
(% for various income ranges: 92.2% for AGIs below $25k, 94.3% for AGIs $25k-50k, 91.7% for AGIs $50k-75k, 100.0% for AGIs $75k-100k, 100.0% for AGIs $100k-200k)
Averages for the 2012 tax year for zip code 31775, filed in 2013:
Average Adjusted Gross Income (AGI) in 2012: $33,960 (Individual Income Tax Returns)
Here:
$33,960
State:
$56,131
Salary/wage: $27,943 (reported on 87.7% of returns)
Here:
$27,943
State:
$47,942
(% of AGI for various income ranges: 82.8% for AGIs below $25k, 87.7% for AGIs $25k-50k, 80.0% for AGIs $50k-75k, 75.4% for AGIs $75k-100k, 35.4% for AGIs $100k-200k)
Taxable interest for individuals: $953 (reported on 14.9% of returns)
This zip code:
$953
Georgia:
$1,706
(% of AGI for various income ranges: 0.2% for AGIs below $25k, 0.2% for AGIs $25k-50k, 0.3% for AGIs $50k-75k, 0.4% for AGIs $75k-100k, 1.0% for AGIs $100k-200k)
Ordinary dividends: $5,438 (reported on 7.0% of returns)
Here:
$5,438
State:
$7,265
(% of AGI for various income ranges: 0.5% for AGIs $25k-50k, 0.5% for AGIs $50k-75k, 4.1% for AGIs $100k-200k)
Net capital gain/loss in AGI: +$4,833 (reported on 5.3% of returns)
Here:
+$4,833
State:
+$16,323
Profit/loss from business: +$5,318 (reported on 14.9% of returns)
Here:
+$5,318
State:
+$7,583
(% of AGI for various income ranges: 8.0% for AGIs below $25k, 1.4% for AGIs $25k-50k, 0.8% for AGIs $50k-75k)
Taxable individual retirement arrangement distribution: $8,000 (reported on 3.5% of returns)
31775:
$8,000
Georgia:
$17,199
Total itemized deductions: $19,114 (26% of AGI, reported on 19.3% of returns)
Here:
$19,114
State:
$23,886
Here:
26.2% of AGI
State:
21.5% of AGI
(% of AGI for various income ranges: 6.3% for AGIs below $25k, 11.8% for AGIs $25k-50k, 11.4% for AGIs $50k-75k, 16.0% for AGIs $75k-100k, 11.3% for AGIs $100k-200k)
Charity contributions: $4,673 (reported on 13.2% of returns)
Here:
$4,673
State:
$5,507
(% of AGI for various income ranges: 1.1% for AGIs $25k-50k, 1.6% for AGIs $50k-75k, 5.3% for AGIs $75k-100k, 2.9% for AGIs $100k-200k)
Taxes paid: $4,050 (reported on 19.3% of returns)
31775:
$4,050
State:
$7,838
(% of AGI for various income ranges: 0.4% for AGIs below $25k, 1.3% for AGIs $25k-50k, 2.3% for AGIs $50k-75k, 4.5% for AGIs $75k-100k, 4.3% for AGIs $100k-200k)
Earned income credit: $2,808 (reported on 43.0% of returns)
Here:
$2,808
State:
$2,589
(% of AGI for various income ranges: 12.3% for AGIs below $25k, 2.8% for AGIs $25k-50k)
Percentage of individuals using paid preparers for their 2012 taxes: 70.2%
Here:
70%
State:
55%
(% for various income ranges: 71.9% for AGIs below $25k, 66.7% for AGIs $25k-50k, 63.6% for AGIs $50k-75k, 60.0% for AGIs $75k-100k, 100.0% for AGIs $100k-200k)
Averages for the 2004 tax year for zip code 31775, filed in 2005:
Average Adjusted Gross Income (AGI) in 2004: $27,879 (Individual Income Tax Returns)
Here:
$27,879
State:
$47,553
Salary/wage: $25,907 (reported on 86.8% of returns)
Here:
$25,907
State:
$42,178
(% of AGI for various income ranges: 89.5% for AGIs $10k-25k, 87.4% for AGIs $25k-50k, 79.8% for AGIs $50k-75k, 70.0% for AGIs $75k-100k, 37.6% for AGIs over 100k)
Taxable interest for individuals: $2,729 (reported on 19.3% of returns)
This zip code:
$2,729
Georgia:
$1,772
(% of AGI for various income ranges: 1.1% for AGIs $10k-25k, 0.5% for AGIs $25k-50k, 0.6% for AGIs $50k-75k, 0.9% for AGIs $75k-100k, 5.2% for AGIs over 100k)
Taxable dividends: $8,807 (reported on 10.3% of returns)
Here:
$8,807
State:
$4,283
(% of AGI for various income ranges: 0.2% for AGIs $10k-25k, 0.4% for AGIs $25k-50k, 2.1% for AGIs $50k-75k, 11.3% for AGIs over 100k)
Net capital gain/loss: +$3,190 (reported on 7.6% of returns)
Here:
+$3,190
State:
+$16,461
(% of AGI for various income ranges: -0.1% for AGIs $10k-25k, 0.0% for AGIs $25k-50k, 0.0% for AGIs $50k-75k, 4.2% for AGIs over 100k)
Profit/loss from business: +$6,361 (reported on 15.0% of returns)
Here:
+$6,361
State:
+$8,201
(% of AGI for various income ranges: 3.4% for AGIs $10k-25k, 2.0% for AGIs $25k-50k, 6.8% for AGIs $50k-75k)
IRA payment deduction: $4,867 (reported on 1.4% of returns)
31775:
$4,867
Georgia:
$2,969
Total itemized deductions: $17,158 (23% of AGI, reported on 16.5% of returns)
Here:
$17,158
State:
$19,944
Here:
22.8% of AGI
State:
22.6% of AGI
(% of AGI for various income ranges: 5.1% for AGIs $10k-25k, 8.4% for AGIs $25k-50k, 11.2% for AGIs $50k-75k, 14.9% for AGIs $75k-100k, 13.6% for AGIs over 100k)
Charity contributions deductions: $5,544 (7% of AGI, reported on 14.4% of returns)
Here:
$5,544
State:
$4,354
Here:
7.2% of AGI
State:
4.7% of AGI
(% of AGI for various income ranges: 1.0% for AGIs $10k-25k, 1.9% for AGIs $25k-50k, 2.3% for AGIs $50k-75k, 4.2% for AGIs $75k-100k, 5.7% for AGIs over 100k)
Total tax: $4,845 (reported on 52.9% of returns)
31775:
$4,845
State:
$8,223
(% of AGI for various income ranges: 2.3% for AGIs $10k-25k, 4.7% for AGIs $25k-50k, 8.2% for AGIs $50k-75k, 12.1% for AGIs $75k-100k, 19.9% for AGIs over 100k)
Earned income credit: $2,180 (reported on 42.0% of returns)
Here:
$2,180
State:
$1,986
Percentage of individuals using paid preparers for their 2004 taxes: 80.7%
Here:
81%
State:
62%
(% for various income ranges: 78.8% for AGIs below $10k, 85.1% for AGIs $10k-25k, 82.3% for AGIs $25k-50k, 64.5% for AGIs $50k-75k, 67.7% for AGIs $75k-100k, 96.9% for AGIs over 100k)
Household received Food Stamps/SNAP in the past 12 months: 194 Household did not receive Food Stamps/SNAP in the past 12 months: 878
Women who had a birth in the past 12 months: 27 (25 now married, 1 unmarried) Women who did not have a birth in the past 12 months: 682 (372 now married, 308 unmarried)
Housing units in zip code 31775 with a mortgage: 338 Houses without a mortgage: 1
Median monthly owner costs for units with a mortgage: $887 Median monthly owner costs for units without a mortgage: $347
Residents with income below the poverty level in 2022:
This zip code:
29.0%
Whole state:
12.7%
Residents with income below 50% of the poverty level in 2022:
This zip code:
20.2%
Whole state:
6.3%
Median number of rooms in houses and condos:
Here:
6.6
State:
6.8
Median number of rooms in apartments:
Here:
6.6
State:
4.6
Notable locations in this zip code not listed on our city pages
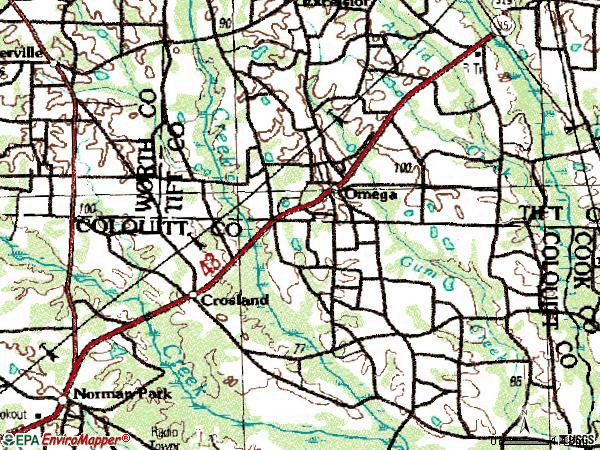
Notable locations in zip code 31775: Colquitt County Volunteer Firefighters Association Station 22 Livingston Bridge (A), Omega Volunteer Fire Department (B). Display/hide their locations on the map
Churches in zip code 31775 include: Bethel Church (A), Leila Church (B), Rocky Creek Church (C), Saint Pauls Church (D), Antioch Church (E). Display/hide their locations on the map
Streams, rivers, and creeks: Ty Ty Creek (A), Tucker Branch (B), Sapp Creek (C), Gator Branch (D), Arnold Creek (E). Display/hide their locations on the map
In group quarters: 113 (-1 institutionalized population)
Size of family households: 420 2-persons, 153 3-persons, 100 4-persons, 132 5-persons, 37 6-persons, 35 7-or-more-persons
Size of nonfamily households: 183 1-person, 6 2-persons
544 married couples with children.
223 single-parent households (23 men, 200 women).
60.7% of residents of 31775 zip code speak English at home.
39.7% of residents speak Spanish at home (55% very well, 3% well, 18% not well, 24% not at all).
0.2% of residents speak other Indo-European language at home (100% very well).
0.1% of residents speak other language at home (100% not at all).
Foreign born population: 692 (20.9%) (33.2% of them are naturalized citizens)
This zip code:
20.9%
Whole state:
10.7%
93%Honduras
0%Malaysia
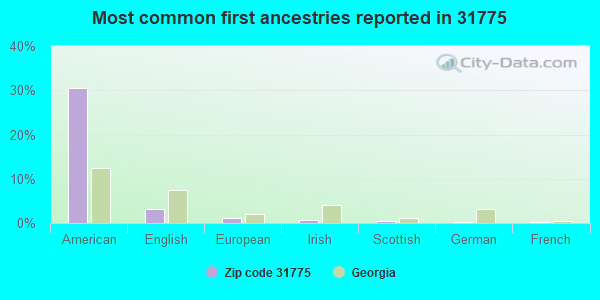
31%American
3%English
1%European
1%Irish
0%Scottish
0%German
0%French
Year of entry for the foreign-born population
1422010 or later
1892000 to 2009
2071990 to 1999
153Before 1990
Facilities with environmental interests located in this zip code:
OMEGA ELEMENTARY SCHOOL (150 COLLEGE AVENUE in OMEGA, GA)
(Geographic Names Information System) (National Center for Education Statistics) - STATE ID-4050 Organizations: TIFT COUNTY (SCHOOL DISTRICT)
502 GRASS FARM ROAD ( in OMEGA, GA)
National Pollutant Discharge Elimination System NON-MAJOR (Tracking pollutant discharge elimination systems) - permit Business SIC classification: SEWERAGE SYSTEMS Organizations: CITY OF OMEGA (CONTACT/OWNER)
Alternative names: OMEGA, CITY OF, OMEGA (LAS)
OMEGA FARM SERVICES (121 S CEDAR ST in OMEGA, GA)
AIR MINOR (AIRS/AFS) Business SIC classification: COTTON GINNING
QUALITY GROWERS GIN AND PEANUT LLC (1522 TYTY OMEGA ROAD in OMEGA, GA)
AIR MINOR (AIRS/AFS) Business SIC classification: COTTON GINNING Alternative names: COASTAL PLAINS GIN CO
AIR MINOR (AIRS/AFS) Business SIC classification: COTTON GINNING
OMEGA FARM SUPPLY INC (GEORGIA AVENUE in OMEGA, GA)
COMPLIANCE ACTIVITY (Tracking inspections of insecticide, fungicide, and rodenticide, and toxic substances)
COLQUITT EMC-BRYANT S (TYTY-OMEGA RD in OMEGA, GA)
AIR SYNTHETIC MINOR (AIRS/AFS) Business SIC classification: ELECTRIC SERVICES Alternative names: COLQUITT EMC-BRYANT STATION
KML SOUTHSTAR (1388 CS POWELL ROAD in OMEGA, GA)
COMPLIANCE ACTIVITY (Tracking inspections of insecticide, fungicide, and rodenticide, and toxic substances)
Housing units lacking complete plumbing facilities: 6.2% Housing units lacking complete kitchen facilities: 3.7%
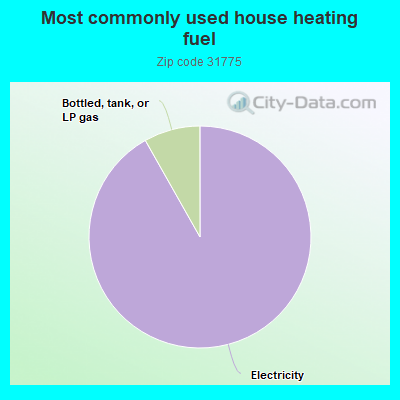
91.9%Electricity
8.2%Bottled, tank, or LP gas
Population in 1990: 2,154. Population change in the 1990s: +823 (+38.2%).
Place of birth for U.S.-born residents:
This state: 2,293
Northeast: 8
Midwest: 47
South: 238
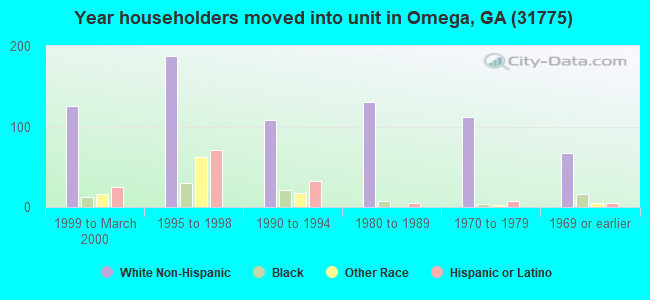
60% of the 31775 zip code residents lived in the same house 5 years ago. Out of people who lived in different houses, 45% lived in this county. Out of people who lived in different counties, 50% lived in Georgia.
96% of the 31775 zip code residents lived in the same house 1 year ago. Out of people who lived in different houses, 47% moved from this county. Out of people who lived in different houses, 54% moved from different county within same state.
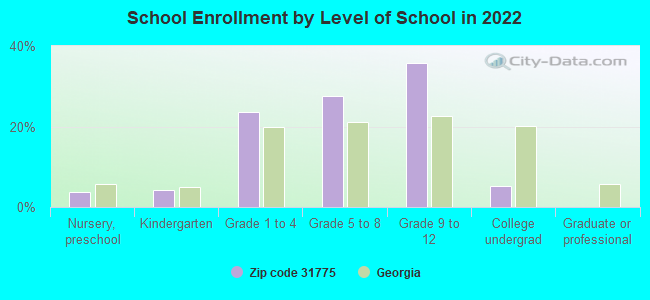
Private vs. public school enrollment:
Students in private schools in grades 1 to 8 (elementary and middle school):
Here:
0.0%
Georgia:
12.1%
Students in private schools in grades 9 to 12 (high school): 10
Here:
3.3%
Georgia:
10.8%
Students in private undergraduate colleges: 2
Here:
6.4%
Georgia:
17.1%
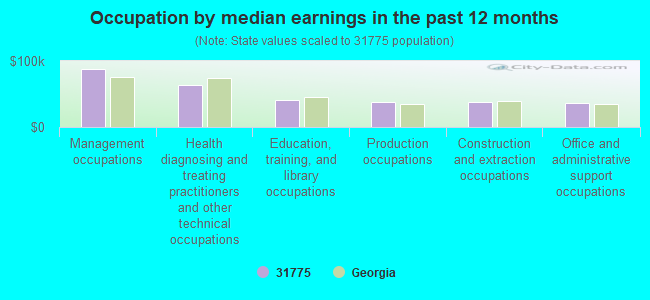
Occupation by median earnings in the past 12 months ($)
88,370Management occupations
63,041Health diagnosing and treating practitioners and other technical occupations
41,311Education, training, and library occupations
37,826Production occupations
37,122Construction and extraction occupations
36,547Office and administrative support occupations
Top industries in this zip code by the number of employees in 2005:
Finance and Insurance: Commercial Banking (10-19: 1)
Construction: Electrical Contractors (5-9: 1)
Construction: Structural Steel and Precast Concrete Contractors (5-9: 1)
Construction: New Single-Family Housing Construction (except Operative Builders) (1-4: 2)
People in group quarters in 2010:
97 people in workers' group living quarters and job corps centers
People in group quarters in 2000:
120 people in college dormitories (includes college quarters off campus)
82 people in agriculture workers' dormitories on farms
Fatal accident statistics in 2011:
Fatal accident count: 1
Vehicles involved in fatal accidents: 1
Fatal accidents caused by drunken drivers: 1
Fatalities: 1
Persons involved in fatal accidents: 1
Pedestrians involved in fatal accidents: 0
Fatal accident statistics in 2010:
Fatal accident count: 1
Vehicles involved in fatal accidents: 1
Fatal accidents caused by drunken drivers: 1
Fatalities: 1
Persons involved in fatal accidents: 1
Pedestrians involved in fatal accidents: 0
2003 - 2018 National Fire Incident Reporting System (NFIRS) incidents
Based on the data from the years 2003 - 2018 the average number of fires per year is 10. The highest number of reported fires - 28 took place in 2011, and the least - 1 in 2003. The data has a rising trend.
When looking into fire subcategories, the most reports belonged to: Outside Fires (63.1%), and Structure Fires (23.6%).
Fire incident types reported to NFIRS in Zip Code 31775


 Nearest zip codes: 31771, 31793, 31747, 31637, 31795, 31794.


 Based on the data from the years 2003 - 2018 the average number of fires per year is 10. The highest number of reported fires - 28 took place in 2011, and the least - 1 in 2003. The data has a rising trend.
 When looking into fire subcategories, the most reports belonged to: Outside Fires (63.1%), and Structure Fires (23.6%).