Estimated zip code population in 2022: 31,460 Zip code population in 2010: 27,918 Zip code population in 2000: 17,927
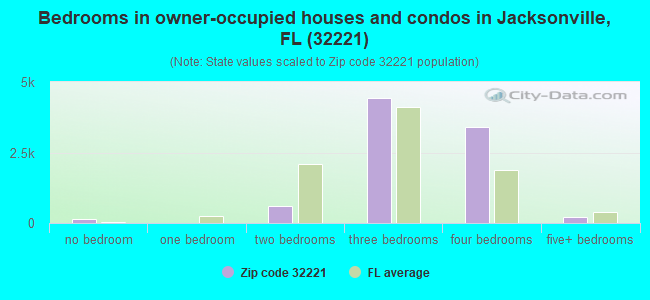
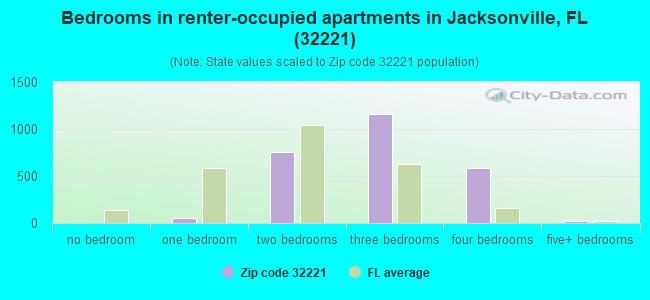
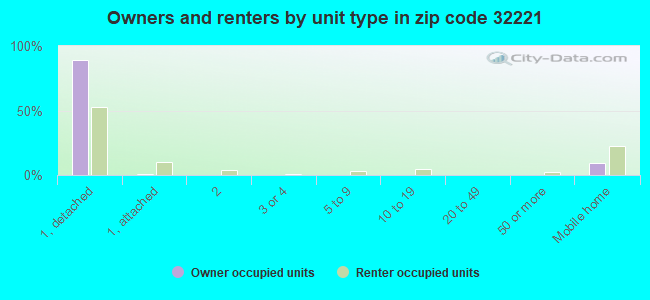
Houses and condos: 11,873 Renter-occupied apartments: 2,599
% of renters here:
23%
State:
33%
March 2022 cost of living index in zip code 32221: 88.6 (less than average, U.S. average is 100)
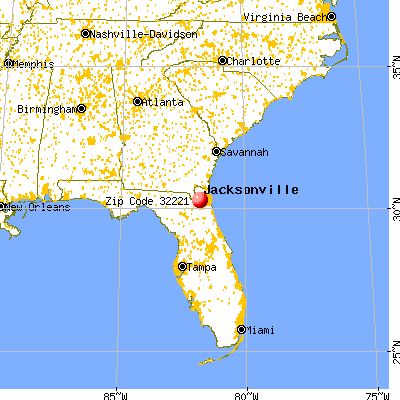
Land area: 35.9 sq. mi. Water area: 0.2 sq. mi.
Population density: 876 people per square mile
(low).
OSM Map
General Map
Google Map
MSN Map
OSM Map
General Map
Google Map
MSN Map
OSM Map
General Map
Google Map
MSN Map
OSM Map
General Map
Google Map
MSN Map
Please wait while loading the map...
Real estate property taxes paid for housing units in 2022:
This zip code:
0.7% ($1,941)
Florida:
0.7% ($2,529)
Median real estate property taxes paid for housing units with mortgages in 2022: $2,195 (0.8%) Median real estate property taxes paid for housing units with no mortgage in 2022: $1,487 (0.6%)
Estimated median house/condo value in 2022: $271,089
32221:
$271,089
Florida:
$354,100
According to our research of Florida and other state lists, there were 48 registered sex offenders living in 32221 zip code as of April 27, 2024. The ratio of all residents to sex offenders in zip code 32221 is 654 to 1. The ratio of registered sex offenders to all residents in this zip code is near the state average.
Median resident age:
This zip code:
39.4 years
Florida median age:
42.7 years
Average household size:
This zip code:
2.8 people
Florida:
2.5 people
Averages for the 2020 tax year for zip code 32221, filed in 2021:
Average Adjusted Gross Income (AGI) in 2020: $53,315 (Individual Income Tax Returns)
Here:
$53,315
State:
$82,200
Salary/wage: $48,449 (reported on 85.1% of returns)
Here:
$48,449
State:
$58,347
(% of AGI for various income ranges: 1243.0% for AGIs below $25k, 3788.6% for AGIs $25k-50k, 6627.6% for AGIs $50k-75k, 9712.0% for AGIs $75k-100k, 16621.0% for AGIs $100k-200k, 58718.6% for AGIs over 200k)
Taxable interest for individuals: $933 (reported on 22.0% of returns)
This zip code:
$933
Florida:
$4,272
(% of AGI for various income ranges: 9.4% for AGIs below $25k, 10.8% for AGIs $25k-50k, 27.2% for AGIs $50k-75k, 38.6% for AGIs $75k-100k, 67.3% for AGIs $100k-200k, 1050.0% for AGIs over 200k)
Ordinary dividends: $2,628 (reported on 9.2% of returns)
Here:
$2,628
State:
$15,863
(% of AGI for various income ranges: 7.5% for AGIs below $25k, 7.6% for AGIs $25k-50k, 25.4% for AGIs $50k-75k, 64.3% for AGIs $75k-100k, 110.1% for AGIs $100k-200k, 1144.3% for AGIs over 200k)
Net capital gain/loss in AGI: +$10,091 (reported on 7.6% of returns)
Here:
+$10,091
State:
+$62,983
(% of AGI for various income ranges: 2.9% for AGIs below $25k, 9.1% for AGIs $25k-50k, 45.4% for AGIs $50k-75k, 84.5% for AGIs $75k-100k, 343.6% for AGIs $100k-200k, 8137.1% for AGIs over 200k)
Profit/loss from business: +$3,616 (reported on 16.6% of returns)
Here:
+$3,616
State:
+$9,719
(% of AGI for various income ranges: 86.4% for AGIs below $25k, 56.0% for AGIs $25k-50k, 38.6% for AGIs $50k-75k, 120.8% for AGIs $75k-100k, 29.2% for AGIs $100k-200k, 2055.7% for AGIs over 200k)
Taxable individual retirement arrangement distribution: $15,386 (reported on 6.3% of returns)
32221:
$15,386
Florida:
$24,823
(% of AGI for various income ranges: 32.3% for AGIs below $25k, 51.4% for AGIs $25k-50k, 117.6% for AGIs $50k-75k, 256.8% for AGIs $75k-100k, 473.9% for AGIs $100k-200k, 2444.3% for AGIs over 200k)
Total itemized deductions: $29,557 (reported on 5.6% of returns)
Here:
$29,557
State:
$45,393
(% of AGI for various income ranges: 19.9% for AGIs below $25k, 96.4% for AGIs $25k-50k, 245.9% for AGIs $50k-75k, 457.9% for AGIs $75k-100k, 731.0% for AGIs $100k-200k, 5137.1% for AGIs over 200k)
Charity contributions: $13,507 (reported on 4.8% of returns)
Here:
$13,507
State:
$20,178
(% of AGI for various income ranges: 3.5% for AGIs below $25k, 21.0% for AGIs $25k-50k, 79.7% for AGIs $50k-75k, 160.8% for AGIs $75k-100k, 340.2% for AGIs $100k-200k, 3155.7% for AGIs over 200k)
Taxes paid: $4,821 (reported on 5.2% of returns)
32221:
$4,821
State:
$6,967
(% of AGI for various income ranges: 2.9% for AGIs below $25k, 15.0% for AGIs $25k-50k, 37.4% for AGIs $50k-75k, 70.0% for AGIs $75k-100k, 116.3% for AGIs $100k-200k, 732.9% for AGIs over 200k)
Earned income credit: $2,503 (reported on 20.9% of returns)
Here:
$2,503
State:
$2,306
(% of AGI for various income ranges: 127.3% for AGIs below $25k, 82.6% for AGIs $25k-50k, 1.3% for AGIs $50k-75k)
Percentage of individuals using paid preparers for their 2020 taxes: 93.0%
Here:
93%
State:
92%
(% for various income ranges: 92.7% for AGIs below $25k, 94.7% for AGIs $25k-50k, 92.2% for AGIs $50k-75k, 92.5% for AGIs $75k-100k, 91.3% for AGIs $100k-200k, 90.5% for AGIs over 200k)
Averages for the 2012 tax year for zip code 32221, filed in 2013:
Average Adjusted Gross Income (AGI) in 2012: $45,560 (Individual Income Tax Returns)
Here:
$45,560
State:
$60,316
Salary/wage: $42,223 (reported on 86.2% of returns)
Here:
$42,223
State:
$45,277
(% of AGI for various income ranges: 77.6% for AGIs below $25k, 85.1% for AGIs $25k-50k, 79.3% for AGIs $50k-75k, 80.5% for AGIs $75k-100k, 80.0% for AGIs $100k-200k, 59.2% for AGIs over 200k)
Taxable interest for individuals: $884 (reported on 26.5% of returns)
This zip code:
$884
Florida:
$3,587
(% of AGI for various income ranges: 0.6% for AGIs below $25k, 0.6% for AGIs $25k-50k, 0.5% for AGIs $50k-75k, 0.3% for AGIs $75k-100k, 0.5% for AGIs $100k-200k, 0.6% for AGIs over 200k)
Ordinary dividends: $2,338 (reported on 10.1% of returns)
Here:
$2,338
State:
$12,831
(% of AGI for various income ranges: 0.8% for AGIs below $25k, 0.3% for AGIs $25k-50k, 0.4% for AGIs $50k-75k, 0.4% for AGIs $75k-100k, 0.6% for AGIs $100k-200k, 1.0% for AGIs over 200k)
Net capital gain/loss in AGI: +$2,043 (reported on 6.5% of returns)
Here:
+$2,043
State:
+$33,493
(% of AGI for various income ranges: 0.2% for AGIs $50k-75k, 0.2% for AGIs $75k-100k, 0.6% for AGIs $100k-200k, 1.6% for AGIs over 200k)
Profit/loss from business: +$5,915 (reported on 13.5% of returns)
Here:
+$5,915
State:
+$10,012
(% of AGI for various income ranges: 8.7% for AGIs below $25k, 0.7% for AGIs $25k-50k, 1.0% for AGIs $50k-75k, 0.5% for AGIs $75k-100k, 1.3% for AGIs $100k-200k)
Taxable individual retirement arrangement distribution: $13,202 (reported on 7.2% of returns)
32221:
$13,202
Florida:
$21,544
(% of AGI for various income ranges: 2.2% for AGIs below $25k, 1.4% for AGIs $25k-50k, 2.0% for AGIs $50k-75k, 2.1% for AGIs $75k-100k, 3.0% for AGIs $100k-200k)
Total itemized deductions: $18,997 (25% of AGI, reported on 27.6% of returns)
Here:
$18,997
State:
$25,533
Here:
24.9% of AGI
State:
18.0% of AGI
(% of AGI for various income ranges: 6.3% for AGIs below $25k, 10.6% for AGIs $25k-50k, 12.0% for AGIs $50k-75k, 13.1% for AGIs $75k-100k, 12.9% for AGIs $100k-200k, 12.2% for AGIs over 200k)
Charity contributions: $5,485 (reported on 22.6% of returns)
Here:
$5,485
State:
$5,698
(% of AGI for various income ranges: 0.8% for AGIs below $25k, 1.9% for AGIs $25k-50k, 2.4% for AGIs $50k-75k, 3.3% for AGIs $75k-100k, 3.7% for AGIs $100k-200k, 5.3% for AGIs over 200k)
Taxes paid: $3,340 (reported on 26.9% of returns)
32221:
$3,340
State:
$6,203
(% of AGI for various income ranges: 1.0% for AGIs below $25k, 1.7% for AGIs $25k-50k, 2.0% for AGIs $50k-75k, 2.3% for AGIs $75k-100k, 2.4% for AGIs $100k-200k, 2.2% for AGIs over 200k)
Earned income credit: $2,447 (reported on 23.4% of returns)
Here:
$2,447
State:
$2,372
(% of AGI for various income ranges: 8.6% for AGIs below $25k, 1.5% for AGIs $25k-50k)
Percentage of individuals using paid preparers for their 2012 taxes: 42.9%
Here:
43%
State:
54%
(% for various income ranges: 41.2% for AGIs below $25k, 41.0% for AGIs $25k-50k, 44.2% for AGIs $50k-75k, 45.7% for AGIs $75k-100k, 48.2% for AGIs $100k-200k, 75.0% for AGIs over 200k)
Averages for the 2004 tax year for zip code 32221, filed in 2005:
Average Adjusted Gross Income (AGI) in 2004: $42,285 (Individual Income Tax Returns)
Here:
$42,285
State:
$50,523
Salary/wage: $39,314 (reported on 89.3% of returns)
Here:
$39,314
State:
$39,563
(% of AGI for various income ranges: 106.3% for AGIs below $10k, 81.9% for AGIs $10k-25k, 84.3% for AGIs $25k-50k, 87.6% for AGIs $50k-75k, 88.8% for AGIs $75k-100k, 69.8% for AGIs over 100k)
Taxable interest for individuals: $912 (reported on 38.1% of returns)
This zip code:
$912
Florida:
$3,211
(% of AGI for various income ranges: 2.4% for AGIs below $10k, 1.3% for AGIs $10k-25k, 0.8% for AGIs $25k-50k, 0.5% for AGIs $50k-75k, 0.8% for AGIs $75k-100k, 0.9% for AGIs over 100k)
Taxable dividends: $1,020 (reported on 12.8% of returns)
Here:
$1,020
State:
$6,129
(% of AGI for various income ranges: 1.1% for AGIs below $10k, 0.3% for AGIs $10k-25k, 0.3% for AGIs $25k-50k, 0.2% for AGIs $50k-75k, 0.2% for AGIs $75k-100k, 0.5% for AGIs over 100k)
Net capital gain/loss: +$4,092 (reported on 9.8% of returns)
Here:
+$4,092
State:
+$27,205
(% of AGI for various income ranges: -0.9% for AGIs below $10k, 0.2% for AGIs $10k-25k, 0.2% for AGIs $25k-50k, 0.3% for AGIs $50k-75k, 0.7% for AGIs $75k-100k, 3.2% for AGIs over 100k)
Profit/loss from business: +$6,337 (reported on 11.6% of returns)
Here:
+$6,337
State:
+$10,634
(% of AGI for various income ranges: 6.4% for AGIs below $10k, 3.6% for AGIs $10k-25k, 1.9% for AGIs $25k-50k, 0.9% for AGIs $50k-75k, 0.9% for AGIs $75k-100k, 2.0% for AGIs over 100k)
IRA payment deduction: $2,664 (reported on 2.0% of returns)
32221:
$2,664
Florida:
$3,082
(% of AGI for various income ranges: 0.1% for AGIs $10k-25k, 0.2% for AGIs $25k-50k, 0.1% for AGIs $50k-75k, 0.1% for AGIs $75k-100k, 0.1% for AGIs over 100k)
Total itemized deductions: $16,603 (24% of AGI, reported on 32.0% of returns)
Here:
$16,603
State:
$20,370
Here:
24.3% of AGI
State:
20.7% of AGI
(% of AGI for various income ranges: 6.8% for AGIs below $10k, 8.2% for AGIs $10k-25k, 12.2% for AGIs $25k-50k, 13.4% for AGIs $50k-75k, 14.2% for AGIs $75k-100k, 13.1% for AGIs over 100k)
Charity contributions deductions: $4,630 (6% of AGI, reported on 27.6% of returns)
Here:
$4,630
State:
$4,064
Here:
6.5% of AGI
State:
3.8% of AGI
(% of AGI for various income ranges: 0.7% for AGIs below $10k, 1.3% for AGIs $10k-25k, 2.4% for AGIs $25k-50k, 3.1% for AGIs $50k-75k, 3.6% for AGIs $75k-100k, 4.1% for AGIs over 100k)
Total tax: $5,294 (reported on 75.0% of returns)
32221:
$5,294
State:
$9,431
(% of AGI for various income ranges: 2.7% for AGIs below $10k, 3.9% for AGIs $10k-25k, 6.2% for AGIs $25k-50k, 8.2% for AGIs $50k-75k, 10.0% for AGIs $75k-100k, 17.0% for AGIs over 100k)
Earned income credit: $1,803 (reported on 17.3% of returns)
Here:
$1,803
State:
$1,808
Percentage of individuals using paid preparers for their 2004 taxes: 53.4%
Here:
53%
State:
60%
(% for various income ranges: 44.7% for AGIs below $10k, 57.2% for AGIs $10k-25k, 55.0% for AGIs $25k-50k, 53.3% for AGIs $50k-75k, 52.1% for AGIs $75k-100k, 56.7% for AGIs over 100k)
Likely homosexual households (counted as self-reported same-sex unmarried-partner households)
Lesbian couples: 0.0% of all households
Gay men: 0.2% of all households
Household received Food Stamps/SNAP in the past 12 months: 902 Household did not receive Food Stamps/SNAP in the past 12 months: 10,470
Women who had a birth in the past 12 months: 486 (386 now married, 108 unmarried) Women who did not have a birth in the past 12 months: 6,384 (2,943 now married, 3,442 unmarried)
Housing units in zip code 32221 with a mortgage: 5,226 (529 second mortgage, 465 both second mortgage and home equity loan) Houses without a mortgage: 35
Median monthly owner costs for units with a mortgage: $1,568 Median monthly owner costs for units without a mortgage: $441
Residents with income below the poverty level in 2022:
This zip code:
9.3%
Whole state:
12.7%
Residents with income below 50% of the poverty level in 2022:
This zip code:
5.4%
Whole state:
6.6%
Median number of rooms in houses and condos:
Here:
6.7
State:
5.9
Median number of rooms in apartments:
Here:
5.8
State:
4.2
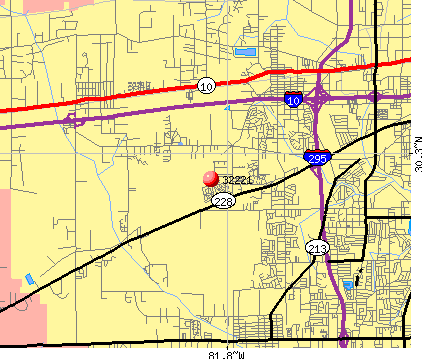
Notable locations in this zip code not listed on our city pages
Notable locations in zip code 32221: Hidden Lakes Golf Course (A), Hawks Landing Golf Course (B), Jacksonville Fire and Rescue Department Station 56 (C), West Regional Library (D), Crystal Springs Community Center (E). Display/hide their locations on the map
Churches in zip code 32221 include: New Life Temple (A), Iglesia Presbiteriana Nueva Esperanza (B), Promise Land Baptist Church (C), Most Holy Redeemer Catholic Church (D), Saint Albans Church (E), The Church of the Nativity (F), Vietnamese Christian Church (G), West Meadows Baptist Church (H), Woodstock Baptist Church (I). Display/hide their locations on the map
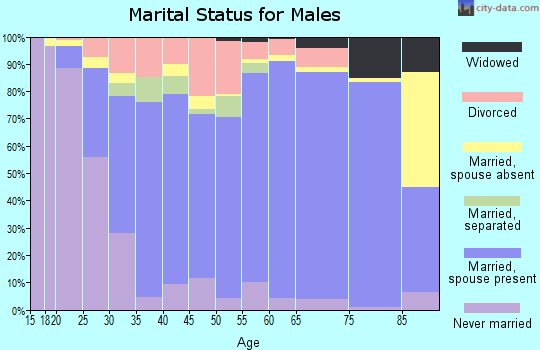
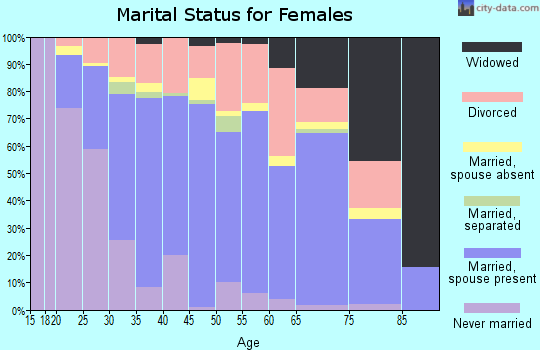
5,060 married couples with children.
1,497 single-parent households (494 men, 1,003 women).
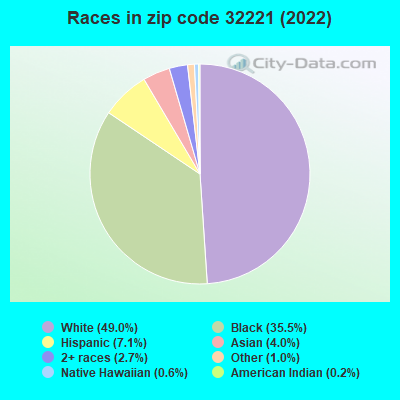
87.9% of residents of 32221 zip code speak English at home.
4.5% of residents speak Spanish at home (60% very well, 12% well, 21% not well, 7% not at all).
3.9% of residents speak other Indo-European language at home (60% very well, 5% well, 33% not well, 1% not at all).
3.3% of residents speak Asian or Pacific Island language at home (36% very well, 40% well, 19% not well, 5% not at all).
0.1% of residents speak other language at home (100% very well).
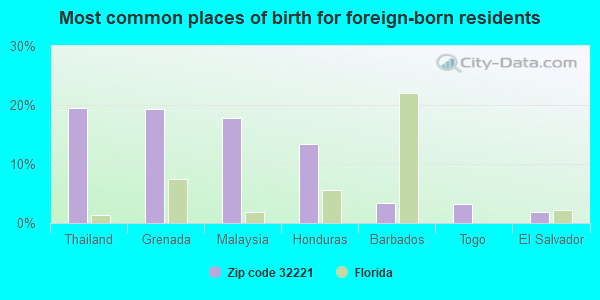
Foreign born population: 2,612 (8.3%) (66.6% of them are naturalized citizens)
Major facilities with environmental interests located in this zip code:
NAPOLI S TRAILER PARK WWTF (10200 NORMANDY BOULEVARD in JACKSONVILLE, FL)
STATE MASTER (FDM) - WAFR-FL0043150, DOMESTIC WASTEWATER PROGRAM National Pollutant Discharge Elimination System NON-MAJOR (Tracking pollutant discharge elimination systems) - permit Business SIC classification: SEWERAGE SYSTEMS Organizations: CADENHEAD ENVIRONMENTAL ENGINEEERING, INC., CADENHEAD ENVIRONMENTAL ENG SERVICE, INC, NAPOLI MOBILE HOME VILLAGE, CADENHEAD ENVIRONMENTAL ENGINEEERING, INC. (ENGINEER)
Alternative names: NAPOLI'S MOBILE HOME VILLAGE, NAPOLI'S TRAILER PARK, NAPOLIS'S TRAILER PARK
JOSEPH STILWELL MIDDLE SCHOOL (7840 BURMA RD in JACKSONVILLE, FL)
(National Center for Education Statistics) - STATE ID-2191 Organizations: DUVAL COUNTY SCHOOL DISTRICT (SCHOOL DISTRICT)
CRYSTAL SPRINGS ELEMENTARY SCHOOL (1200 HAMMOND BLVD in JACKSONVILLE, FL)
(National Center for Education Statistics) - STATE ID-2261 Organizations: DUVAL COUNTY SCHOOL DISTRICT (SCHOOL DISTRICT)
LAKE FOREST MOBILE HOME APRK (500 S CHAFFEE RD in JACKSONVILLE, FL)
(Integrated Compliance Information System) - ICIS-04-1990-0114, FORMAL ENFORCEMENT ACTION
HESS STATION NO. 09373 (8346 NORMANDY BLVD in JACKSONVILLE, FL)
National Pollutant Discharge Elimination System NON-MAJOR (Tracking pollutant discharge elimination systems) - permit Small Quantity Generators, between 100 kg and 1000 kg of hazardous waste/month (Resource Conservation and Recovery Act (tracking hazardous waste)) - notification Organizations: AMERADA HESS CORP (CONTACT/OWNER)
, DAVID LEE (CONTACT/OWNER)
Alternative names: VILLAGE OF CALDWELL
ADAMS LAKE (ADAMS LAKE BLVD in JACKSONVILLE, FL)
National Pollutant Discharge Elimination System NON-MAJOR (Tracking pollutant discharge elimination systems) - permit Organizations: TODD HOLDER (CONTACT/OWNER)
MURRAY HILL B PHASE V (B/W CASSAT/BLAUDING, WHEELER/C in JACKSONVILLE, FL)
National Pollutant Discharge Elimination System NON-MAJOR (Tracking pollutant discharge elimination systems) - permit Organizations: DAN HENDLEY (CONTACT/OWNER)
LONG LEAF FOREST NORTH SUBDIVI (FOURAKER ROAD AT HERLONG ROAD in JACKSONVILLE, FL)
National Pollutant Discharge Elimination System NON-MAJOR (Tracking pollutant discharge elimination systems) - permit Organizations: GREG MATOVINA (CONTACT/OWNER)
Alternative names: VILLAGE OF BATAVIA
ADAMS LAKE PHASE 2 (11561 NORMANDY BOULEVARD in JACKSONVILLE, FL)
National Pollutant Discharge Elimination System NON-MAJOR (Tracking pollutant discharge elimination systems) - permit Organizations: TODD HOLDER (CONTACT/OWNER)
NEW WORLD AVENUE EXTENSION (FROM FINGERLAKE ST TO CECIL BO in JACKSONVILLE, FL)
National Pollutant Discharge Elimination System NON-MAJOR (Tracking pollutant discharge elimination systems) - permit Organizations: THOMAS KAYSER (CONTACT/OWNER)
CRYSTAL CREEK (CRYSTAL SPRINGS ROAD in JACKSONVILLE, FL)
National Pollutant Discharge Elimination System NON-MAJOR (Tracking pollutant discharge elimination systems) - permit Organizations: TODD HOLDER (CONTACT/OWNER)
LAKE N11 PART 1 FOR CECIL COMM (N OF NORMANDY, W OF NEW WORLD in JAX, FL)
National Pollutant Discharge Elimination System NON-MAJOR (Tracking pollutant discharge elimination systems) - permit Organizations: THOMAS KAYSER (CONTACT/OWNER)
PINECREST UNIT 1-4 (NORMANDY BLVD in JAX, FL)
National Pollutant Discharge Elimination System NON-MAJOR (Tracking pollutant discharge elimination systems) - permit Organizations: DOUG MORAN (CONTACT/OWNER)
Housing units lacking complete plumbing facilities: 0.1% Housing units lacking complete kitchen facilities: 0.6%
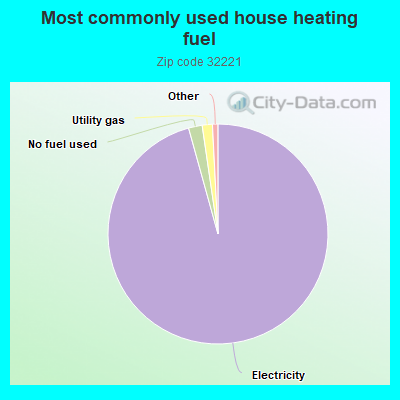
95.7%Electricity
2.0%No fuel used
1.5%Utility gas
Population in 1990: 18,244.
Place of birth for U.S.-born residents:
This state: 18,047
Northeast: 2,206
Midwest: 1,926
South: 4,699
West: 728
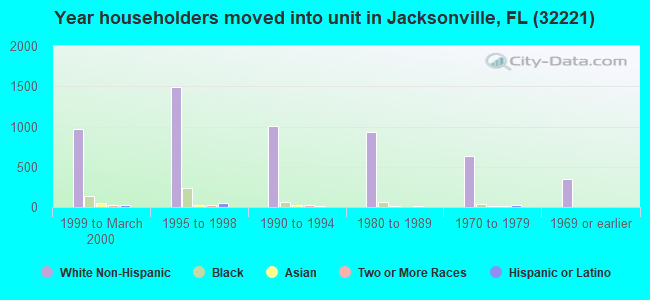
56% of the 32221 zip code residents lived in the same house 5 years ago. Out of people who lived in different houses, 67% lived in this county. Out of people who lived in different counties, 50% lived in Florida.
89% of the 32221 zip code residents lived in the same house 1 year ago. Out of people who lived in different houses, 52% moved from this county. Out of people who lived in different houses, 35% moved from different county within same state. Out of people who lived in different houses, 8% moved from different state. Out of people who lived in different houses, 1% moved from abroad.
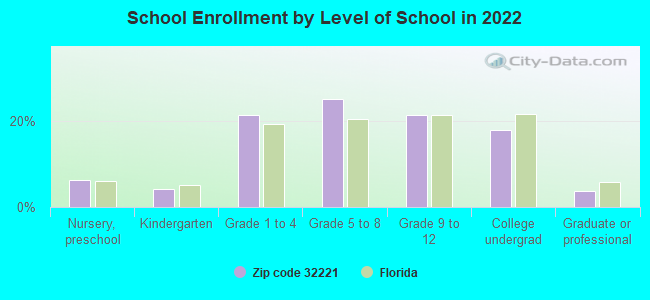
Private vs. public school enrollment:
Students in private schools in grades 1 to 8 (elementary and middle school): 586
Here:
16.4%
Florida:
15.8%
Students in private schools in grades 9 to 12 (high school): 617
Here:
37.1%
Florida:
12.9%
Students in private undergraduate colleges: 373
Here:
26.9%
Florida:
23.6%
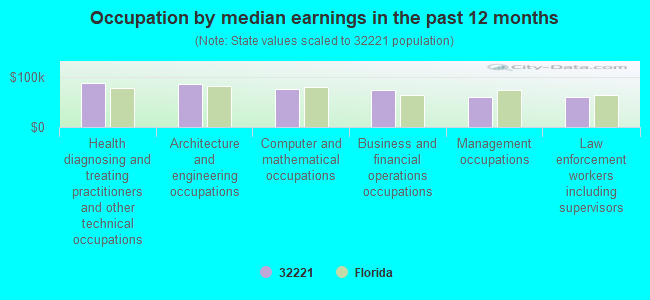
Occupation by median earnings in the past 12 months ($)
87,603Health diagnosing and treating practitioners and other technical occupations
85,221Architecture and engineering occupations
75,631Computer and mathematical occupations
73,287Business and financial operations occupations
59,910Management occupations
59,032Law enforcement workers including supervisors
Companies with federal contracts located in this zip code (JACKSONVILLE, FL):
AIRKAMAN OF JACKSONVILLE, INC (13365 AERONAUTICAL CIR)
$16,619,778 with Defense Logistics Agency for Liquid Propellants and Fuels, Petroleum Base. Signed on 2005-05-02. Completion date: 2009-03-31.
LOGISTIC SERVICES INTERNATIONA (6111 TECHNOLOGY CT; small business) 500 employees, $0 revenue: $1,998,837 in 33 contractsfrom 2002 to 2006
Contracts for Flight Instruments, Engine Instruments, Pressure, Temperature, and Humidity Measuring and Controlling Instruments, Maintenance, Repair and Rebuilding of Equipment -- Aircraft Components and Accessories, and moreby Navy Signed by year:2000: $0; 2001: $0; 2002: $398,760; 2003: $419,159; 2004: $446,858; 2005: $717,298; 2006: $16,762.
Biggest contracts:
$298,643 with Navy for Flight Instruments. Taking place in GA. Signed on 2005-05-03. Completion date: 2005-06-03.
$268,127 with Navy for Engine Instruments. Taking place in GA. Signed on 2005-12-08. Completion date: 2006-12-07.
$251,992 with Navy for Flight Instruments. Taking place in CT. Signed on 2002-10-10. Completion date: 2003-09-30.
$136,538 with Navy for Pressure, Temperature, and Humidity Measuring and Controlling Instruments. Taking place in GA. Signed on 2003-09-25. Completion date: 2004-06-30.
SIGNATURE FLIGHT SUPPORT CORPO (13365 AERONAUTICAL CIR; small business)
$1,459,162 with Defense Logistics Agency for Liquid Propellants and Fuels, Petroleum Base. Signed on 2002-04-01. Completion date: 2005-03-31.
THE M&T COMPANY (13557 LAKE NEWMAN ST) : $175,868 in 2 contractsin 2004
$114,068 with Air Force for Electrical Hardware and Supplies. Signed on 2004-02-12. Completion date: 2005-02-28.
$61,800, same as above.Signed on 2004-07-12. Completion date: 2005-02-28.
D & R LAWNCARE (10344 SUGAR GROVE ROAD; small business) : $11,641 in 3 contractsfrom 2003 to 2004
$8,025 with Army for Purchase of Structures and Facilities -- Other Utilities. Signed on 2004-04-01. Completion date: 2004-05-31.
$2,926, same as above.Signed on 2003-10-14. Completion date: 2004-09-30.
$690 with Army for Gardening Implements and Tools. Signed on 2004-10-07. Completion date: 2005-01-06.
EPPERSON & COMPANY (8180 NORMANDY BLVD; small business)
$7,630 with Navy for Winches, Hoists, Cranes, and Derricks. Signed on 2005-05-16. Completion date: 2005-06-24.
DREAM CATCHER AVIATION OF FLOR (9300 NORMANDY BLVD BUILDI; small business) : -$2,589 in 2 contractsin 2004
$0 with Navy for Other Education and Training Services. Signed on 2004-08-31. Completion date: 2004-05-31.
-$2,589, same as above.Signed on 2004-08-31. Completion date: 2004-05-31.
Top industries in this zip code by the number of employees in 2005:
Other Services (except Public Administration): Religious Organizations (250-499 employees: 1 establishment, 20-49 employees: 1 establishment, 10-19 employees: 3 establishments, 5-9 employees: 5 establishments, 1-4 employees: 12 establishments)
Health Care and Social Assistance: Nursing Care Facilities (100-249: 3, 5-9: 1)
2007 - 2018 National Fire Incident Reporting System (NFIRS) incidents
Based on the data from the years 2007 - 2018 the average number of fires per year is 63. The highest number of fires - 121 took place in 2007, and the least - 37 in 2016. The data has a dropping trend.
When looking into fire subcategories, the most incidents belonged to: Outside Fires (54.9%), and Structure Fires (21.0%).
Fire incident types reported to NFIRS in Zip Code 32221


 Nearest zip codes: 32222, 32244, 32210, 32220, 32065, 32234.


 Based on the data from the years 2007 - 2018 the average number of fires per year is 63. The highest number of fires - 121 took place in 2007, and the least - 37 in 2016. The data has a dropping trend.
 When looking into fire subcategories, the most incidents belonged to: Outside Fires (54.9%), and Structure Fires (21.0%).