Estimated zip code population in 2022: 41,164 Zip code population in 2010: 32,770 Zip code population in 2000: 20,280
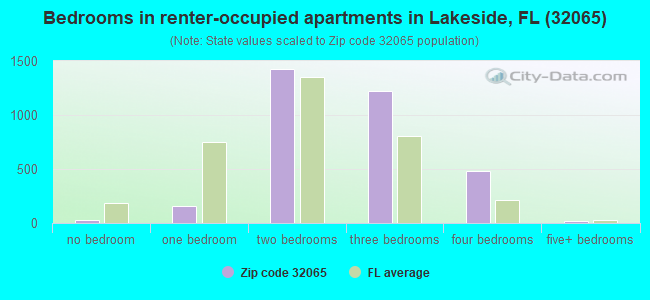
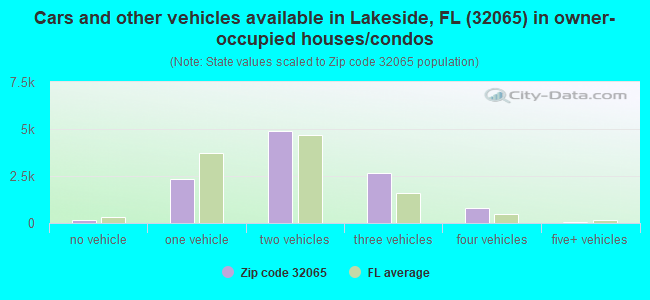
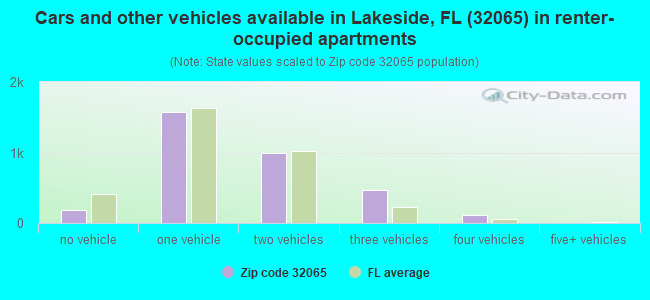
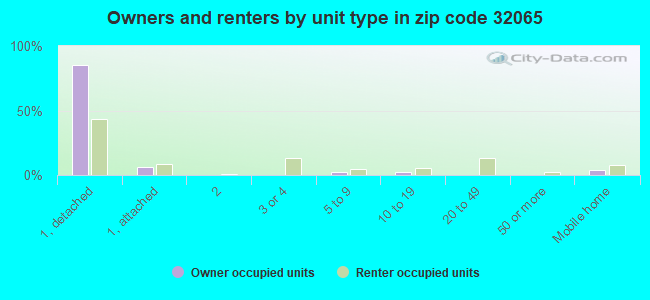
Houses and condos: 14,884 Renter-occupied apartments: 3,359
% of renters here:
23%
State:
33%
March 2022 cost of living index in zip code 32065: 88.5 (less than average, U.S. average is 100)
Land area: 17.4 sq. mi. Water area: 1.2 sq. mi.
Population density: 2,360 people per square mile
(low).
OSM Map
General Map
Google Map
MSN Map
OSM Map
General Map
Google Map
MSN Map
OSM Map
General Map
Google Map
MSN Map
OSM Map
General Map
Google Map
MSN Map
Please wait while loading the map...
Real estate property taxes paid for housing units in 2022:
This zip code:
0.9% ($2,720)
Florida:
0.7% ($2,529)
Median real estate property taxes paid for housing units with mortgages in 2022: $2,819 (0.9%) Median real estate property taxes paid for housing units with no mortgage in 2022: $2,309 (0.8%)
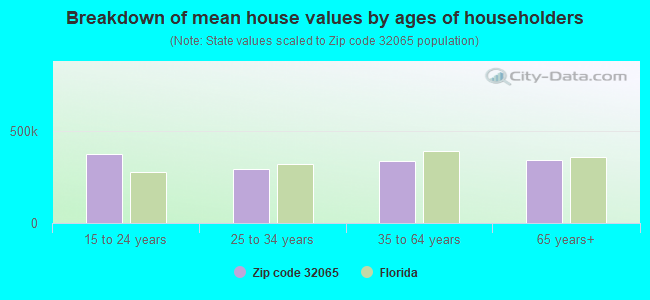
Estimated median house/condo value in 2022: $314,836
32065:
$314,836
Florida:
$354,100
According to our research of Florida and other state lists, there were 19 registered sex offenders living in 32065 zip code as of April 27, 2024. The ratio of all residents to sex offenders in zip code 32065 is 2,021 to 1. The ratio of registered sex offenders to all residents in this zip code is much lower than the state average.
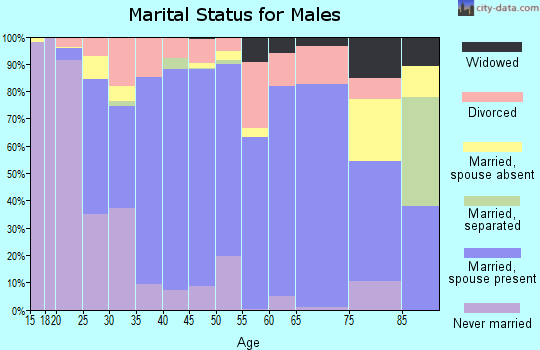
Median resident age:
This zip code:
36.0 years
Florida median age:
42.7 years
Average household size:
This zip code:
2.9 people
Florida:
2.5 people
Averages for the 2020 tax year for zip code 32065, filed in 2021:
Average Adjusted Gross Income (AGI) in 2020: $60,679 (Individual Income Tax Returns)
Here:
$60,679
State:
$82,200
Salary/wage: $54,132 (reported on 85.3% of returns)
Here:
$54,132
State:
$58,347
(% of AGI for various income ranges: 1258.5% for AGIs below $25k, 3704.8% for AGIs $25k-50k, 6436.7% for AGIs $50k-75k, 9374.8% for AGIs $75k-100k, 18294.6% for AGIs $100k-200k, 55596.5% for AGIs over 200k)
Taxable interest for individuals: $828 (reported on 24.0% of returns)
This zip code:
$828
Florida:
$4,272
(% of AGI for various income ranges: 7.4% for AGIs below $25k, 10.6% for AGIs $25k-50k, 19.4% for AGIs $50k-75k, 32.4% for AGIs $75k-100k, 77.8% for AGIs $100k-200k, 491.2% for AGIs over 200k)
Ordinary dividends: $2,917 (reported on 12.2% of returns)
Here:
$2,917
State:
$15,863
(% of AGI for various income ranges: 9.5% for AGIs below $25k, 14.1% for AGIs $25k-50k, 24.1% for AGIs $50k-75k, 57.6% for AGIs $75k-100k, 123.9% for AGIs $100k-200k, 1386.5% for AGIs over 200k)
Net capital gain/loss in AGI: +$9,246 (reported on 11.1% of returns)
Here:
+$9,246
State:
+$62,983
(% of AGI for various income ranges: 4.8% for AGIs below $25k, 11.7% for AGIs $25k-50k, 43.4% for AGIs $50k-75k, 127.9% for AGIs $75k-100k, 306.4% for AGIs $100k-200k, 6495.3% for AGIs over 200k)
Profit/loss from business: +$5,181 (reported on 16.5% of returns)
Here:
+$5,181
State:
+$9,719
(% of AGI for various income ranges: 69.5% for AGIs below $25k, 61.0% for AGIs $25k-50k, 104.6% for AGIs $50k-75k, 123.3% for AGIs $75k-100k, 241.5% for AGIs $100k-200k, 1411.2% for AGIs over 200k)
Taxable individual retirement arrangement distribution: $17,996 (reported on 5.8% of returns)
32065:
$17,996
Florida:
$24,823
(% of AGI for various income ranges: 26.9% for AGIs below $25k, 45.0% for AGIs $25k-50k, 130.5% for AGIs $50k-75k, 196.0% for AGIs $75k-100k, 443.6% for AGIs $100k-200k, 2307.6% for AGIs over 200k)
Total itemized deductions: $32,701 (reported on 6.2% of returns)
Here:
$32,701
State:
$45,393
(% of AGI for various income ranges: 33.8% for AGIs below $25k, 102.5% for AGIs $25k-50k, 272.3% for AGIs $50k-75k, 395.5% for AGIs $75k-100k, 749.2% for AGIs $100k-200k, 5220.0% for AGIs over 200k)
Charity contributions: $13,817 (reported on 5.0% of returns)
Here:
$13,817
State:
$20,178
(% of AGI for various income ranges: 3.1% for AGIs below $25k, 17.8% for AGIs $25k-50k, 68.6% for AGIs $50k-75k, 95.2% for AGIs $75k-100k, 257.9% for AGIs $100k-200k, 3095.9% for AGIs over 200k)
Taxes paid: $6,122 (reported on 6.1% of returns)
32065:
$6,122
State:
$6,967
(% of AGI for various income ranges: 4.5% for AGIs below $25k, 17.8% for AGIs $25k-50k, 53.7% for AGIs $50k-75k, 77.0% for AGIs $75k-100k, 159.1% for AGIs $100k-200k, 750.0% for AGIs over 200k)
Earned income credit: $2,395 (reported on 18.5% of returns)
Here:
$2,395
State:
$2,306
(% of AGI for various income ranges: 104.6% for AGIs below $25k, 82.7% for AGIs $25k-50k, 1.8% for AGIs $50k-75k)
Percentage of individuals using paid preparers for their 2020 taxes: 93.6%
Here:
94%
State:
92%
(% for various income ranges: 93.2% for AGIs below $25k, 94.2% for AGIs $25k-50k, 93.2% for AGIs $50k-75k, 94.4% for AGIs $75k-100k, 93.2% for AGIs $100k-200k, 93.6% for AGIs over 200k)
Averages for the 2012 tax year for zip code 32065, filed in 2013:
Average Adjusted Gross Income (AGI) in 2012: $53,006 (Individual Income Tax Returns)
Here:
$53,006
State:
$60,316
Salary/wage: $48,506 (reported on 87.9% of returns)
Here:
$48,506
State:
$45,277
(% of AGI for various income ranges: 82.3% for AGIs below $25k, 85.0% for AGIs $25k-50k, 80.9% for AGIs $50k-75k, 82.0% for AGIs $75k-100k, 80.4% for AGIs $100k-200k, 65.7% for AGIs over 200k)
Taxable interest for individuals: $665 (reported on 29.3% of returns)
This zip code:
$665
Florida:
$3,587
(% of AGI for various income ranges: 0.6% for AGIs below $25k, 0.4% for AGIs $25k-50k, 0.5% for AGIs $50k-75k, 0.2% for AGIs $75k-100k, 0.3% for AGIs $100k-200k, 0.4% for AGIs over 200k)
Ordinary dividends: $2,580 (reported on 13.1% of returns)
Here:
$2,580
State:
$12,831
(% of AGI for various income ranges: 0.7% for AGIs below $25k, 0.6% for AGIs $25k-50k, 0.6% for AGIs $50k-75k, 0.3% for AGIs $75k-100k, 0.7% for AGIs $100k-200k, 1.4% for AGIs over 200k)
Net capital gain/loss in AGI: +$2,785 (reported on 9.2% of returns)
Here:
+$2,785
State:
+$33,493
(% of AGI for various income ranges: 0.1% for AGIs $50k-75k, 0.4% for AGIs $100k-200k, 4.1% for AGIs over 200k)
Profit/loss from business: +$5,864 (reported on 12.6% of returns)
Here:
+$5,864
State:
+$10,012
(% of AGI for various income ranges: 4.8% for AGIs below $25k, 0.9% for AGIs $25k-50k, 1.3% for AGIs $50k-75k, 0.9% for AGIs $75k-100k, 1.0% for AGIs $100k-200k, 1.7% for AGIs over 200k)
Taxable individual retirement arrangement distribution: $15,496 (reported on 7.1% of returns)
32065:
$15,496
Florida:
$21,544
(% of AGI for various income ranges: 1.6% for AGIs below $25k, 1.4% for AGIs $25k-50k, 1.5% for AGIs $50k-75k, 1.9% for AGIs $75k-100k, 2.4% for AGIs $100k-200k, 4.4% for AGIs over 200k)
Self-employment retirement plans: $14,200 (reported on 0.1% of returns)
32065:
$14,200
Florida:
$20,611
Total itemized deductions: $19,542 (22% of AGI, reported on 30.3% of returns)
Here:
$19,542
State:
$25,533
Here:
22.4% of AGI
State:
18.0% of AGI
(% of AGI for various income ranges: 7.9% for AGIs below $25k, 11.1% for AGIs $25k-50k, 12.4% for AGIs $50k-75k, 12.1% for AGIs $75k-100k, 11.6% for AGIs $100k-200k, 8.4% for AGIs over 200k)
Charity contributions: $3,779 (reported on 24.1% of returns)
Here:
$3,779
State:
$5,698
(% of AGI for various income ranges: 0.7% for AGIs below $25k, 1.3% for AGIs $25k-50k, 1.8% for AGIs $50k-75k, 1.9% for AGIs $75k-100k, 2.0% for AGIs $100k-200k, 2.1% for AGIs over 200k)
Taxes paid: $4,392 (reported on 29.6% of returns)
32065:
$4,392
State:
$6,203
(% of AGI for various income ranges: 1.3% for AGIs below $25k, 2.2% for AGIs $25k-50k, 2.5% for AGIs $50k-75k, 2.9% for AGIs $75k-100k, 2.7% for AGIs $100k-200k, 2.1% for AGIs over 200k)
Earned income credit: $2,322 (reported on 20.3% of returns)
Here:
$2,322
State:
$2,372
(% of AGI for various income ranges: 7.6% for AGIs below $25k, 1.5% for AGIs $25k-50k)
Percentage of individuals using paid preparers for their 2012 taxes: 39.9%
Here:
40%
State:
54%
(% for various income ranges: 37.0% for AGIs below $25k, 38.3% for AGIs $25k-50k, 40.9% for AGIs $50k-75k, 42.1% for AGIs $75k-100k, 45.3% for AGIs $100k-200k, 65.0% for AGIs over 200k)
Averages for the 2004 tax year for zip code 32065, filed in 2005:
Average Adjusted Gross Income (AGI) in 2004: $45,765 (Individual Income Tax Returns)
Here:
$45,765
State:
$50,523
Salary/wage: $41,423 (reported on 90.6% of returns)
Here:
$41,423
State:
$39,563
(% of AGI for various income ranges: 111.9% for AGIs below $10k, 83.0% for AGIs $10k-25k, 85.3% for AGIs $25k-50k, 82.9% for AGIs $50k-75k, 85.3% for AGIs $75k-100k, 74.4% for AGIs over 100k)
Taxable interest for individuals: $1,083 (reported on 44.3% of returns)
This zip code:
$1,083
Florida:
$3,211
(% of AGI for various income ranges: 3.1% for AGIs below $10k, 1.2% for AGIs $10k-25k, 0.8% for AGIs $25k-50k, 0.7% for AGIs $50k-75k, 0.7% for AGIs $75k-100k, 1.6% for AGIs over 100k)
Taxable dividends: $1,195 (reported on 17.7% of returns)
Here:
$1,195
State:
$6,129
(% of AGI for various income ranges: 1.5% for AGIs below $10k, 0.5% for AGIs $10k-25k, 0.4% for AGIs $25k-50k, 0.4% for AGIs $50k-75k, 0.3% for AGIs $75k-100k, 0.7% for AGIs over 100k)
Net capital gain/loss: +$6,312 (reported on 13.2% of returns)
Here:
+$6,312
State:
+$27,205
(% of AGI for various income ranges: -0.7% for AGIs below $10k, -0.2% for AGIs $10k-25k, 0.4% for AGIs $25k-50k, 0.6% for AGIs $50k-75k, 0.7% for AGIs $75k-100k, 5.5% for AGIs over 100k)
Profit/loss from business: +$7,433 (reported on 11.7% of returns)
Here:
+$7,433
State:
+$10,634
(% of AGI for various income ranges: 4.5% for AGIs below $10k, 4.5% for AGIs $10k-25k, 1.2% for AGIs $25k-50k, 1.5% for AGIs $50k-75k, 1.0% for AGIs $75k-100k, 2.4% for AGIs over 100k)
IRA payment deduction: $2,680 (reported on 2.4% of returns)
32065:
$2,680
Florida:
$3,082
(% of AGI for various income ranges: 0.2% for AGIs $10k-25k, 0.2% for AGIs $25k-50k, 0.2% for AGIs $50k-75k, 0.1% for AGIs $75k-100k, 0.1% for AGIs over 100k)
Self-employed pension: $10,833 (reported on 0.3% of returns)
Here:
$10,833
Florida:
$15,857
Total itemized deductions: $16,217 (22% of AGI, reported on 33.5% of returns)
Here:
$16,217
State:
$20,370
Here:
22.1% of AGI
State:
20.7% of AGI
(% of AGI for various income ranges: 7.9% for AGIs below $10k, 9.0% for AGIs $10k-25k, 11.6% for AGIs $25k-50k, 13.4% for AGIs $50k-75k, 12.4% for AGIs $75k-100k, 11.5% for AGIs over 100k)
Charity contributions deductions: $3,048 (4% of AGI, reported on 28.8% of returns)
Here:
$3,048
State:
$4,064
Here:
4.0% of AGI
State:
3.8% of AGI
(% of AGI for various income ranges: 0.5% for AGIs below $10k, 1.1% for AGIs $10k-25k, 1.5% for AGIs $25k-50k, 2.1% for AGIs $50k-75k, 2.1% for AGIs $75k-100k, 2.2% for AGIs over 100k)
Total tax: $5,921 (reported on 77.0% of returns)
32065:
$5,921
State:
$9,431
(% of AGI for various income ranges: 2.4% for AGIs below $10k, 4.2% for AGIs $10k-25k, 6.1% for AGIs $25k-50k, 8.1% for AGIs $50k-75k, 10.2% for AGIs $75k-100k, 16.3% for AGIs over 100k)
Earned income credit: $1,667 (reported on 14.3% of returns)
Here:
$1,667
State:
$1,808
Percentage of individuals using paid preparers for their 2004 taxes: 46.7%
Here:
47%
State:
60%
(% for various income ranges: 38.6% for AGIs below $10k, 49.7% for AGIs $10k-25k, 48.1% for AGIs $25k-50k, 48.0% for AGIs $50k-75k, 45.7% for AGIs $75k-100k, 49.6% for AGIs over 100k)
Likely homosexual households (counted as self-reported same-sex unmarried-partner households)
Lesbian couples: 0.1% of all households
Gay men: 0.0% of all households
Household received Food Stamps/SNAP in the past 12 months: 1,193 Household did not receive Food Stamps/SNAP in the past 12 months: 13,215
Women who had a birth in the past 12 months: 587 (349 now married, 233 unmarried) Women who did not have a birth in the past 12 months: 10,401 (4,873 now married, 5,530 unmarried)
Housing units in zip code 32065 with a mortgage: 8,200 (758 second mortgage, 97 home equity loan, 531 both second mortgage and home equity loan) Houses without a mortgage: 115
Median monthly owner costs for units with a mortgage: $1,653 Median monthly owner costs for units without a mortgage: $563
Residents with income below the poverty level in 2022:
This zip code:
8.9%
Whole state:
12.7%
Residents with income below 50% of the poverty level in 2022:
This zip code:
3.3%
Whole state:
6.6%
Median number of rooms in houses and condos:
Here:
6.8
State:
5.9
Median number of rooms in apartments:
Here:
4.8
State:
4.2
Notable locations in this zip code not listed on our city pages
Notable locations in zip code 32065: Camp Coacoochee (A), Spencer Wastewater Treatment Facility (B), Saint Johns River Community College Orange Park Campus Library (C), Clay County Fire Rescue Doctors Inlet Station 17 (D). Display/hide their locations on the map
Churches in zip code 32065 include: Clay Community Church (A), Church of the Nazarene (B), Central Baptist Church (C), Ridgewood Baptist Church (D), Calvary Church (E), Orange Park Kingdom Hall of Jehovahs Witnesses (F), New Testament Baptist Church (G), Doctors Inlet Church of God (H), Branan Field Baptist Church (I). Display/hide their locations on the map
6,997 married couples with children.
2,101 single-parent households (644 men, 1,457 women).
86.8% of residents of 32065 zip code speak English at home.
6.1% of residents speak Spanish at home (69% very well, 21% well, 9% not well).
1.3% of residents speak other Indo-European language at home (65% very well, 17% well, 8% not well, 10% not at all).
5.1% of residents speak Asian or Pacific Island language at home (70% very well, 20% well, 9% not well, 1% not at all).
0.1% of residents speak other language at home (100% very well).
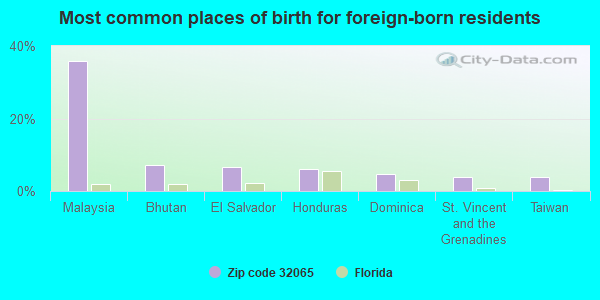
Foreign born population: 3,610 (8.8%) (77.4% of them are naturalized citizens)
Major facilities with environmental interests located in this zip code:
MR. DRYCLEAN (700-5 BLANDING BLVD in ORANGE PK, FL)
AIR MINOR (AIRS/AFS) (Resource Conservation and Recovery Act (tracking hazardous waste)) Business SIC classification: DRYCLEANING PLANTS, EXCEPT RUG CLEANING Organizations: RAMIREZ EDWARD (CONTACT/OWNER)
RIDGEVIEW ELEMENTARY SCHOOL (421 JEFFERSON AVE in ORANGE PARK, FL)
(National Center for Education Statistics) - STATE ID-0401 Organizations: CLAY COUNTY SCHOOL DISTRICT (SCHOOL DISTRICT)
RIDGEVIEW HIGH SCHOOL (FORMERLY RIDGEVIEW (466 MADISON AVE in ORANGE PARK, FL)
(National Center for Education Statistics) - STATE ID-0431 Organizations: CLAY COUNTY SCHOOL DISTRICT (SCHOOL DISTRICT)
A-1 CLEANERS (795A BLANDING BOULEVARD in ORANGE PARK, FL)
AIR MINOR (AIRS/AFS) (Resource Conservation and Recovery Act (tracking hazardous waste)) Business SIC classification: DRYCLEANING PLANTS, EXCEPT RUG CLEANING Organizations: SUNGYOL LEE (CONTACT/OWNER)
NEIGHBORHOOD CLEANERS & SUPPLY (1101 BLANDING BOULEVARD #123 in ORANGE PARK, FL)
AIR MINOR (AIRS/AFS) (Resource Conservation and Recovery Act (tracking hazardous waste)) Business SIC classification: DRYCLEANING PLANTS, EXCEPT RUG CLEANING Organizations: BLANDING SQUARE SHOPPING CTR (CONTACT/OWNER)
Alternative names: NEIGHBORHOOD DRY CLEANERS, NEIGHBORHOOD DRY CLEANERS & SUPPLIES INCORPORATED
PREMIER CLEANERS INC (950-4 BLANDING BLVD in ORANGE PK, FL)
AIR MINOR (AIRS/AFS) (Resource Conservation and Recovery Act (tracking hazardous waste)) Business SIC classification: DRYCLEANING PLANTS, EXCEPT RUG CLEANING Organizations: NON NOTIFIER (CONTACT/OWNER)
A-1 TRANSMISSION & AUTO SERVICE (1274C BLANDING BLVD in ORANGE PARK, FL)
(Resource Conservation and Recovery Act (tracking hazardous waste)) Business NAICS classification: GENERAL AUTOMOTIVE REPAIR. Organizations: KELLY NAIL (CONTACT/OWNER)
ALLENS MOBILE AUTOMOTIVE REPAIR (651 WASHINGTON AVE in ORANGE PARK, FL)
GENES GARBAGE SERVICE (120 COLLEGE DRIVE in ORANGE PARK, FL)
(Resource Conservation and Recovery Act (tracking hazardous waste)) Business NAICS classification: GENERAL AUTOMOTIVE REPAIR. Organizations: ALBERT MCWHORTER SERVICE MAINT (CONTACT/OWNER)
GRANGER OFFICE / WAREHOUSE CON (377 PARK RIDGE AVE in ORANGE PARK, FL)
National Pollutant Discharge Elimination System NON-MAJOR (Tracking pollutant discharge elimination systems) - permit Organizations: EDDIE GRANGER (CONTACT/OWNER)
HARTMANS AUTO KRAFT INC (69 COLLEGE DR #3 in ORANGE PARK, FL)
(Resource Conservation and Recovery Act (tracking hazardous waste)) Organizations: ROGER HARTMAN, PRES (CONTACT/OWNER)
JIFFY LUBE (804 BLANDING BLVD in ORANGE PARK, FL)
(Resource Conservation and Recovery Act (tracking hazardous waste)) Organizations: RANDY SCHMITZ, GM (CONTACT/OWNER)
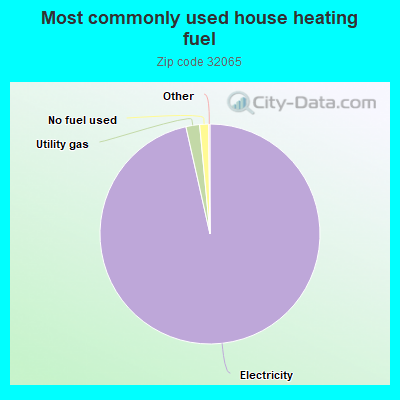
Housing units lacking complete plumbing facilities: 0.8% Housing units lacking complete kitchen facilities: 0.8%
96.5%Electricity
2.0%Utility gas
1.3%No fuel used
Population in 1990: 19,248. Population change in the 1990s: +1,032 (+5.4%).
Place of birth for U.S.-born residents:
This state: 15,484
Northeast: 5,460
Midwest: 3,395
South: 9,261
West: 2,625
53% of the 32065 zip code residents lived in the same house 5 years ago. Out of people who lived in different houses, 33% lived in this county. Out of people who lived in different counties, 50% lived in Florida.
92% of the 32065 zip code residents lived in the same house 1 year ago. Out of people who lived in different houses, 36% moved from this county. Out of people who lived in different houses, 34% moved from different county within same state. Out of people who lived in different houses, 24% moved from different state. Out of people who lived in different houses, 9% moved from abroad.
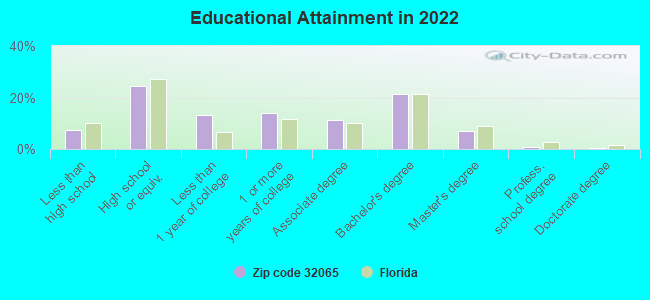
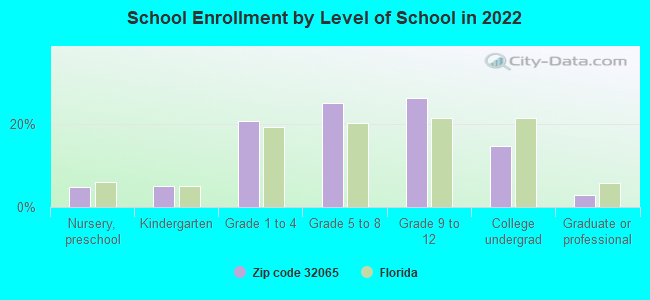
Private vs. public school enrollment:
Students in private schools in grades 1 to 8 (elementary and middle school): 735
Here:
13.9%
Florida:
15.8%
Students in private schools in grades 9 to 12 (high school): 128
Here:
4.3%
Florida:
12.9%
Students in private undergraduate colleges: 572
Here:
33.3%
Florida:
23.6%
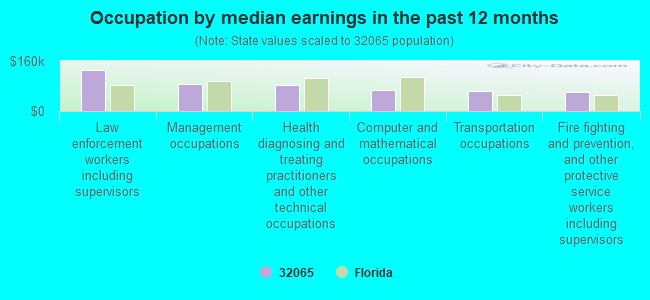
Occupation by median earnings in the past 12 months ($)
130,442Law enforcement workers including supervisors
85,640Management occupations
84,643Health diagnosing and treating practitioners and other technical occupations
67,313Computer and mathematical occupations
63,805Transportation occupations
62,350Fire fighting and prevention, and other protective service workers including supervisors
Companies with biggest federal contracts located in this zip code (ORANGE PARK, FL):
KEYSTONE SHIP BERTHING INC (3971 DOCTORS LAKE DRIVE; small business) : $20,490,748 in 20 contractsfrom 1999 to 2006
Contracts for Other Transportation Travel and Relocation Services, Lease or Rental of Facilities -- Other Non-Building Facilities, Lease or Rental of Facilities -- Ship Construction and Repair Facilities by Navy Signed by year:2000: $2,465,903; 2001: $954,200; 2002: $3,173,580; 2003: $3,371,586; 2004: $4,151,478; 2005: $2,329,897; 2006: $1,151,117.
Biggest contracts:
$2,737,061 with Navy for Other Transportation Travel and Relocation Services. Taking place in MD. Signed on 2005-11-22. Completion date: 2003-11-30.
$2,677,222 with Navy for Lease or Rental of Facilities -- Other Non-Building Facilities. Taking place in MD. Signed on 1999-12-20. Completion date: 2005-06-20.
$2,365,903 with Navy for Other Transportation Travel and Relocation Services. Taking place in MD. Signed on 2000-11-01. Completion date: 2000-11-30.
$2,352,413, same as above.Signed on 2004-11-30. Completion date: 2003-11-30.
NEVER QUIT ENTERPRISES INC (331 PARKRIDGE AVE STE 3; small business) : $7,802,504 in 117 contractsfrom 2001 to 2006
Contracts for Custodial Janitorial Services, Maintenance, Repair and Rebuilding of Equipment -- Refrigeration, Air Conditioning, and Air Circulating Equipment, Operation of Government-Owned Facilities -- Office Buildings, Relocation Services, and moreby Army, Public Buildings Service, Defense Logistics Agency, Federal Emergency Management Agency, and others Signed by year:2000: $0; 2001: $35,978; 2002: $475,470; 2003: $1,007,499; 2004: $1,324,818; 2005: $2,182,756; 2006: $2,775,983.
Biggest contracts:
$1,367,625 with Army for Custodial Janitorial Services. Taking place in TX. Signed on 2006-05-09. Completion date: 2007-04-30.
$640,635 with Public Buildings Service for Maintenance, Repair and Rebuilding of Equipment -- Refrigeration, Air Conditioning, and Air Circulating Equipment. Signed on 2006-02-28. Effective on 2006-03-01. Completion date: 2008-02-28.
$630,792 with Army for Custodial Janitorial Services. Taking place in TX. Signed on 2005-03-31. Completion date: 2006-04-30.
$365,780 with Defense Logistics Agency for Custodial Janitorial Services. Taking place in TX. Signed on 2004-10-20. Completion date: 2006-01-14.
SUSAN KOEHLER (1570 IBIS DR; small business) : $415,840 in 3 contractsfrom 2004 to 2005
$192,096 with Navy for General Health Care Services. Signed on 2004-12-23. Completion date: 2005-09-30.
$191,360, same as above.Signed on 2005-10-01. Completion date: 2006-09-30.
$32,384, same as above.Signed on 2004-05-27. Completion date: 2004-09-30.
LINEN MANAGEMENT SERVICES INC (967 BLANDING BLVD; small business) : $271,537 in 8 contractsfrom 1999 to 2000
Contracts for Laundry and DryCleaning Services by Navy Signed by year:2000: $170,351; 2001: $0; 2002: $0; 2003: $0; 2004: $0; 2005: $0; 2006: $0.
Biggest contracts:
$34,245 with Navy for Laundry and DryCleaning Services. Signed on 2000-04-05. Completion date: 2000-04-30.
$34,145, same as above.Signed on 1999-11-12. Completion date: 1999-11-30.
$34,142, same as above.Signed on 2000-02-28. Completion date: 2000-03-31.
$34,142, same as above.Signed on 1999-12-13. Completion date: 1999-12-31.
TJP TWO, INC (1045 BLANDING BLVD STE 201; small business)
$270,000 with Army for Miscellaneous Furniture and Fixtures. Signed on 2003-09-23. Completion date: 2003-10-24.
DENISE L KOSTRUB (2815 KIOWA AVE; small business) : $269,313 in 9 contractsfrom 2001 to 2005
Contracts for Ophthalmology Services by Navy Signed by year:2000: $0; 2001: $16,320; 2002: $77,966; 2003: $57,586; 2004: $57,044; 2005: $60,397; 2006: $0.
Biggest contracts:
$60,756 with Navy for Ophthalmology Services. Signed on 2005-10-01. Completion date: 2006-09-30.
$57,044, same as above.Signed on 2004-11-18. Completion date: 2005-09-30.
$55,586, same as above.Signed on 2003-10-01. Completion date: 2004-09-30.
$53,766, same as above.Signed on 2002-10-01. Completion date: 2003-09-30.
AMASON'S PORTABLE TOILETS & HO (130 COLLEGE DR) : $129,587 in 9 contractsfrom 2001 to 2005
Contracts for Lease or Rental of Equipment -- Toiletries, Waste Treatment and Storage, Water Distillation Equipment, Marine and Industrial, Lease or Rental of Facilities -- Recreation Facilities (Non-Building) by Army, Indian Affairs (Assistant Secretary), Navy Signed by year:2000: $0; 2001: $28,675; 2002: $2,230; 2003: $0; 2004: $97,938; 2005: $744; 2006: $0.
Biggest contracts:
$48,650 with Army for Lease or Rental of Equipment -- Toiletries. Signed on 2004-05-28. Completion date: 2004-06-03.
$28,675 with Army for Waste Treatment and Storage. Signed on 2001-05-21. Completion date: 2001-06-16.
$18,200 with Army for Lease or Rental of Equipment -- Toiletries. Signed on 2004-05-28. Completion date: 2004-06-11.
$14,163, same as above.Signed on 2004-06-24. Completion date: 2004-06-03.
OUTDOOR PRODUCTS OF FLORIDA, I (246 JEFFERSON AVE E; small business)
$7,095 with Army for Miscellaneous Prefabricated Structures. Signed on 2006-02-14. Completion date: 2006-02-28.
GATP INC (901 RIDGEWAY CT; small business)
$5,000 with U.S. Special Operations Command for Other Education and Training Services. Signed on 2006-06-13. Completion date: 2006-06-21.
NETWORK CABLING SERVICES INC (170 COLLEGE DR STE C; small business) 750 employees, $0 revenue.
$3,350 with Air Force for Cable, Cord, and Wire Assemblies: Communications Equipment. Signed on 2005-09-27. Completion date: 2005-10-27.
Top industries in this zip code by the number of employees in 2005:
2002 - 2018 National Fire Incident Reporting System (NFIRS) incidents
Based on the data from the years 2002 - 2018 the average number of fires per year is 33. The highest number of fires - 79 took place in 2007, and the least - 4 in 2013. The data has a growing trend.
When looking into fire subcategories, the most reports belonged to: Outside Fires (55.8%), and Structure Fires (28.4%).
Fire incident types reported to NFIRS in Zip Code 32065


 Nearest zip codes: 32073, 32222, 32244, 32003, 32068, 32221.


 Based on the data from the years 2002 - 2018 the average number of fires per year is 33. The highest number of fires - 79 took place in 2007, and the least - 4 in 2013. The data has a growing trend.
 When looking into fire subcategories, the most reports belonged to: Outside Fires (55.8%), and Structure Fires (28.4%).