Estimated zip code population in 2022: 60,339 Zip code population in 2010: 48,789 Zip code population in 2000: 36,100
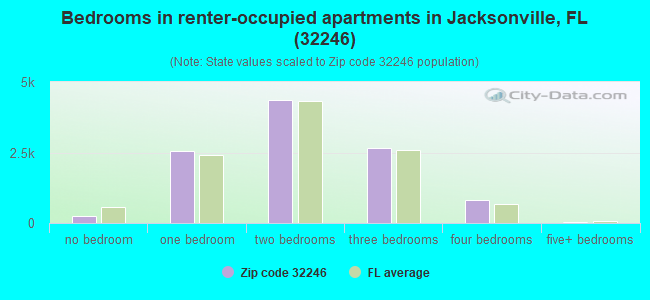
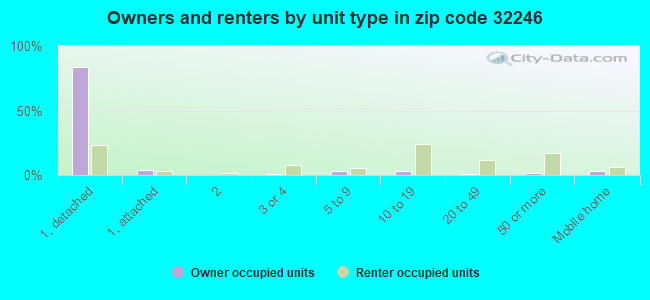
Houses and condos: 26,299 Renter-occupied apartments: 10,682
% of renters here:
44%
State:
33%
March 2022 cost of living index in zip code 32246: 89.3 (less than average, U.S. average is 100)
Land area: 18.9 sq. mi. Water area: 0.3 sq. mi.
Population density: 3,187 people per square mile
(average).
OSM Map
General Map
Google Map
MSN Map
OSM Map
General Map
Google Map
MSN Map
OSM Map
General Map
Google Map
MSN Map
OSM Map
General Map
Google Map
MSN Map
Please wait while loading the map...
Real estate property taxes paid for housing units in 2022:
This zip code:
0.7% ($2,313)
Florida:
0.7% ($2,529)
Median real estate property taxes paid for housing units with mortgages in 2022: $2,445 (0.7%) Median real estate property taxes paid for housing units with no mortgage in 2022: $1,867 (0.7%)
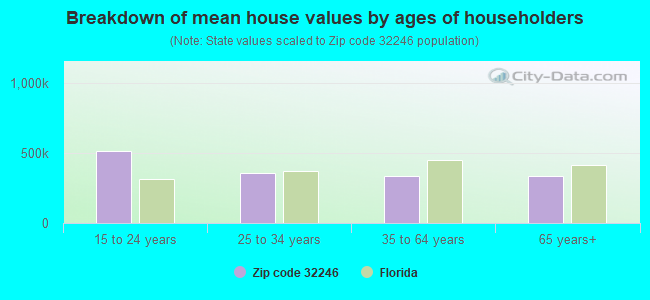
Estimated median house/condo value in 2022: $321,380
32246:
$321,380
Florida:
$354,100
According to our research of Florida and other state lists, there were 72 registered sex offenders living in 32246 zip code as of April 27, 2024. The ratio of all residents to sex offenders in zip code 32246 is 727 to 1. The ratio of registered sex offenders to all residents in this zip code is near the state average.
Median resident age:
This zip code:
35.3 years
Florida median age:
42.7 years
Average household size:
This zip code:
2.5 people
Florida:
2.5 people
Averages for the 2020 tax year for zip code 32246, filed in 2021:
Average Adjusted Gross Income (AGI) in 2020: $57,765 (Individual Income Tax Returns)
Here:
$57,765
State:
$82,200
Salary/wage: $53,081 (reported on 84.6% of returns)
Here:
$53,081
State:
$58,347
(% of AGI for various income ranges: 1229.6% for AGIs below $25k, 3748.0% for AGIs $25k-50k, 6923.3% for AGIs $50k-75k, 10010.7% for AGIs $75k-100k, 18416.5% for AGIs $100k-200k, 62257.3% for AGIs over 200k)
Taxable interest for individuals: $924 (reported on 23.2% of returns)
This zip code:
$924
Florida:
$4,272
(% of AGI for various income ranges: 8.1% for AGIs below $25k, 11.8% for AGIs $25k-50k, 29.8% for AGIs $50k-75k, 43.8% for AGIs $75k-100k, 77.7% for AGIs $100k-200k, 478.8% for AGIs over 200k)
Ordinary dividends: $3,136 (reported on 13.5% of returns)
Here:
$3,136
State:
$15,863
(% of AGI for various income ranges: 9.9% for AGIs below $25k, 18.3% for AGIs $25k-50k, 40.5% for AGIs $50k-75k, 59.6% for AGIs $75k-100k, 167.0% for AGIs $100k-200k, 1437.9% for AGIs over 200k)
Net capital gain/loss in AGI: +$10,272 (reported on 13.1% of returns)
Here:
+$10,272
State:
+$62,983
(% of AGI for various income ranges: 5.9% for AGIs below $25k, 19.0% for AGIs $25k-50k, 52.2% for AGIs $50k-75k, 127.8% for AGIs $75k-100k, 397.3% for AGIs $100k-200k, 7863.9% for AGIs over 200k)
Profit/loss from business: +$9,719 (reported on 18.3% of returns)
Here:
+$9,719
State:
+$9,719
(% of AGI for various income ranges: 183.1% for AGIs below $25k, 183.1% for AGIs $25k-50k, 232.3% for AGIs $50k-75k, 206.2% for AGIs $75k-100k, 354.6% for AGIs $100k-200k, 2359.4% for AGIs over 200k)
Taxable individual retirement arrangement distribution: $17,915 (reported on 5.1% of returns)
32246:
$17,915
Florida:
$24,823
(% of AGI for various income ranges: 29.4% for AGIs below $25k, 48.0% for AGIs $25k-50k, 101.9% for AGIs $50k-75k, 226.8% for AGIs $75k-100k, 457.8% for AGIs $100k-200k, 1538.8% for AGIs over 200k)
Self-employed (Keogh) retirement plans: $18,280 (reported on 0.2% of returns)
32246:
$18,280
Florida:
$29,694
(% of AGI for various income ranges: 4.2% for AGIs $25k-50k, 193.9% for AGIs over 200k)
Total itemized deductions: $30,656 (reported on 4.9% of returns)
Here:
$30,656
State:
$45,393
(% of AGI for various income ranges: 23.9% for AGIs below $25k, 65.8% for AGIs $25k-50k, 196.8% for AGIs $50k-75k, 265.7% for AGIs $75k-100k, 654.6% for AGIs $100k-200k, 4140.6% for AGIs over 200k)
Charity contributions: $10,937 (reported on 3.9% of returns)
Here:
$10,937
State:
$20,178
(% of AGI for various income ranges: 1.4% for AGIs below $25k, 11.1% for AGIs $25k-50k, 35.3% for AGIs $50k-75k, 59.4% for AGIs $75k-100k, 194.2% for AGIs $100k-200k, 1666.1% for AGIs over 200k)
Taxes paid: $5,943 (reported on 4.8% of returns)
32246:
$5,943
State:
$6,967
(% of AGI for various income ranges: 3.3% for AGIs below $25k, 10.3% for AGIs $25k-50k, 34.0% for AGIs $50k-75k, 51.1% for AGIs $75k-100k, 146.0% for AGIs $100k-200k, 753.9% for AGIs over 200k)
Earned income credit: $2,262 (reported on 18.2% of returns)
Here:
$2,262
State:
$2,306
(% of AGI for various income ranges: 105.0% for AGIs below $25k, 61.4% for AGIs $25k-50k, 1.1% for AGIs $50k-75k)
Percentage of individuals using paid preparers for their 2020 taxes: 93.4%
Here:
93%
State:
92%
(% for various income ranges: 92.2% for AGIs below $25k, 94.8% for AGIs $25k-50k, 94.2% for AGIs $50k-75k, 92.9% for AGIs $75k-100k, 93.5% for AGIs $100k-200k, 92.1% for AGIs over 200k)
Averages for the 2012 tax year for zip code 32246, filed in 2013:
Average Adjusted Gross Income (AGI) in 2012: $44,800 (Individual Income Tax Returns)
Here:
$44,800
State:
$60,316
Salary/wage: $42,519 (reported on 88.7% of returns)
Here:
$42,519
State:
$45,277
(% of AGI for various income ranges: 80.3% for AGIs below $25k, 87.6% for AGIs $25k-50k, 85.5% for AGIs $50k-75k, 83.8% for AGIs $75k-100k, 85.6% for AGIs $100k-200k, 72.6% for AGIs over 200k)
Taxable interest for individuals: $570 (reported on 24.1% of returns)
This zip code:
$570
Florida:
$3,587
(% of AGI for various income ranges: 0.5% for AGIs below $25k, 0.3% for AGIs $25k-50k, 0.3% for AGIs $50k-75k, 0.2% for AGIs $75k-100k, 0.2% for AGIs $100k-200k, 0.7% for AGIs over 200k)
Ordinary dividends: $1,909 (reported on 11.4% of returns)
Here:
$1,909
State:
$12,831
(% of AGI for various income ranges: 0.8% for AGIs below $25k, 0.4% for AGIs $25k-50k, 0.4% for AGIs $50k-75k, 0.4% for AGIs $75k-100k, 0.4% for AGIs $100k-200k, 0.6% for AGIs over 200k)
Net capital gain/loss in AGI: +$2,249 (reported on 8.1% of returns)
Here:
+$2,249
State:
+$33,493
(% of AGI for various income ranges: 0.1% for AGIs $25k-50k, 0.2% for AGIs $50k-75k, 0.2% for AGIs $75k-100k, 0.3% for AGIs $100k-200k, 3.3% for AGIs over 200k)
Profit/loss from business: +$7,783 (reported on 14.2% of returns)
Here:
+$7,783
State:
+$10,012
(% of AGI for various income ranges: 9.4% for AGIs below $25k, 2.1% for AGIs $25k-50k, 1.3% for AGIs $50k-75k, 1.4% for AGIs $75k-100k, 1.1% for AGIs $100k-200k, 2.0% for AGIs over 200k)
Taxable individual retirement arrangement distribution: $12,480 (reported on 5.2% of returns)
32246:
$12,480
Florida:
$21,544
(% of AGI for various income ranges: 1.5% for AGIs below $25k, 1.0% for AGIs $25k-50k, 1.5% for AGIs $50k-75k, 1.7% for AGIs $75k-100k, 1.6% for AGIs $100k-200k, 1.7% for AGIs over 200k)
Self-employment retirement plans: $11,750 (reported on 0.1% of returns)
32246:
$11,750
Florida:
$20,611
Total itemized deductions: $17,485 (22% of AGI, reported on 22.7% of returns)
Here:
$17,485
State:
$25,533
Here:
21.9% of AGI
State:
18.0% of AGI
(% of AGI for various income ranges: 6.0% for AGIs below $25k, 7.8% for AGIs $25k-50k, 9.8% for AGIs $50k-75k, 10.4% for AGIs $75k-100k, 10.1% for AGIs $100k-200k, 6.9% for AGIs over 200k)
Charity contributions: $3,470 (reported on 17.9% of returns)
Here:
$3,470
State:
$5,698
(% of AGI for various income ranges: 0.6% for AGIs below $25k, 1.0% for AGIs $25k-50k, 1.5% for AGIs $50k-75k, 1.7% for AGIs $75k-100k, 1.8% for AGIs $100k-200k, 1.5% for AGIs over 200k)
Taxes paid: $3,441 (reported on 22.1% of returns)
32246:
$3,441
State:
$6,203
(% of AGI for various income ranges: 0.9% for AGIs below $25k, 1.2% for AGIs $25k-50k, 1.8% for AGIs $50k-75k, 2.0% for AGIs $75k-100k, 2.2% for AGIs $100k-200k, 2.0% for AGIs over 200k)
Earned income credit: $2,334 (reported on 22.2% of returns)
Here:
$2,334
State:
$2,372
(% of AGI for various income ranges: 7.6% for AGIs below $25k, 1.2% for AGIs $25k-50k)
Percentage of individuals using paid preparers for their 2012 taxes: 42.5%
Here:
43%
State:
54%
(% for various income ranges: 42.7% for AGIs below $25k, 40.3% for AGIs $25k-50k, 42.6% for AGIs $50k-75k, 42.5% for AGIs $75k-100k, 46.1% for AGIs $100k-200k, 66.7% for AGIs over 200k)
Averages for the 2004 tax year for zip code 32246, filed in 2005:
Average Adjusted Gross Income (AGI) in 2004: $38,392 (Individual Income Tax Returns)
Here:
$38,392
State:
$50,523
Salary/wage: $36,676 (reported on 92.2% of returns)
Here:
$36,676
State:
$39,563
(% of AGI for various income ranges: 116.2% for AGIs below $10k, 88.2% for AGIs $10k-25k, 90.5% for AGIs $25k-50k, 88.7% for AGIs $50k-75k, 87.7% for AGIs $75k-100k, 81.2% for AGIs over 100k)
Taxable interest for individuals: $664 (reported on 33.6% of returns)
This zip code:
$664
Florida:
$3,211
(% of AGI for various income ranges: 1.7% for AGIs below $10k, 0.7% for AGIs $10k-25k, 0.5% for AGIs $25k-50k, 0.4% for AGIs $50k-75k, 0.5% for AGIs $75k-100k, 0.8% for AGIs over 100k)
Taxable dividends: $1,021 (reported on 13.4% of returns)
Here:
$1,021
State:
$6,129
(% of AGI for various income ranges: 1.2% for AGIs below $10k, 0.3% for AGIs $10k-25k, 0.2% for AGIs $25k-50k, 0.3% for AGIs $50k-75k, 0.3% for AGIs $75k-100k, 0.6% for AGIs over 100k)
Net capital gain/loss: +$4,305 (reported on 10.2% of returns)
Here:
+$4,305
State:
+$27,205
(% of AGI for various income ranges: 1.3% for AGIs below $10k, -0.1% for AGIs $10k-25k, 0.3% for AGIs $25k-50k, 0.5% for AGIs $50k-75k, 0.6% for AGIs $75k-100k, 4.6% for AGIs over 100k)
Profit/loss from business: +$5,731 (reported on 11.3% of returns)
Here:
+$5,731
State:
+$10,634
(% of AGI for various income ranges: 5.1% for AGIs below $10k, 3.8% for AGIs $10k-25k, 1.3% for AGIs $25k-50k, 1.1% for AGIs $50k-75k, 1.6% for AGIs $75k-100k, 1.5% for AGIs over 100k)
IRA payment deduction: $2,505 (reported on 1.9% of returns)
32246:
$2,505
Florida:
$3,082
(% of AGI for various income ranges: 0.2% for AGIs below $10k, 0.1% for AGIs $10k-25k, 0.2% for AGIs $25k-50k, 0.1% for AGIs $50k-75k, 0.1% for AGIs $75k-100k, 0.1% for AGIs over 100k)
Self-employed pension: $9,917 (reported on 0.1% of returns)
Here:
$9,917
Florida:
$15,857
Total itemized deductions: $15,003 (24% of AGI, reported on 29.6% of returns)
Here:
$15,003
State:
$20,370
Here:
23.9% of AGI
State:
20.7% of AGI
(% of AGI for various income ranges: 9.7% for AGIs below $10k, 7.2% for AGIs $10k-25k, 11.4% for AGIs $25k-50k, 13.3% for AGIs $50k-75k, 13.0% for AGIs $75k-100k, 11.3% for AGIs over 100k)
Charity contributions deductions: $2,799 (4% of AGI, reported on 24.5% of returns)
Here:
$2,799
State:
$4,064
Here:
4.3% of AGI
State:
3.8% of AGI
(% of AGI for various income ranges: 0.6% for AGIs below $10k, 0.8% for AGIs $10k-25k, 1.5% for AGIs $25k-50k, 2.0% for AGIs $50k-75k, 2.2% for AGIs $75k-100k, 2.3% for AGIs over 100k)
Total tax: $4,701 (reported on 75.6% of returns)
32246:
$4,701
State:
$9,431
(% of AGI for various income ranges: 2.8% for AGIs below $10k, 4.0% for AGIs $10k-25k, 6.7% for AGIs $25k-50k, 8.9% for AGIs $50k-75k, 10.6% for AGIs $75k-100k, 16.4% for AGIs over 100k)
Earned income credit: $1,714 (reported on 17.9% of returns)
Here:
$1,714
State:
$1,808
Percentage of individuals using paid preparers for their 2004 taxes: 49.3%
Here:
49%
State:
60%
(% for various income ranges: 46.5% for AGIs below $10k, 53.3% for AGIs $10k-25k, 47.9% for AGIs $25k-50k, 48.3% for AGIs $50k-75k, 47.1% for AGIs $75k-100k, 52.8% for AGIs over 100k)
Likely homosexual households (counted as self-reported same-sex unmarried-partner households)
Lesbian couples: 0.1% of all households
Gay men: 0.1% of all households
Household received Food Stamps/SNAP in the past 12 months: 2,446 Household did not receive Food Stamps/SNAP in the past 12 months: 22,185
Women who had a birth in the past 12 months: 868 (751 now married, 140 unmarried) Women who did not have a birth in the past 12 months: 16,319 (6,816 now married, 9,503 unmarried)
Housing units in zip code 32246 with a mortgage: 10,347 (856 second mortgage, 172 home equity loan, 558 both second mortgage and home equity loan) Houses without a mortgage: 28
Median monthly owner costs for units with a mortgage: $1,669 Median monthly owner costs for units without a mortgage: $488
Residents with income below the poverty level in 2022:
This zip code:
10.9%
Whole state:
12.7%
Residents with income below 50% of the poverty level in 2022:
This zip code:
7.2%
Whole state:
6.6%
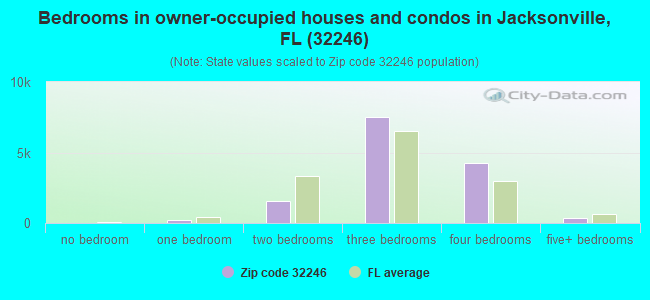
Median number of rooms in houses and condos:
Here:
6.2
State:
5.9
Median number of rooms in apartments:
Here:
4.2
State:
4.2
Notable locations in this zip code not listed on our city pages
Notable locations in zip code 32246: South Gate Plaza (A), Southside Estates Plaza (B), Southwood Plaza (C), Jacksonville Fire and Rescue Department Station 50 (D), Gateway Community Services - The Players Championship Village Addiction Facility (E), Pablo Creek Regional Library (F), Jacksonville Fire Training Division (G). Display/hide their locations on the map
Shopping Centers: Rengency Park Mall Shopping Center (1), University Mall (2), Standard Plaza Shopping Center (3), South Side Estates Shopping Center (4), Santa Monica Shopping Center (5). Display/hide their locations on the map
Churches in zip code 32246 include: Anniston Road Church (A), Newlife Evangelistic Center (B), Regency Church of God (C), Harmony Community Church (D), Greater Works Temple of Deliverance Church of God in Christ (E), Brookview Church (F), Titus Harvest Center (G), Titus Shekinah Evangelistic Harvest Dome Church (H), Blessed Trinity Church (I). Display/hide their locations on the map
Swamps: Tiger Hole Swamp (A), Second Puncheon Branch (B), Big Island Swamp (C), Wolf Bay (D), Third Puncheon Branch (E). Display/hide their locations on the map
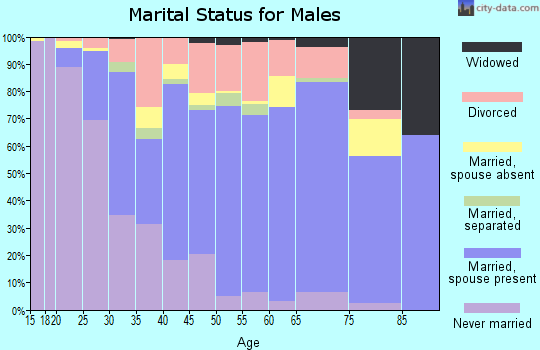
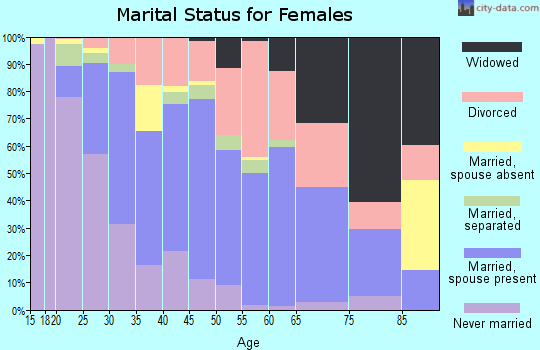
8,412 married couples with children.
3,947 single-parent households (566 men, 3,381 women).
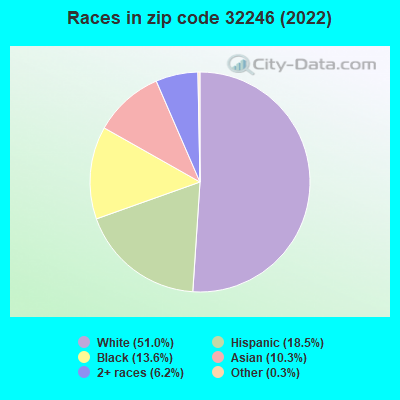
70.9% of residents of 32246 zip code speak English at home.
12.9% of residents speak Spanish at home (50% very well, 26% well, 18% not well, 6% not at all).
7.8% of residents speak other Indo-European language at home (68% very well, 19% well, 13% not well).
6.3% of residents speak Asian or Pacific Island language at home (64% very well, 25% well, 9% not well, 2% not at all).
1.6% of residents speak other language at home (25% very well, 75% well).
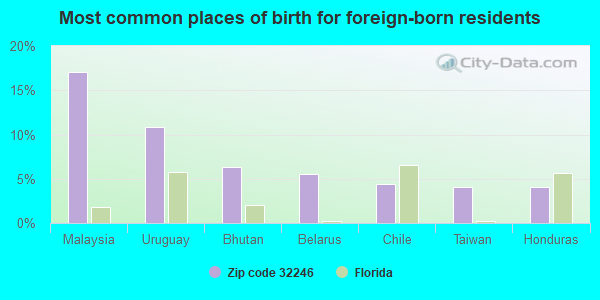
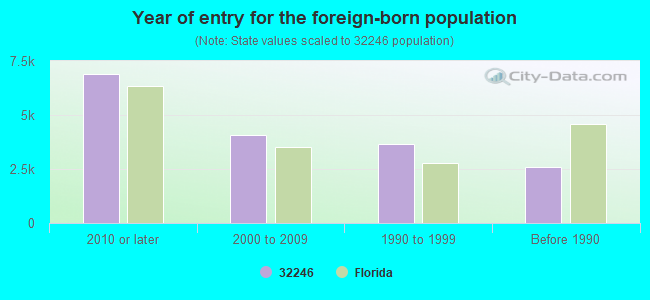
Foreign born population: 14,035 (23.3%) (64.0% of them are naturalized citizens)
Major facilities with environmental interests located in this zip code:
A J JOHNS INC (3225 ANNISTON ROAD in JACKSONVILLE, FL)
STATE MASTER (FDM) - WAFR-FLA016522, INDUSTRIAL WASTEWATER PROGRAM National Pollutant Discharge Elimination System NON-MAJOR (Tracking pollutant discharge elimination systems) - permit Business SIC classification: HIGHWAY AND STREET CONSTRUCTION, EXCEPT ELEVATED HIGHWAYS; WATER, SEWER, PIPELINE, AND COMMUNICATIONS AND POWER LINE CONSTRUCTION; HEAVY CONSTRUCTION; CONCRETE WORK Organizations: A.J. JOHN S INC, A.J. JOHNS INC, KEVIN CORMIER (CONTACT/OWNER)
, A.J. JOHN S INC (CONTACT/PERMIT)
, A.J. JOHNS INC (CONTACT/PERMIT)
Alternative names: A J JOHNS DEWATERING PROJECT
ARIZONA CHEMICAL COMPANY (4600 TOUCHTON ROAD, EAST, SUITE 500 in JACKSONVILLE, FL)
ENFORCEMENT/COMPLIANCE ACTIVITY (Integrated Compliance Information System) - ICIS-HQ-2004-5010, FORMAL ENFORCEMENT ACTION, ICIS-HQ-2004-5014, (Integrated Compliance Information System) - ICIS-HQ-2004-5010, FORMAL ENFORCEMENT ACTION, ICIS-HQ-2004-5014, COMPLIANCE ACTIVITY (Tracking inspections of insecticide, fungicide, and rodenticide, and toxic substances)
AUTOCRAFTERS COLLISION REPAIR (1638 DEBUTANTE DR in JACKSONVILLE, FL)
STATE MASTER (FDM) - CHAZ-FLD982117046, HAZARDOUS WASTE REGULATION PROGRAM Small Quantity Generators, between 100 kg and 1000 kg of hazardous waste/month (Resource Conservation and Recovery Act (tracking hazardous waste)) - notification Business SIC classification: TOP, BODY, AND UPHOLSTERY REPAIR SHOPS AND PAINT SHOPS Business NAICS classification: AUTOMOTIVE BODY, PAINT, AND INTERIOR REPAIR AND MAINTENANCE. Organizations: COLLISION TEAM OF FLORIDA LLC (CONTACT/OWNER)
Alternative names: AUTOCRAFTERS INTERNATIONAL IV
GONZALEZ AUTOMOTIVE (9848 BEACH BLVD in JACKSONVILLE, FL)
AIR MINOR (AIRS/AFS) (Integrated Compliance Information System) - ICIS-04-1999-0185, FORMAL ENFORCEMENT ACTION Business SIC classification: GENERAL AUTOMOTIVE REPAIR SHOPS
MERCEDES SHELL AUTO CARE (11430 BEACH BLVD in JACKSONVILLE, FL)
AIR MINOR (AIRS/AFS) (Integrated Compliance Information System) - ICIS-04-1999-0220, FORMAL ENFORCEMENT ACTION Business SIC classification: GASOLINE SERVICE STATIONS; GENERAL AUTOMOTIVE REPAIR SHOPS
SOUTHSIDE ESTATES ELEMENTARY SCHOOL (9775 IVEY RD in JACKSONVILLE, FL)
(Geographic Names Information System) (National Center for Education Statistics) - STATE ID-0761 Organizations: DUVAL COUNTY SCHOOL DISTRICT (SCHOOL DISTRICT)
SANDALWOOD HIGH SCHOOL (2750 JOHN PROM BLVD in JACKSONVILLE, FL)
(National Center for Education Statistics) - STATE ID-2371 Organizations: DUVAL COUNTY SCHOOL DISTRICT (SCHOOL DISTRICT)
PRO AUTO BODY & PAINT INC (10230 BEACH BLVD in JACKSONVILLE, FL)
(Resource Conservation and Recovery Act (tracking hazardous waste)) Organizations: DONALD RENTFROW (CONTACT/OWNER)
, WILLIAM JOHNSON (CONTACT/OWNER)
Alternative names: GUN GALLERY
KERNAN MIDDLE SCHOOL (2271 KERNAN BLVD., SOUTH in JACKSONVILLE, FL)
(National Center for Education Statistics) - STATE ID-2791 Organizations: DUVAL COUNTY SCHOOL DISTRICT (SCHOOL DISTRICT)
KERNAN TRAIL ELEMENTARY SCHOOL (2281 KERNAN BLVD., SOUTH in JACKSONVILLE, FL)
(National Center for Education Statistics) - STATE ID-2311 Organizations: DUVAL COUNTY SCHOOL DISTRICT (SCHOOL DISTRICT)
JACKSONVILLE MARINE INSTITUTE - EAST (13375 BEACH BOULEVARD in JACKSONVILLE, FL)
(National Center for Education Statistics) - STATE ID-1851 Organizations: DUVAL COUNTY SCHOOL DISTRICT (SCHOOL DISTRICT)
AMERICA ON LINE JACKSONVILLE (1 IMESON PARK BOULEVARD in JACKSONVILLE, FL)
National Pollutant Discharge Elimination System NON-MAJOR (Tracking pollutant discharge elimination systems) - permit National Pollutant Discharge Elimination System NON-MAJOR (Tracking pollutant discharge elimination systems) - permit Alternative names: AMERICA ONLINE CALL CENTER, BARCO DUVAL ENGINEERING INC, ELKINS CONSTRUCTORS INC
PEACH CENTER (10095 BEACH BLVD. in JACKSONVILLE, FL)
National Pollutant Discharge Elimination System NON-MAJOR (Tracking pollutant discharge elimination systems) - permit Organizations: RICHARD HICKMAN (CONTACT/OWNER)
Housing units lacking complete plumbing facilities: 0.3% Housing units lacking complete kitchen facilities: 0.6%
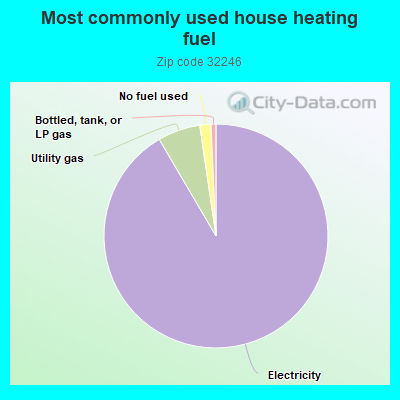
91.1%Electricity
6.1%Utility gas
1.6%No fuel used
0.7%Bottled, tank, or LP gas
Place of birth for U.S.-born residents:
This state: 20,401
Northeast: 5,877
Midwest: 5,015
South: 9,604
West: 2,419
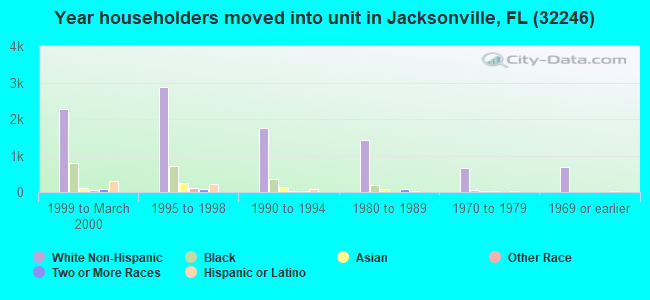
49% of the 32246 zip code residents lived in the same house 5 years ago. Out of people who lived in different houses, 55% lived in this county. Out of people who lived in different counties, 50% lived in Florida.
84% of the 32246 zip code residents lived in the same house 1 year ago. Out of people who lived in different houses, 50% moved from this county. Out of people who lived in different houses, 21% moved from different county within same state. Out of people who lived in different houses, 21% moved from different state. Out of people who lived in different houses, 3% moved from abroad.
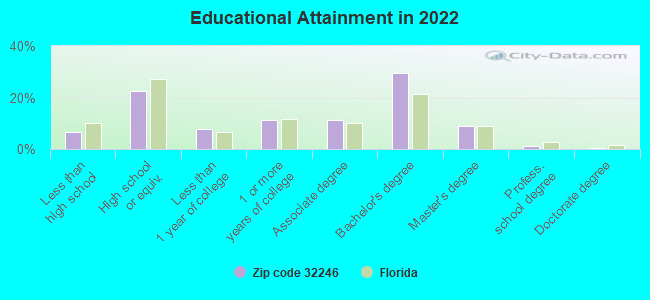
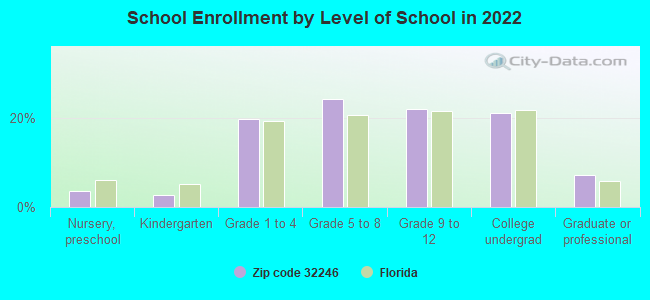
Private vs. public school enrollment:
Students in private schools in grades 1 to 8 (elementary and middle school): 606
Here:
10.1%
Florida:
15.8%
Students in private schools in grades 9 to 12 (high school): 186
Here:
6.2%
Florida:
12.9%
Students in private undergraduate colleges: 537
Here:
18.7%
Florida:
23.6%
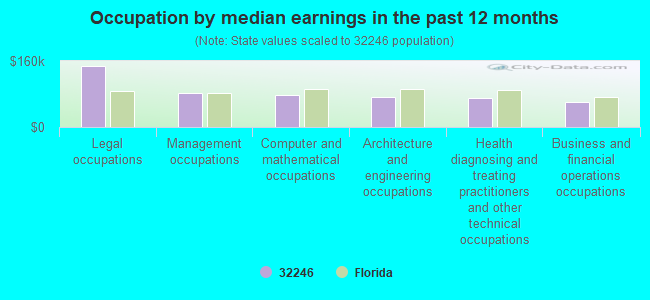
Occupation by median earnings in the past 12 months ($)
149,072Legal occupations
82,138Management occupations
78,465Computer and mathematical occupations
73,262Architecture and engineering occupations
70,734Health diagnosing and treating practitioners and other technical occupations
60,281Business and financial operations occupations
Companies with biggest federal contracts located in this zip code (JACKSONVILLE, FL):
WARDEN CONSTRUCTION CORPORATIO (11221 SAINT JOHNS INDUSTRI; small business) : $14,524,279 in 348 contractsfrom 2001 to 2006
Contracts for Construction of Structures and Facilities -- Other Administrative Facilities and Service Buildings, Construction of Structures and Facilities -- Other Non-Building Facilities, Warehousing and Storage Services, Maintenance, Repair or Alteration of Real Property -- Other Administrative Facilities and Service Buildings, and moreby Army, Air Force, Federal Law Enforcement Training Center, National Park Service, and others Signed by year:2000: $0; 2001: $796,535; 2002: $3,382,796; 2003: $2,572,949; 2004: $2,358,317; 2005: $2,009,852; 2006: $3,403,830.
Biggest contracts:
$1,422,392 with Army for Construction of Structures and Facilities -- Other Administrative Facilities and Service Buildings. Taking place in GA. Signed on 2006-03-28. Completion date: 2007-01-08.
$1,126,918 with Army for Construction of Structures and Facilities -- Other Non-Building Facilities. Taking place in CO. Signed on 2002-08-01. Completion date: 2003-04-28.
$641,996 with Air Force for Warehousing and Storage Services. Taking place in AL. Signed on 2002-10-01. Completion date: 2003-09-30.
$600,000 with Federal Law Enforcement Training Center for Maintenance, Repair or Alteration of Real Property -- Other Administrative Facilities and Service Buildings. Taking place in NM. Signed on 2003-09-15. Completion date: 2004-02-15.
AEROSTAR ENVIRONMENTAL SERVICE (11181 ST JOHNS INDSTRL PA; small business) : $8,376,467 in 84 contractsfrom 2002 to 2006
Contracts for Purchase of Structures and Facilities -- Restoration of real property, Other Environmental Services, Studies, and Analytical Support, Hazardous Substance Analysis, Restoration, and moreby Army, Navy, U.S. Army Corps of Engineers - civil program financing only, Public Buildings Service, and others Signed by year:2000: $0; 2001: $0; 2002: $8,611; 2003: $263,783; 2004: $3,466,589; 2005: $3,019,132; 2006: $1,618,352.
Biggest contracts:
$1,369,680 with Army for Purchase of Structures and Facilities -- Restoration of real property. Taking place in CA. Signed on 2004-12-02. Completion date: 2005-05-31.
$939,579 with Army for Other Environmental Services, Studies, and Analytical Support. Taking place in NC. Signed on 2004-03-12. Completion date: 2004-11-01.
$571,634, same as above.Signed on 2005-08-30. Completion date: 2006-03-16.
$557,987 with Army for Hazardous Substance Analysis. Taking place in MS. Signed on 2005-03-15. Completion date: 2005-11-30.
WOLF TECHNOLOGIES, INCORPORATE (3047-4 ST JOHNS BLUFF ROA; small business) : $1,490,364 in 191 contractsfrom 2001 to 2006
Contracts for Architect - Engineer Services (including landscaping, interior layout, and designing), Other Architect and Engineering Services, Laboratory Testing Services, Marine Architect and Engineering Services, and moreby U.S. Army Corps of Engineers - civil program financing only, Army, Federal Emergency Management Agency Signed by year:2000: $0; 2001: $52,646; 2002: $31,049; 2003: $199,679; 2004: $303,712; 2005: $767,526; 2006: $135,752.
Biggest contracts:
$144,326 with U.S. Army Corps of Engineers - civil program financing only for Architect - Engineer Services (including landscaping, interior layout, and designing). Signed on 2005-08-21. Completion date: 2006-02-23.
$144,326 with Army for Architect - Engineer Services (including landscaping, interior layout, and designing). Signed on 2005-08-21. Completion date: 2006-02-23.
$78,300 with U.S. Army Corps of Engineers - civil program financing only for Architect - Engineer Services (including landscaping, interior layout, and designing). Signed on 2003-02-12. Completion date: 2003-05-13.
$67,642, same as above.Signed on 2005-02-10. Completion date: 2005-04-29.
CIVIL SERVICES INC (2394 SAINT JOHNS BLUFF RD; small business) : $1,062,768 in 28 contractsfrom 2001 to 2005
Contracts for Architect - Engineer Services (including landscaping, interior layout, and designing), Other Architect and Engineering Services by U.S. Army Corps of Engineers - civil program financing only, Army, Navy Signed by year:2000: $0; 2001: $123,922; 2002: $40,000; 2003: $118,934; 2004: $351,000; 2005: $428,912; 2006: $0.
Biggest contracts:
$116,000 with U.S. Army Corps of Engineers - civil program financing only for Architect - Engineer Services (including landscaping, interior layout, and designing). Signed on 2004-07-10. Completion date: 2004-12-31.
$116,000 with Army for Architect - Engineer Services (including landscaping, interior layout, and designing). Signed on 2004-07-10. Completion date: 2004-12-31.
$98,000, same as above.Signed on 2004-07-08. Completion date: 2005-01-31.
$98,000 with U.S. Army Corps of Engineers - civil program financing only for Architect - Engineer Services (including landscaping, interior layout, and designing). Signed on 2004-07-08. Completion date: 2005-01-31.
MANUEL G CANINO (2209 WINDING CREEK LN; small business) : $542,057 in 6 contractsfrom 1999 to 2003
Contracts for Dentistry Services by Navy Signed by year:2000: $88,155; 2001: $90,771; 2002: $93,856; 2003: $97,045; 2004: $0; 2005: $0; 2006: $0.
Biggest contracts:
$97,045 with Navy for Dentistry Services. Signed on 2003-10-01. Completion date: 2004-09-30.
$93,856, same as above.Signed on 2002-10-01. Completion date: 2003-09-30.
$90,771, same as above.Signed on 2001-10-01. Completion date: 2001-09-30.
$88,155, same as above.Signed on 2000-10-25. Completion date: 2001-09-30.
TIVOLI AT DEERWOOD (10075 GATE PKWY N APT 712; small business) : $365,261 in 3 contractsin 2005
$328,341 with Navy for Lodging - Hotel/Motel. Signed on 2005-03-22. Completion date: 2006-04-30.
$25,640, same as above.Signed on 2005-09-22. Completion date: 2006-04-30.
$11,280, same as above.Signed on 2005-04-26. Completion date: 2006-04-30.
MOTT, ANN (10135 GATE PKWY N #816; small business) : $204,486 in 4 contractsfrom 2004 to 2005
$96,262 with Navy for General Health Care Services. Signed on 2005-10-01. Completion date: 2006-09-30.
$92,916, same as above.Signed on 2004-12-23. Completion date: 2005-09-30.
$15,664, same as above.Signed on 2004-07-12. Completion date: 2004-09-30.
-$356, same as above.Signed on 2005-04-29. Completion date: 2005-09-30.
AMERITAPE INC (11236-100 ST JOHNS INDUSTR; small business) : $169,696 in 3 contractsfrom 2001 to 2005
$89,718 with Defense Logistics Agency for Rubber Fabricated Materials. Signed on 2005-01-24. Completion date: 2005-03-15.
$46,498 with Navy for Office Supplies. Signed on 2003-05-21. Completion date: 2003-05-28.
$33,480 with Defense Logistics Agency for Electrical Insulators and Insulating Materials. Signed on 2001-12-08. Completion date: 2002-01-07.
MC QUEEN, YVETTE M (1971 HOLLINGTON DR; small business)
$100,000 with Navy for Other Medical Services. Signed on 2006-05-16. Completion date: 2006-09-30.
MENDOZA, JOREY (9727 TOUCHTON RD; small business) : $60,901 in 2 contractsin 2005
$36,421 with Navy for Other Medical Services. Signed on 2005-10-01. Completion date: 2006-09-30.
$24,480, same as above.Signed on 2005-01-21. Completion date: 2005-09-30.
Top industries in this zip code by the number of employees in 2005:
2007 - 2018 National Fire Incident Reporting System (NFIRS) incidents
According to the data from the years 2007 - 2018 the average number of fire incidents per year is 88. The highest number of fire incidents - 124 took place in 2007, and the least - 60 in 2014. The data has a declining trend.
When looking into fire subcategories, the most reports belonged to: Outside Fires (52.4%), and Structure Fires (22.6%).
Fire incident types reported to NFIRS in Zip Code 32246

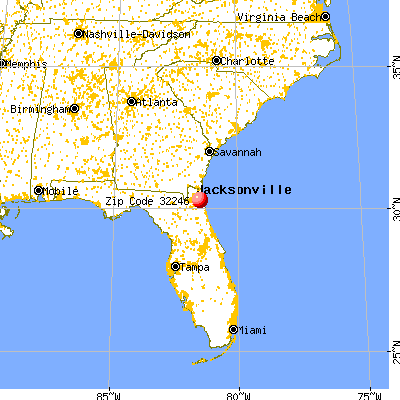


 Nearest zip codes: 32224, 32225, 32216, 32211, 32250, 32266.
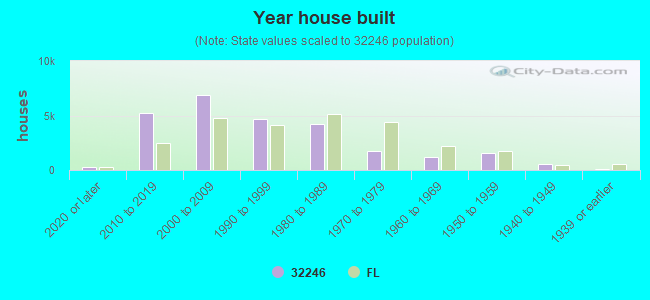


 According to the data from the years 2007 - 2018 the average number of fire incidents per year is 88. The highest number of fire incidents - 124 took place in 2007, and the least - 60 in 2014. The data has a declining trend.
 When looking into fire subcategories, the most reports belonged to: Outside Fires (52.4%), and Structure Fires (22.6%).