Estimated zip code population in 2022: 36,874 Zip code population in 2010: 30,501 Zip code population in 2000: 34,475
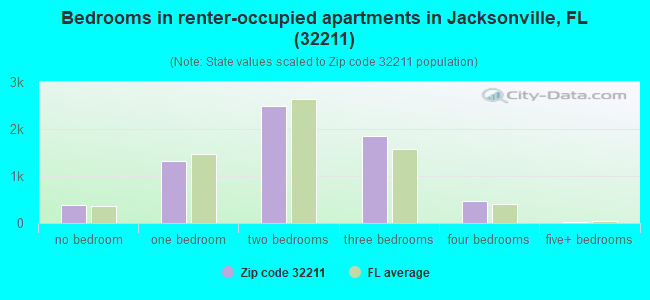
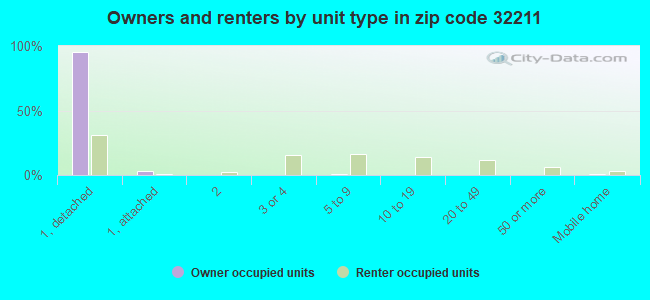
Houses and condos: 15,556 Renter-occupied apartments: 6,517
% of renters here:
46%
State:
33%
March 2022 cost of living index in zip code 32211: 87.8 (less than average, U.S. average is 100)
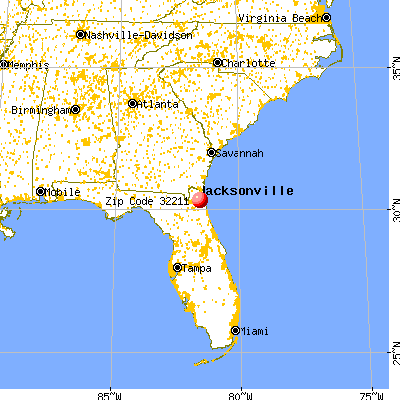
Land area: 8.2 sq. mi. Water area: 0.9 sq. mi.
Population density: 4,477 people per square mile
(average).
OSM Map
General Map
Google Map
MSN Map
OSM Map
General Map
Google Map
MSN Map
OSM Map
General Map
Google Map
MSN Map
OSM Map
General Map
Google Map
MSN Map
Please wait while loading the map...
Real estate property taxes paid for housing units in 2022:
This zip code:
0.6% ($1,388)
Florida:
0.7% ($2,529)
Median real estate property taxes paid for housing units with mortgages in 2022: $1,620 (0.7%) Median real estate property taxes paid for housing units with no mortgage in 2022: $1,116 (0.6%)
Averages for the 2020 tax year for zip code 32211, filed in 2021:
Average Adjusted Gross Income (AGI) in 2020: $39,607 (Individual Income Tax Returns)
Here:
$39,607
State:
$82,200
Salary/wage: $36,694 (reported on 85.1% of returns)
Here:
$36,694
State:
$58,347
(% of AGI for various income ranges: 1239.2% for AGIs below $25k, 3834.7% for AGIs $25k-50k, 7008.5% for AGIs $50k-75k, 10081.8% for AGIs $75k-100k, 16360.6% for AGIs $100k-200k, 61140.0% for AGIs over 200k)
Taxable interest for individuals: $989 (reported on 15.1% of returns)
This zip code:
$989
Florida:
$4,272
(% of AGI for various income ranges: 6.4% for AGIs below $25k, 7.0% for AGIs $25k-50k, 27.9% for AGIs $50k-75k, 42.6% for AGIs $75k-100k, 156.7% for AGIs $100k-200k, 657.5% for AGIs over 200k)
Ordinary dividends: $4,254 (reported on 7.4% of returns)
Here:
$4,254
State:
$15,863
(% of AGI for various income ranges: 5.5% for AGIs below $25k, 11.0% for AGIs $25k-50k, 34.8% for AGIs $50k-75k, 80.9% for AGIs $75k-100k, 271.7% for AGIs $100k-200k, 4880.0% for AGIs over 200k)
Net capital gain/loss in AGI: +$11,353 (reported on 6.6% of returns)
Here:
+$11,353
State:
+$62,983
(% of AGI for various income ranges: 3.1% for AGIs below $25k, 10.3% for AGIs $25k-50k, 51.5% for AGIs $50k-75k, 129.4% for AGIs $75k-100k, 610.0% for AGIs $100k-200k, 17350.0% for AGIs over 200k)
Profit/loss from business: +$5,961 (reported on 19.7% of returns)
Here:
+$5,961
State:
+$9,719
(% of AGI for various income ranges: 149.0% for AGIs below $25k, 120.2% for AGIs $25k-50k, 134.9% for AGIs $50k-75k, 205.9% for AGIs $75k-100k, 322.8% for AGIs $100k-200k, 897.5% for AGIs over 200k)
Taxable individual retirement arrangement distribution: $14,243 (reported on 4.5% of returns)
32211:
$14,243
Florida:
$24,823
(% of AGI for various income ranges: 21.5% for AGIs below $25k, 40.3% for AGIs $25k-50k, 120.5% for AGIs $50k-75k, 195.5% for AGIs $75k-100k, 619.3% for AGIs $100k-200k, 3077.5% for AGIs over 200k)
Total itemized deductions: $28,731 (reported on 2.9% of returns)
Here:
$28,731
State:
$45,393
(% of AGI for various income ranges: 15.1% for AGIs below $25k, 63.4% for AGIs $25k-50k, 197.9% for AGIs $50k-75k, 271.1% for AGIs $75k-100k, 674.6% for AGIs $100k-200k, 5182.5% for AGIs over 200k)
Charity contributions: $11,600 (reported on 2.2% of returns)
Here:
$11,600
State:
$20,178
(% of AGI for various income ranges: 2.0% for AGIs below $25k, 16.0% for AGIs $25k-50k, 47.6% for AGIs $50k-75k, 72.6% for AGIs $75k-100k, 187.2% for AGIs $100k-200k, 2922.5% for AGIs over 200k)
Taxes paid: $4,356 (reported on 2.7% of returns)
32211:
$4,356
State:
$6,967
(% of AGI for various income ranges: 1.9% for AGIs below $25k, 7.6% for AGIs $25k-50k, 27.2% for AGIs $50k-75k, 42.7% for AGIs $75k-100k, 96.5% for AGIs $100k-200k, 787.5% for AGIs over 200k)
Earned income credit: $2,519 (reported on 30.6% of returns)
Here:
$2,519
State:
$2,306
(% of AGI for various income ranges: 150.2% for AGIs below $25k, 88.3% for AGIs $25k-50k, 1.8% for AGIs $50k-75k)
Percentage of individuals using paid preparers for their 2020 taxes: 93.2%
Here:
93%
State:
92%
(% for various income ranges: 93.2% for AGIs below $25k, 93.7% for AGIs $25k-50k, 93.2% for AGIs $50k-75k, 92.9% for AGIs $75k-100k, 92.6% for AGIs $100k-200k, 86.7% for AGIs over 200k)
Averages for the 2012 tax year for zip code 32211, filed in 2013:
Average Adjusted Gross Income (AGI) in 2012: $33,197 (Individual Income Tax Returns)
Here:
$33,197
State:
$60,316
Salary/wage: $29,616 (reported on 85.9% of returns)
Here:
$29,616
State:
$45,277
(% of AGI for various income ranges: 80.8% for AGIs below $25k, 86.4% for AGIs $25k-50k, 77.7% for AGIs $50k-75k, 73.4% for AGIs $75k-100k, 69.6% for AGIs $100k-200k, 43.8% for AGIs over 200k)
Taxable interest for individuals: $1,223 (reported on 18.4% of returns)
This zip code:
$1,223
Florida:
$3,587
(% of AGI for various income ranges: 0.5% for AGIs below $25k, 0.5% for AGIs $25k-50k, 0.7% for AGIs $50k-75k, 0.6% for AGIs $75k-100k, 1.2% for AGIs $100k-200k, 1.0% for AGIs over 200k)
Ordinary dividends: $4,008 (reported on 9.3% of returns)
Here:
$4,008
State:
$12,831
(% of AGI for various income ranges: 0.7% for AGIs below $25k, 0.8% for AGIs $25k-50k, 0.9% for AGIs $50k-75k, 1.2% for AGIs $75k-100k, 1.9% for AGIs $100k-200k, 2.5% for AGIs over 200k)
Net capital gain/loss in AGI: +$4,473 (reported on 6.1% of returns)
Here:
+$4,473
State:
+$33,493
(% of AGI for various income ranges: 0.2% for AGIs $25k-50k, 0.3% for AGIs $50k-75k, 0.7% for AGIs $75k-100k, 1.0% for AGIs $100k-200k, 6.5% for AGIs over 200k)
Profit/loss from business: +$6,412 (reported on 15.5% of returns)
Here:
+$6,412
State:
+$10,012
(% of AGI for various income ranges: 8.5% for AGIs below $25k, 1.0% for AGIs $25k-50k, 0.9% for AGIs $50k-75k, 1.4% for AGIs $75k-100k, 4.1% for AGIs $100k-200k)
Taxable individual retirement arrangement distribution: $13,028 (reported on 6.0% of returns)
32211:
$13,028
Florida:
$21,544
(% of AGI for various income ranges: 1.4% for AGIs below $25k, 1.4% for AGIs $25k-50k, 2.2% for AGIs $50k-75k, 3.6% for AGIs $75k-100k, 3.5% for AGIs $100k-200k, 5.0% for AGIs over 200k)
Total itemized deductions: $17,263 (25% of AGI, reported on 15.5% of returns)
Here:
$17,263
State:
$25,533
Here:
25.5% of AGI
State:
18.0% of AGI
(% of AGI for various income ranges: 5.3% for AGIs below $25k, 8.1% for AGIs $25k-50k, 9.0% for AGIs $50k-75k, 9.3% for AGIs $75k-100k, 10.4% for AGIs $100k-200k, 7.7% for AGIs over 200k)
Charity contributions: $4,613 (reported on 11.9% of returns)
Here:
$4,613
State:
$5,698
(% of AGI for various income ranges: 0.7% for AGIs below $25k, 1.4% for AGIs $25k-50k, 1.7% for AGIs $50k-75k, 2.2% for AGIs $75k-100k, 2.7% for AGIs $100k-200k, 2.5% for AGIs over 200k)
Taxes paid: $2,890 (reported on 14.8% of returns)
32211:
$2,890
State:
$6,203
(% of AGI for various income ranges: 0.6% for AGIs below $25k, 1.2% for AGIs $25k-50k, 1.4% for AGIs $50k-75k, 1.5% for AGIs $75k-100k, 1.9% for AGIs $100k-200k, 2.1% for AGIs over 200k)
Earned income credit: $2,578 (reported on 35.4% of returns)
Here:
$2,578
State:
$2,372
(% of AGI for various income ranges: 10.8% for AGIs below $25k, 1.4% for AGIs $25k-50k)
Percentage of individuals using paid preparers for their 2012 taxes: 44.9%
Here:
45%
State:
54%
(% for various income ranges: 45.6% for AGIs below $25k, 42.0% for AGIs $25k-50k, 44.4% for AGIs $50k-75k, 44.8% for AGIs $75k-100k, 51.0% for AGIs $100k-200k, 77.8% for AGIs over 200k)
Averages for the 2004 tax year for zip code 32211, filed in 2005:
Average Adjusted Gross Income (AGI) in 2004: $31,675 (Individual Income Tax Returns)
Here:
$31,675
State:
$50,523
Salary/wage: $28,490 (reported on 88.2% of returns)
Here:
$28,490
State:
$39,563
(% of AGI for various income ranges: 97.2% for AGIs below $10k, 87.5% for AGIs $10k-25k, 86.4% for AGIs $25k-50k, 79.9% for AGIs $50k-75k, 75.2% for AGIs $75k-100k, 55.7% for AGIs over 100k)
Taxable interest for individuals: $1,671 (reported on 28.1% of returns)
This zip code:
$1,671
Florida:
$3,211
(% of AGI for various income ranges: 2.6% for AGIs below $10k, 1.0% for AGIs $10k-25k, 0.8% for AGIs $25k-50k, 1.5% for AGIs $50k-75k, 2.0% for AGIs $75k-100k, 2.5% for AGIs over 100k)
Taxable dividends: $2,395 (reported on 12.2% of returns)
Here:
$2,395
State:
$6,129
(% of AGI for various income ranges: 1.3% for AGIs below $10k, 0.6% for AGIs $10k-25k, 0.5% for AGIs $25k-50k, 1.0% for AGIs $50k-75k, 1.2% for AGIs $75k-100k, 1.7% for AGIs over 100k)
Net capital gain/loss: +$8,666 (reported on 9.3% of returns)
Here:
+$8,666
State:
+$27,205
(% of AGI for various income ranges: -0.7% for AGIs below $10k, -0.1% for AGIs $10k-25k, 0.5% for AGIs $25k-50k, 0.7% for AGIs $50k-75k, 2.5% for AGIs $75k-100k, 12.1% for AGIs over 100k)
Profit/loss from business: +$6,328 (reported on 9.8% of returns)
Here:
+$6,328
State:
+$10,634
(% of AGI for various income ranges: 4.0% for AGIs below $10k, 3.1% for AGIs $10k-25k, 1.5% for AGIs $25k-50k, 0.7% for AGIs $50k-75k, 0.9% for AGIs $75k-100k, 3.4% for AGIs over 100k)
IRA payment deduction: $2,410 (reported on 1.7% of returns)
32211:
$2,410
Florida:
$3,082
(% of AGI for various income ranges: 0.1% for AGIs $10k-25k, 0.2% for AGIs $25k-50k, 0.1% for AGIs $50k-75k, 0.1% for AGIs $75k-100k, 0.2% for AGIs over 100k)
Self-employed pension: $9,056 (reported on 0.1% of returns)
Here:
$9,056
Florida:
$15,857
Total itemized deductions: $14,844 (25% of AGI, reported on 18.7% of returns)
Here:
$14,844
State:
$20,370
Here:
24.8% of AGI
State:
20.7% of AGI
(% of AGI for various income ranges: 4.0% for AGIs below $10k, 5.8% for AGIs $10k-25k, 8.9% for AGIs $25k-50k, 9.9% for AGIs $50k-75k, 10.7% for AGIs $75k-100k, 10.0% for AGIs over 100k)
Charity contributions deductions: $3,816 (6% of AGI, reported on 15.9% of returns)
Here:
$3,816
State:
$4,064
Here:
6.0% of AGI
State:
3.8% of AGI
(% of AGI for various income ranges: 0.3% for AGIs below $10k, 0.9% for AGIs $10k-25k, 1.6% for AGIs $25k-50k, 2.2% for AGIs $50k-75k, 2.7% for AGIs $75k-100k, 3.0% for AGIs over 100k)
Total tax: $4,155 (reported on 66.4% of returns)
32211:
$4,155
State:
$9,431
(% of AGI for various income ranges: 1.9% for AGIs below $10k, 3.5% for AGIs $10k-25k, 6.5% for AGIs $25k-50k, 9.0% for AGIs $50k-75k, 10.8% for AGIs $75k-100k, 18.2% for AGIs over 100k)
Earned income credit: $1,891 (reported on 27.4% of returns)
Here:
$1,891
State:
$1,808
Percentage of individuals using paid preparers for their 2004 taxes: 55.4%
Here:
55%
State:
60%
(% for various income ranges: 52.8% for AGIs below $10k, 60.3% for AGIs $10k-25k, 52.8% for AGIs $25k-50k, 50.5% for AGIs $50k-75k, 50.5% for AGIs $75k-100k, 66.2% for AGIs over 100k)
Likely homosexual households (counted as self-reported same-sex unmarried-partner households)
Lesbian couples: 0.3% of all households
Gay men: 0.1% of all households
Household received Food Stamps/SNAP in the past 12 months: 3,144 Household did not receive Food Stamps/SNAP in the past 12 months: 11,060
Women who had a birth in the past 12 months: 656 (330 now married, 312 unmarried) Women who did not have a birth in the past 12 months: 8,197 (2,959 now married, 5,236 unmarried)
Housing units in zip code 32211 with a mortgage: 4,695 (267 second mortgage, 30 home equity loan, 140 both second mortgage and home equity loan) Houses without a mortgage: 53
Median monthly owner costs for units with a mortgage: $1,351 Median monthly owner costs for units without a mortgage: $433
Residents with income below the poverty level in 2022:
This zip code:
16.5%
Whole state:
12.7%
Residents with income below 50% of the poverty level in 2022:
This zip code:
9.0%
Whole state:
6.6%
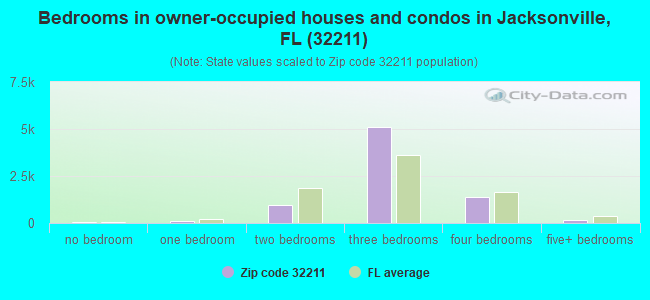
Median number of rooms in houses and condos:
Here:
6.3
State:
5.9
Median number of rooms in apartments:
Here:
4.7
State:
4.2
Notable locations in this zip code not listed on our city pages
Notable locations in zip code 32211: Jacksonville Christian Arts Center (A), Arlington Heights (B), Stevens Point Plaza (C), Regency Pointe Plaza (D), Be the Light Christian Conference Center (E), Concord Baptist Christian Family Center (F), Jacksonville Fire and Rescue Department Station 19 (G), Jacksonville Event Center (H). Display/hide their locations on the map
Churches in zip code 32211 include: Arlington Alliance Church (A), Jacksonville Campus Ministry (B), Iglesia ni Cristo Church of Christ (C), Redeemed Christian Church of God (D), Reorganized Church of Jesus Christ of Latter Day Saints (E), Saint Lukes Episcopal Church (F), Saint Paul United Methodist Church (G), Varick African Methodist Episcopal Zion Church (H), Victory Chapel Christian Fellowship Church (I). Display/hide their locations on the map
Parks in zip code 32211 include: Bruce Park (1), Memorial Park (2), Tree Hill Park (3), Saratoga Island Park (4), Exchange Club Park (5), Arlingwood Playground (6), Saratoga Island Park (7), Parkwood Heights Park (8). Display/hide their locations on the map
Tourist attraction (not listed on the city page) : Coleman Music CO (Amusement & Theme Parks; 9020 Berry Avenue).
3,411 married couples with children.
4,565 single-parent households (1,540 men, 3,025 women).
80.8% of residents of 32211 zip code speak English at home.
12.1% of residents speak Spanish at home (60% very well, 17% well, 13% not well, 10% not at all).
3.1% of residents speak other Indo-European language at home (53% very well, 21% well, 19% not well, 7% not at all).
2.3% of residents speak Asian or Pacific Island language at home (76% very well, 24% well).
1.2% of residents speak other language at home (82% very well, 11% well, 6% not well).
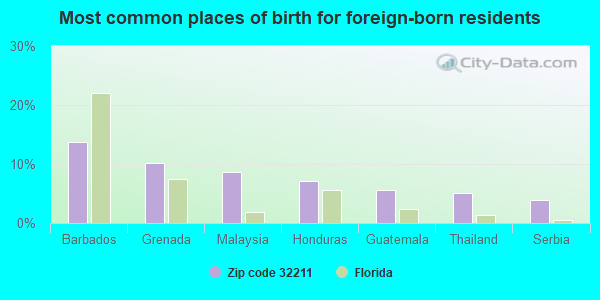
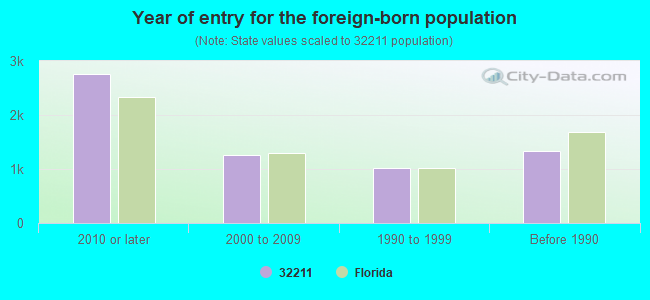
Foreign born population: 4,841 (13.1%) (54.5% of them are naturalized citizens)
Major facilities with environmental interests located in this zip code:
MONTEREY WRF (5802 HARRIS AVENUE in JACKSONVILLE, FL)
STATE MASTER (FDM) - WAFR-FL0023604, DOMESTIC WASTEWATER PROGRAM, WAFR-FLR05F624, NPDES STORMWATER PROGRAM, NPDES STORMWATER PERMIT (Integrated Compliance Information System) - ICIS-04-1976-0005, FORMAL ENFORCEMENT ACTION National Pollutant Discharge Elimination System MAJOR (Tracking pollutant discharge elimination systems) - permit National Pollutant Discharge Elimination System NON-MAJOR (Tracking pollutant discharge elimination systems) - permit Business SIC classification: SEWERAGE SYSTEMS Organizations: JEA, CH2M HILL INC, UNITED WATER FLORIDA, INC., UNITED WATER FLORIDA, JEA (CONTACT/APPLICANT)
, JEA/T-8 (CONTACT/APPLICANT)
, JEA (CONTACT/FACILITY)
, MONTEREY WWTF (CONTACT/FACILITY)
, UNITED WATER FLORIDA (CONTACT/FACILITY)
, PHILIP HEIL (CONTACT/OWNER)
, JACQUELINE BENNETT (CONTACT/OWNER)
, JEA (CONTACT/PERMIT)
, UNITED WATER FLORIDA, INC. (CONTACT/PERMIT)
Alternative names: JACKSONVILLE SUB UTIL MONTEREY, JAX SUBURBAN UTIL - MONTEREY, JAX SUBURBAN UTIL-MONTEREY STP, MONTEREY WASTE WATER TREATMENT FACILITY, MONTEREY WWTF
JACKSONVILLE UNIV (2800 UNIVERSITY BOULEVARD NORTH in JACKSONVILLE, FL)
AIR MONITORING SITE (Airborne pollution emission tracking) (Integrated Compliance Information System) - ICIS-04-1990-0146, FORMAL ENFORCEMENT ACTION National Pollutant Discharge Elimination System NON-MAJOR (Tracking pollutant discharge elimination systems) - permit National Pollutant Discharge Elimination System NON-MAJOR (Tracking pollutant discharge elimination systems) - permit Small Quantity Generators, between 100 kg and 1000 kg of hazardous waste/month (Resource Conservation and Recovery Act (tracking hazardous waste)) - notification COMMUNITY WATER SYSTEM (SDWIS) - SDWIS-FL2160568 8001, WATER TREATMENT PLANT Business SIC classification: COLLEGES, UNIVERSITIES, AND PROFESSIONAL SCHOOLS; LIBRARIES Organizations: JOSEPH COLEMAN (CONTACT/OWNER)
, MATTHEW PHILLIPS (CONTACT/OWNER)
, BILL STINSON (CONTACT/OWNER)
, MATTHEW PHILLIPS (CONTACT/OWNER)
Alternative names: JACKSONVILLE UNIVERSITY DAVIS, JACKSONVILLE UNIVERSITY PHASE
A TOUCH OF CLASS CLEANERS (6060 FT CAROLINE RD #1 in JACKSONVILLE, FL)
STATE MASTER (FDM) - CHAZ-FLD981926306, HAZARDOUS WASTE REGULATION PROGRAM (Resource Conservation and Recovery Act (tracking hazardous waste)) Business SIC classification: DRYCLEANING PLANTS, EXCEPT RUG CLEANING Organizations: TROPICAL CLEANERS INC, ROBERT ALLEN, MGR (CONTACT/OWNER)
Alternative names: TROPICAL CLEANERS INC
CV SPECIALISTS (8307 ATLANTIC BLVD in JACKSONVILLE, FL)
STATE MASTER (FDM) - CHAZ-FLD984207670, HAZARDOUS WASTE REGULATION PROGRAM (Resource Conservation and Recovery Act (tracking hazardous waste)) Business SIC classification: GENERAL AUTOMOTIVE REPAIR SHOPS Organizations: AAMCO TRANSMISSION, DONALD SWENSEN, OWNER (CONTACT/OWNER)
Alternative names: AAMCO TRANSMISSION
CP GMC MOTORS LTD (9201 ATLANTIC BLVD in JACKSONVILLE, FL)
STATE MASTER (FDM) - CHAZ-FLD048931851, HAZARDOUS WASTE REGULATION PROGRAM Small Quantity Generators, between 100 kg and 1000 kg of hazardous waste/month (Resource Conservation and Recovery Act (tracking hazardous waste)) - notification Business SIC classification: GENERAL AUTOMOTIVE REPAIR SHOPS Business NAICS classification: GENERAL AUTOMOTIVE REPAIR. Organizations: ASBURY AUTOMOTIVE JAX LP (CONTACT/OWNER)
Alternative names: COGGIN PONTIAC & GMC
SHELL OIL CO (10670 ATLANTIC BLVD in JACKSONVILLE, FL)
STATE MASTER (FDM) - CHAZ-FLD981859036, HAZARDOUS WASTE REGULATION PROGRAM Small Quantity Generators, between 100 kg and 1000 kg of hazardous waste/month (Resource Conservation and Recovery Act (tracking hazardous waste)) - notification Business SIC classification: GENERAL AUTOMOTIVE REPAIR SHOPS Business NAICS classification: GENERAL AUTOMOTIVE REPAIR. Organizations: SHELL OIL COMPANY, MOTIVA ENTERPRISES LLC (CONTACT/OWNER)
ASHFORD (CRYSTAL SPRINGS RD in JACKSONVILLE, FL)
(Integrated Compliance Information System) - ICIS-04-2000-0464, FORMAL ENFORCEMENT ACTION National Pollutant Discharge Elimination System NON-MAJOR (Tracking pollutant discharge elimination systems) - permit Business SIC classification: GENERAL CONTRACTORS-SINGLE-FAMILY HOUSES; MATTRESSES, FOUNDATIONS, AND CONVERTIBLE BEDS Alternative names: ASHFORD JOINT VENTURE
ARLINGTON ELEMENTARY SCHOOL (1201 UNIVERSITY BOULEVARD in JACKSONVILLE, FL)
(Geographic Names Information System) (National Center for Education Statistics) - STATE ID-0461 Organizations: DUVAL COUNTY SCHOOL DISTRICT (SCHOOL DISTRICT)
ARLINGTON HEIGHT ELEMENTARY SCHOOL (1520 SPRINKLE DR in JACKSONVILLE, FL)
(Geographic Names Information System) (National Center for Education Statistics) - STATE ID-2401 Organizations: DUVAL COUNTY SCHOOL DISTRICT (SCHOOL DISTRICT)
Alternative names: ARLINGTON HEIGHTS ELEMENTARY SCHOOL
ARLINGTON JUNIOR HIGH SCHOOL (8141 LONE STAR ROAD in JACKSONVILLE, FL)
(Geographic Names Information System) (National Center for Education Statistics) - STATE ID-2131 Organizations: DUVAL COUNTY SCHOOL DISTRICT (SCHOOL DISTRICT)
Alternative names: ARLINGTON MIDDLE SCHOOL
PARKWOOD HEIGHTS ELEMENTARY SCHOOL (1709 LANSDOWNE DR in JACKSONVILLE, FL)
(National Center for Education Statistics) - STATE ID-2081 Organizations: DUVAL COUNTY SCHOOL DISTRICT (SCHOOL DISTRICT)
PACE CENTER FOR GIRLS - JACKSONVILLE (2933 UNIVERSITY BLVD., N. in JACKSONVILLE, FL)
(National Center for Education Statistics) - STATE ID-0811 Organizations: DUVAL COUNTY SCHOOL DISTRICT (SCHOOL DISTRICT)
JACKSONVILLE MARINE INSTITUTE/WEST (INACTIV (5454 ARLINGTON EXPRESSWAY in JACKSONVILLE, FL)
(National Center for Education Statistics) - STATE ID-1861 Organizations: DUVAL COUNTY SCHOOL DISTRICT (SCHOOL DISTRICT)
Housing units lacking complete plumbing facilities: 1.1% Housing units lacking complete kitchen facilities: 0.8%
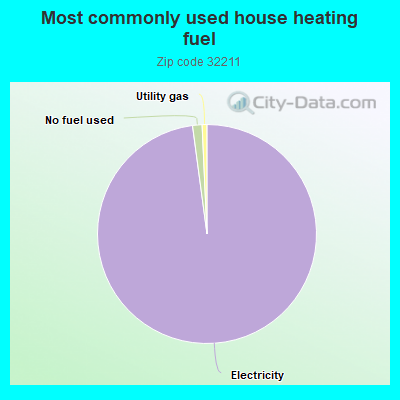
97.6%Electricity
1.4%No fuel used
0.7%Utility gas
Population in 1990: 54,199.
Place of birth for U.S.-born residents:
This state: 16,896
Northeast: 3,625
Midwest: 2,232
South: 6,282
West: 1,470
47% of the 32211 zip code residents lived in the same house 5 years ago. Out of people who lived in different houses, 66% lived in this county. Out of people who lived in different counties, 50% lived in Florida.
85% of the 32211 zip code residents lived in the same house 1 year ago. Out of people who lived in different houses, 68% moved from this county. Out of people who lived in different houses, 5% moved from different county within same state. Out of people who lived in different houses, 15% moved from different state. Out of people who lived in different houses, 3% moved from abroad.
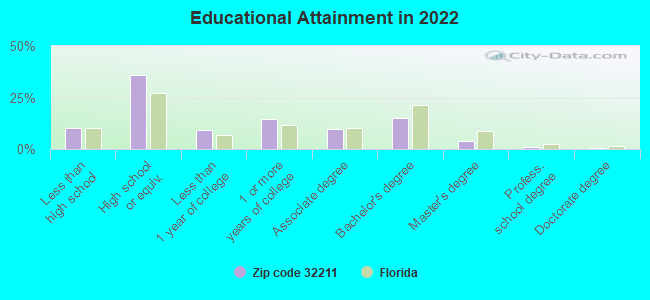
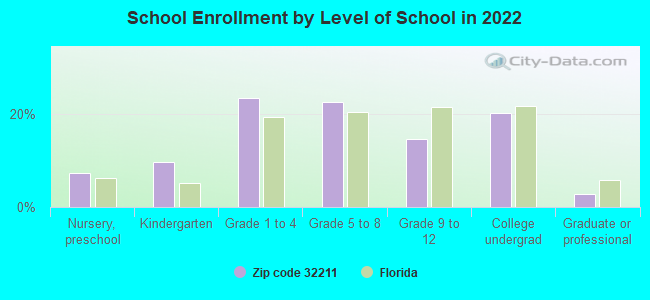
Private vs. public school enrollment:
Students in private schools in grades 1 to 8 (elementary and middle school): 767
Here:
18.9%
Florida:
15.8%
Students in private schools in grades 9 to 12 (high school): 187
Here:
14.6%
Florida:
12.9%
Students in private undergraduate colleges: 364
Here:
20.6%
Florida:
23.6%
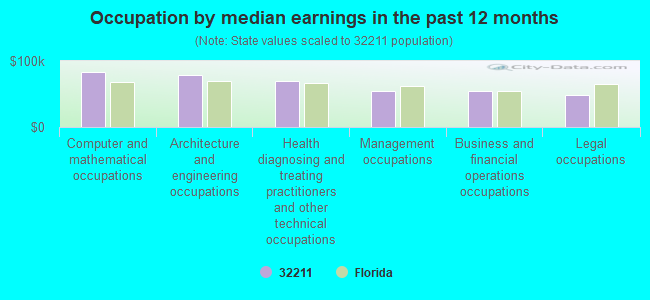
Occupation by median earnings in the past 12 months ($)
82,702Computer and mathematical occupations
78,119Architecture and engineering occupations
70,303Health diagnosing and treating practitioners and other technical occupations
54,766Management occupations
53,912Business and financial operations occupations
47,736Legal occupations
Companies with biggest federal contracts located in this zip code (JACKSONVILLE, FL):
JACKSONVILLE UNIVERSITY (2800 UNIVERSITY BLVD N) : $7,958,454 in 46 contractsfrom 2001 to 2005
Contracts for Tuition, Registration, and Membership Fees by Navy Signed by year:2000: $0; 2001: $1,326,427; 2002: $1,408,101; 2003: $1,107,211; 2004: $2,345,415; 2005: $1,771,300; 2006: $0.
Biggest contracts:
$816,339 with Navy for Tuition, Registration, and Membership Fees. Signed on 2002-01-08. Completion date: 2002-05-01.
$809,457, same as above.Signed on 2001-08-28. Completion date: 2001-12-14.
$788,000, same as above.Signed on 2003-10-01. Completion date: 2003-12-12.
$765,000, same as above.Signed on 2004-01-06. Completion date: 2004-04-30.
M OPERATING CO INC, THE (1419 WHITLOCK AVE; small business) : $3,702,505 in 9 contractsfrom 1999 to 2001
Contracts for Construction of Structures and Facilities -- Dredging, Maintenance, Repair or Alteration of Real Property -- Dredging by U.S. Army Corps of Engineers - civil program financing only Signed by year:2000: $2,020,476; 2001: $282,029; 2002: $0; 2003: $0; 2004: $0; 2005: $0; 2006: $0.
Biggest contracts:
$1,400,000 with U.S. Army Corps of Engineers - civil program financing only for Construction of Structures and Facilities -- Dredging. Taking place in GA. Signed on 1999-12-28. Completion date: 2000-09-29.
$720,000, same as above.Signed on 2000-03-01. Completion date: 1999-08-06.
$600,000, same as above.Signed on 2000-08-11. Completion date: 2001-09-28.
$486,239 with U.S. Army Corps of Engineers - civil program financing only for Maintenance, Repair or Alteration of Real Property -- Dredging. Signed on 2000-08-21. Completion date: 1999-09-30.
$84,590 with Navy for Architect - Engineer Services (including landscaping, interior layout, and designing). Taking place in GA. Signed on 2005-09-26. Completion date: 2006-01-24.
SONYA P. CARPENTER R.D.H. (1955 LAYTON RD.; small business) : $82,320 in 2 contractsfrom 1999 to 2000
$41,160 with Navy for Dentistry Services. Signed on 2000-01-18. Completion date: 2000-09-30.
$41,160, same as above.Signed on 1999-10-26. Completion date: 2004-10-22.
IRWIN, JAMES JR (5543 GROVE AVE; small business)
$65,000 with Army for Other Professional Services. Signed on 2004-09-28. Completion date: 2005-09-27.
HARLOW, JAMES (2424 PINE SUMMIT DRIVE EAS; small business) : $64,900 in 4 contractsin 2004
$36,400 with Defense Logistics Agency for Electrical and Electronic assemblies, Boards, Cards, and Associated Hardware. Signed on 2004-05-23. Completion date: 2004-07-07.
$28,000, same as above.Signed on 2004-05-28. Completion date: 2004-06-27.
$25,500 with Defense Logistics Agency for Filters and Networks. Signed on 2004-05-28. Completion date: 2004-06-27.
-$25,000, same as above.Signed on 2004-06-17. Completion date: 2004-07-01.
KELLYS PIANO & ORGAN INC (1716 UNIVERSITY BLVD N; small business) : $42,012 in 2 contractsin 2004
$41,300 with Navy for Musical Instruments. Signed on 2004-05-28. Completion date: 2004-08-20.
$712, same as above.Signed on 2004-11-18. Completion date: 2004-08-20.
FORDHAM MARINE SERVICE, INC (1336 UNIVERSITY BLVD N; small business)
$38,441 with Navy for Miscellaneous Items. Signed on 2001-06-11. Completion date: 2001-06-29.
ACCESS MARKETING & PRINTING SE (323 ARLINGTON RD N; small business)
$26,762 with Army for Other Administrative Support Services. Signed on 2000-05-08. Completion date: 2000-05-12.
DORIS M. FRANCO (5535 S. OLIVER ST.; small business) : $25,056 in 2 contractsin 1999
$25,056 with Navy for Dentistry Services. Signed on 1999-10-01. Completion date: 2000-09-30.
$0, same as above.Signed on 1999-10-01. Completion date: 2000-09-30.
Top industries in this zip code by the number of employees in 2005:
2007 - 2018 National Fire Incident Reporting System (NFIRS) incidents
Based on the data from the years 2007 - 2018 the average number of fires per year is 92. The highest number of fires - 143 took place in 2007, and the least - 62 in 2015. The data has a dropping trend.
When looking into fire subcategories, the most incidents belonged to: Outside Fires (39.5%), and Structure Fires (35.0%).
Fire incident types reported to NFIRS in Zip Code 32211


 Nearest zip codes: 32277, 32216, 32206, 32202, 32207, 32246.


 Based on the data from the years 2007 - 2018 the average number of fires per year is 92. The highest number of fires - 143 took place in 2007, and the least - 62 in 2015. The data has a dropping trend.
 When looking into fire subcategories, the most incidents belonged to: Outside Fires (39.5%), and Structure Fires (35.0%).