Estimated zip code population in 2022: 35,863 Zip code population in 2010: 29,517 Zip code population in 2000: 27,622
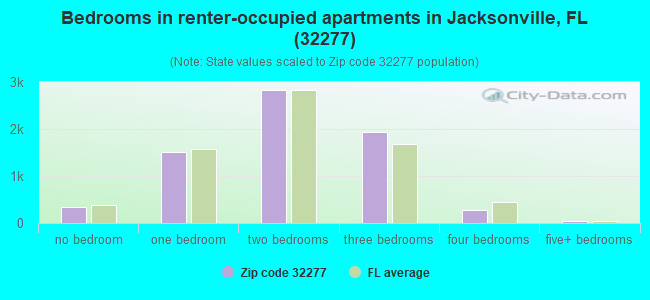
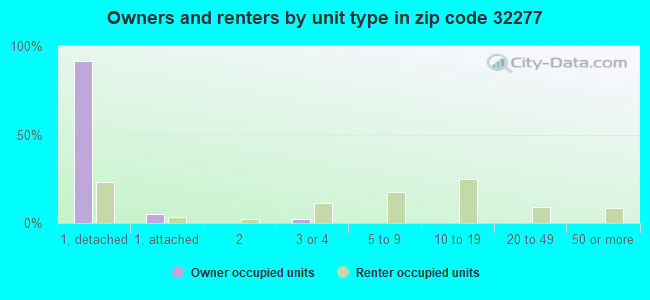
Houses and condos: 14,442 Renter-occupied apartments: 6,965
% of renters here:
52%
State:
33%
March 2022 cost of living index in zip code 32277: 89.1 (less than average, U.S. average is 100)
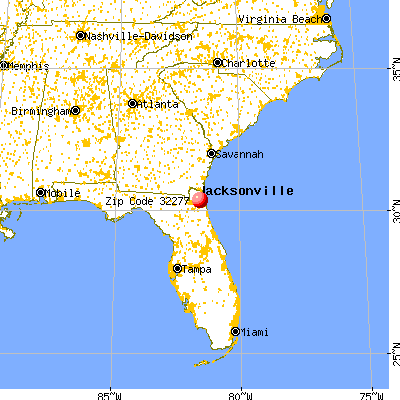
Land area: 7.2 sq. mi. Water area: 3.6 sq. mi.
Population density: 5,005 people per square mile
(average).
OSM Map
General Map
Google Map
MSN Map
OSM Map
General Map
Google Map
MSN Map
OSM Map
General Map
Google Map
MSN Map
OSM Map
General Map
Google Map
MSN Map
Please wait while loading the map...
Real estate property taxes paid for housing units in 2022:
This zip code:
0.7% ($1,902)
Florida:
0.7% ($2,529)
Median real estate property taxes paid for housing units with mortgages in 2022: $1,988 (0.7%) Median real estate property taxes paid for housing units with no mortgage in 2022: $1,706 (0.6%)
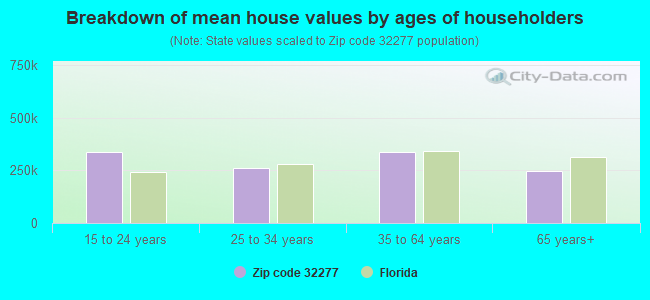
Estimated median house/condo value in 2022: $282,723
32277:
$282,723
Florida:
$354,100
According to our research of Florida and other state lists, there were 33 registered sex offenders living in 32277 zip code as of April 27, 2024. The ratio of all residents to sex offenders in zip code 32277 is 880 to 1. The ratio of registered sex offenders to all residents in this zip code is lower than the state average.
Median resident age:
This zip code:
32.5 years
Florida median age:
42.7 years
Average household size:
This zip code:
2.5 people
Florida:
2.5 people
Averages for the 2020 tax year for zip code 32277, filed in 2021:
Average Adjusted Gross Income (AGI) in 2020: $45,987 (Individual Income Tax Returns)
Here:
$45,987
State:
$82,200
Salary/wage: $40,192 (reported on 84.6% of returns)
Here:
$40,192
State:
$58,347
(% of AGI for various income ranges: 1267.9% for AGIs below $25k, 3777.8% for AGIs $25k-50k, 6685.3% for AGIs $50k-75k, 9324.8% for AGIs $75k-100k, 17099.4% for AGIs $100k-200k, 66844.0% for AGIs over 200k)
Taxable interest for individuals: $1,192 (reported on 19.1% of returns)
This zip code:
$1,192
Florida:
$4,272
(% of AGI for various income ranges: 7.8% for AGIs below $25k, 11.6% for AGIs $25k-50k, 20.2% for AGIs $50k-75k, 48.0% for AGIs $75k-100k, 165.3% for AGIs $100k-200k, 1844.0% for AGIs over 200k)
Ordinary dividends: $4,074 (reported on 10.2% of returns)
Here:
$4,074
State:
$15,863
(% of AGI for various income ranges: 8.4% for AGIs below $25k, 12.9% for AGIs $25k-50k, 50.1% for AGIs $50k-75k, 91.0% for AGIs $75k-100k, 330.6% for AGIs $100k-200k, 3800.0% for AGIs over 200k)
Net capital gain/loss in AGI: +$11,347 (reported on 8.7% of returns)
Here:
+$11,347
State:
+$62,983
(% of AGI for various income ranges: 3.9% for AGIs below $25k, 11.9% for AGIs $25k-50k, 53.3% for AGIs $50k-75k, 147.0% for AGIs $75k-100k, 606.5% for AGIs $100k-200k, 17400.0% for AGIs over 200k)
Profit/loss from business: +$5,779 (reported on 17.7% of returns)
Here:
+$5,779
State:
+$9,719
(% of AGI for various income ranges: 116.6% for AGIs below $25k, 47.6% for AGIs $25k-50k, 144.8% for AGIs $50k-75k, 184.6% for AGIs $75k-100k, 190.3% for AGIs $100k-200k, 6662.0% for AGIs over 200k)
Taxable individual retirement arrangement distribution: $15,229 (reported on 6.0% of returns)
32277:
$15,229
Florida:
$24,823
(% of AGI for various income ranges: 26.6% for AGIs below $25k, 42.5% for AGIs $25k-50k, 132.0% for AGIs $50k-75k, 359.9% for AGIs $75k-100k, 710.7% for AGIs $100k-200k, 3612.0% for AGIs over 200k)
Total itemized deductions: $29,813 (reported on 4.0% of returns)
Here:
$29,813
State:
$45,393
(% of AGI for various income ranges: 32.5% for AGIs below $25k, 81.5% for AGIs $25k-50k, 218.4% for AGIs $50k-75k, 326.8% for AGIs $75k-100k, 768.8% for AGIs $100k-200k, 6208.0% for AGIs over 200k)
Charity contributions: $11,537 (reported on 3.3% of returns)
Here:
$11,537
State:
$20,178
(% of AGI for various income ranges: 2.8% for AGIs below $25k, 21.0% for AGIs $25k-50k, 54.5% for AGIs $50k-75k, 91.6% for AGIs $75k-100k, 301.3% for AGIs $100k-200k, 3028.0% for AGIs over 200k)
Taxes paid: $4,582 (reported on 3.9% of returns)
32277:
$4,582
State:
$6,967
(% of AGI for various income ranges: 2.9% for AGIs below $25k, 10.6% for AGIs $25k-50k, 33.5% for AGIs $50k-75k, 47.4% for AGIs $75k-100k, 131.5% for AGIs $100k-200k, 898.0% for AGIs over 200k)
Earned income credit: $2,596 (reported on 26.8% of returns)
Here:
$2,596
State:
$2,306
(% of AGI for various income ranges: 147.7% for AGIs below $25k, 84.5% for AGIs $25k-50k, 1.4% for AGIs $50k-75k)
Percentage of individuals using paid preparers for their 2020 taxes: 92.9%
Here:
93%
State:
92%
(% for various income ranges: 92.6% for AGIs below $25k, 94.4% for AGIs $25k-50k, 92.9% for AGIs $50k-75k, 92.3% for AGIs $75k-100k, 90.4% for AGIs $100k-200k, 85.0% for AGIs over 200k)
Averages for the 2012 tax year for zip code 32277, filed in 2013:
Average Adjusted Gross Income (AGI) in 2012: $40,924 (Individual Income Tax Returns)
Here:
$40,924
State:
$60,316
Salary/wage: $36,962 (reported on 85.9% of returns)
Here:
$36,962
State:
$45,277
(% of AGI for various income ranges: 80.8% for AGIs below $25k, 84.2% for AGIs $25k-50k, 78.3% for AGIs $50k-75k, 77.6% for AGIs $75k-100k, 73.4% for AGIs $100k-200k, 59.5% for AGIs over 200k)
Taxable interest for individuals: $1,048 (reported on 24.8% of returns)
This zip code:
$1,048
Florida:
$3,587
(% of AGI for various income ranges: 0.7% for AGIs below $25k, 0.5% for AGIs $25k-50k, 0.5% for AGIs $50k-75k, 0.6% for AGIs $75k-100k, 0.7% for AGIs $100k-200k, 1.1% for AGIs over 200k)
Ordinary dividends: $3,591 (reported on 12.2% of returns)
Here:
$3,591
State:
$12,831
(% of AGI for various income ranges: 0.8% for AGIs below $25k, 0.8% for AGIs $25k-50k, 0.9% for AGIs $50k-75k, 1.1% for AGIs $75k-100k, 1.3% for AGIs $100k-200k, 2.4% for AGIs over 200k)
Net capital gain/loss in AGI: +$4,172 (reported on 8.3% of returns)
Here:
+$4,172
State:
+$33,493
(% of AGI for various income ranges: 0.2% for AGIs $25k-50k, 0.4% for AGIs $50k-75k, 0.3% for AGIs $75k-100k, 0.8% for AGIs $100k-200k, 7.7% for AGIs over 200k)
Profit/loss from business: +$5,650 (reported on 14.2% of returns)
Here:
+$5,650
State:
+$10,012
(% of AGI for various income ranges: 6.9% for AGIs below $25k, 1.1% for AGIs $25k-50k, 1.4% for AGIs $50k-75k, 0.7% for AGIs $75k-100k, 1.2% for AGIs $100k-200k, 0.9% for AGIs over 200k)
Taxable individual retirement arrangement distribution: $13,784 (reported on 7.8% of returns)
32277:
$13,784
Florida:
$21,544
(% of AGI for various income ranges: 2.1% for AGIs below $25k, 1.7% for AGIs $25k-50k, 2.7% for AGIs $50k-75k, 3.0% for AGIs $75k-100k, 3.1% for AGIs $100k-200k, 4.8% for AGIs over 200k)
Total itemized deductions: $17,713 (24% of AGI, reported on 22.9% of returns)
Here:
$17,713
State:
$25,533
Here:
24.2% of AGI
State:
18.0% of AGI
(% of AGI for various income ranges: 7.0% for AGIs below $25k, 10.1% for AGIs $25k-50k, 11.5% for AGIs $50k-75k, 10.5% for AGIs $75k-100k, 10.7% for AGIs $100k-200k, 8.1% for AGIs over 200k)
Charity contributions: $4,441 (reported on 18.7% of returns)
Here:
$4,441
State:
$5,698
(% of AGI for various income ranges: 0.8% for AGIs below $25k, 1.8% for AGIs $25k-50k, 2.1% for AGIs $50k-75k, 2.3% for AGIs $75k-100k, 2.7% for AGIs $100k-200k, 2.6% for AGIs over 200k)
Taxes paid: $3,247 (reported on 22.1% of returns)
32277:
$3,247
State:
$6,203
(% of AGI for various income ranges: 0.9% for AGIs below $25k, 1.5% for AGIs $25k-50k, 1.9% for AGIs $50k-75k, 2.0% for AGIs $75k-100k, 2.2% for AGIs $100k-200k, 2.1% for AGIs over 200k)
Earned income credit: $2,523 (reported on 29.1% of returns)
Here:
$2,523
State:
$2,372
(% of AGI for various income ranges: 9.8% for AGIs below $25k, 1.5% for AGIs $25k-50k)
Percentage of individuals using paid preparers for their 2012 taxes: 42.8%
Here:
43%
State:
54%
(% for various income ranges: 43.1% for AGIs below $25k, 39.6% for AGIs $25k-50k, 42.6% for AGIs $50k-75k, 45.4% for AGIs $75k-100k, 47.8% for AGIs $100k-200k, 64.3% for AGIs over 200k)
Averages for the 2004 tax year for zip code 32277, filed in 2005:
Average Adjusted Gross Income (AGI) in 2004: $39,891 (Individual Income Tax Returns)
Here:
$39,891
State:
$50,523
Salary/wage: $35,989 (reported on 89.1% of returns)
Here:
$35,989
State:
$39,563
(% of AGI for various income ranges: 98.7% for AGIs below $10k, 86.1% for AGIs $10k-25k, 86.2% for AGIs $25k-50k, 81.7% for AGIs $50k-75k, 81.0% for AGIs $75k-100k, 69.0% for AGIs over 100k)
Taxable interest for individuals: $1,372 (reported on 35.0% of returns)
This zip code:
$1,372
Florida:
$3,211
(% of AGI for various income ranges: 2.2% for AGIs below $10k, 1.2% for AGIs $10k-25k, 0.9% for AGIs $25k-50k, 1.0% for AGIs $50k-75k, 1.1% for AGIs $75k-100k, 1.7% for AGIs over 100k)
Taxable dividends: $2,380 (reported on 16.3% of returns)
Here:
$2,380
State:
$6,129
(% of AGI for various income ranges: 1.8% for AGIs below $10k, 0.7% for AGIs $10k-25k, 0.6% for AGIs $25k-50k, 0.7% for AGIs $50k-75k, 1.0% for AGIs $75k-100k, 1.7% for AGIs over 100k)
Net capital gain/loss: +$6,127 (reported on 13.0% of returns)
Here:
+$6,127
State:
+$27,205
(% of AGI for various income ranges: -0.6% for AGIs below $10k, -0.2% for AGIs $10k-25k, 0.3% for AGIs $25k-50k, 0.5% for AGIs $50k-75k, 1.1% for AGIs $75k-100k, 6.7% for AGIs over 100k)
Profit/loss from business: +$7,949 (reported on 10.2% of returns)
Here:
+$7,949
State:
+$10,634
(% of AGI for various income ranges: 6.6% for AGIs below $10k, 1.9% for AGIs $10k-25k, 1.7% for AGIs $25k-50k, 1.6% for AGIs $50k-75k, 1.1% for AGIs $75k-100k, 3.0% for AGIs over 100k)
IRA payment deduction: $2,814 (reported on 2.0% of returns)
32277:
$2,814
Florida:
$3,082
(% of AGI for various income ranges: 0.1% for AGIs $10k-25k, 0.2% for AGIs $25k-50k, 0.1% for AGIs $50k-75k, 0.2% for AGIs $75k-100k, 0.1% for AGIs over 100k)
Self-employed pension: $12,208 (reported on 0.2% of returns)
Here:
$12,208
Florida:
$15,857
Total itemized deductions: $15,778 (23% of AGI, reported on 28.2% of returns)
Here:
$15,778
State:
$20,370
Here:
23.0% of AGI
State:
20.7% of AGI
(% of AGI for various income ranges: 7.6% for AGIs below $10k, 8.4% for AGIs $10k-25k, 11.3% for AGIs $25k-50k, 13.0% for AGIs $50k-75k, 12.6% for AGIs $75k-100k, 10.3% for AGIs over 100k)
Charity contributions deductions: $3,995 (6% of AGI, reported on 24.4% of returns)
Here:
$3,995
State:
$4,064
Here:
5.6% of AGI
State:
3.8% of AGI
(% of AGI for various income ranges: 0.7% for AGIs below $10k, 1.1% for AGIs $10k-25k, 2.0% for AGIs $25k-50k, 2.5% for AGIs $50k-75k, 3.0% for AGIs $75k-100k, 3.2% for AGIs over 100k)
Total tax: $5,564 (reported on 71.0% of returns)
32277:
$5,564
State:
$9,431
(% of AGI for various income ranges: 2.1% for AGIs below $10k, 3.2% for AGIs $10k-25k, 6.4% for AGIs $25k-50k, 8.9% for AGIs $50k-75k, 10.6% for AGIs $75k-100k, 17.7% for AGIs over 100k)
Earned income credit: $1,873 (reported on 22.2% of returns)
Here:
$1,873
State:
$1,808
Percentage of individuals using paid preparers for their 2004 taxes: 52.4%
Here:
52%
State:
60%
(% for various income ranges: 50.1% for AGIs below $10k, 58.3% for AGIs $10k-25k, 49.0% for AGIs $25k-50k, 49.1% for AGIs $50k-75k, 51.3% for AGIs $75k-100k, 55.1% for AGIs over 100k)
Likely homosexual households (counted as self-reported same-sex unmarried-partner households)
Lesbian couples: 0.1% of all households
Gay men: 0.0% of all households
Household received Food Stamps/SNAP in the past 12 months: 2,940 Household did not receive Food Stamps/SNAP in the past 12 months: 10,489
Women who had a birth in the past 12 months: 464 (376 now married, 97 unmarried) Women who did not have a birth in the past 12 months: 9,752 (2,811 now married, 6,937 unmarried)
Housing units in zip code 32277 with a mortgage: 4,268 (444 second mortgage, 7 home equity loan, 321 both second mortgage and home equity loan) Houses without a mortgage: 58
Median monthly owner costs for units with a mortgage: $1,460 Median monthly owner costs for units without a mortgage: $572
Residents with income below the poverty level in 2022:
This zip code:
18.6%
Whole state:
12.7%
Residents with income below 50% of the poverty level in 2022:
This zip code:
11.6%
Whole state:
6.6%
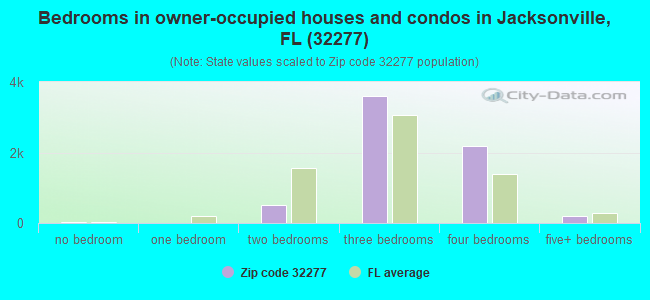
Median number of rooms in houses and condos:
Here:
6.8
State:
5.9
Median number of rooms in apartments:
Here:
4.6
State:
4.2
Notable locations in this zip code not listed on our city pages
Notable locations in zip code 32277: Carl S Swisher Library (A), Jacksonville Fire and Rescue Department Station 27 (B), University Park Branch Jacksonville Public Library (C). Display/hide their locations on the map
Churches in zip code 32277 include: High Praise Family Worship Center Church (A), Resurrection Catholic Church (B), Shepherds Fold Church of God (C), The Church of Jesus Christ of Latter Day Saints (D), Saint Lukes Church (E), Fort Caroline Presbyterian Church (F), Fort Caroline Christian Church (G), Faith Community Fellowship Church (H), Ebenezer Missionary Baptist Church (I). Display/hide their locations on the map
In group quarters: 2,033 (-1 institutionalized population)
Size of family households: 3,890 2-persons, 2,758 3-persons, 1,389 4-persons, 543 5-persons, 229 6-persons, 126 7-or-more-persons
Size of nonfamily households: 3,221 1-person, 1,195 2-persons, 158 3-persons
3,925 married couples with children.
3,665 single-parent households (300 men, 3,365 women).
82.8% of residents of 32277 zip code speak English at home.
8.4% of residents speak Spanish at home (54% very well, 20% well, 23% not well, 4% not at all).
4.5% of residents speak other Indo-European language at home (60% very well, 24% well, 13% not well, 3% not at all).
1.7% of residents speak Asian or Pacific Island language at home (64% very well, 32% well, 4% not well).
2.2% of residents speak other language at home (47% very well, 40% well, 9% not well, 4% not at all).
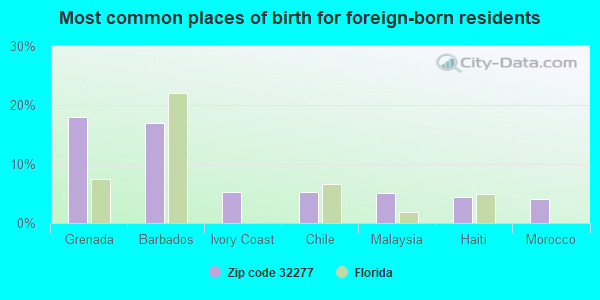
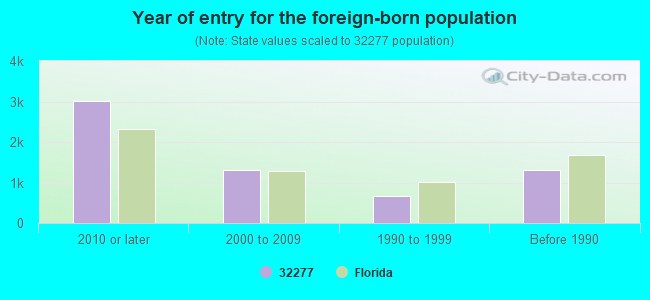
Foreign born population: 4,895 (13.7%) (56.6% of them are naturalized citizens)
Major facilities with environmental interests located in this zip code:
JUSTINA ROAD ELEMENTARY SCHOOL (3101 JUSTINA RD in JACKSONVILLE, FL)
(National Center for Education Statistics) - STATE ID-2151 Organizations: DUVAL COUNTY SCHOOL DISTRICT (SCHOOL DISTRICT)
MERRILL ROAD ELEMENTARY SCHOOL (8239 MERRILL RD in JACKSONVILLE, FL)
(National Center for Education Statistics) - STATE ID-2281 Organizations: DUVAL COUNTY SCHOOL DISTRICT (SCHOOL DISTRICT)
PEOPLES DRY CLEANERS (4275 UNIVERSITY BLVD N in JACKSONVILLE, FL)
AIR MINOR (AIRS/AFS) Small Quantity Generators, between 100 kg and 1000 kg of hazardous waste/month (Resource Conservation and Recovery Act (tracking hazardous waste)) - notification Business SIC classification: DRYCLEANING PLANTS, EXCEPT RUG CLEANING Organizations: W PAUL RESOP (CONTACT/OWNER)
Alternative names: PEOPLES CLEANERS
RIDGEMOORE UNIT 4 (TOWNSEND BLVD. in JACKSONVILLE, FL)
National Pollutant Discharge Elimination System NON-MAJOR (Tracking pollutant discharge elimination systems) - permit Organizations: GREG MATOVINA (CONTACT/OWNER)
ACTION TRANSMISSION (6015 MERRILL ROAD in JACKSONVILLE, FL)
(Resource Conservation and Recovery Act (tracking hazardous waste)) Business NAICS classification: GENERAL AUTOMOTIVE REPAIR. Organizations: RICK CAMPBELL (CONTACT/OWNER)
HILLCREST TOWNHOMES (HARTSFIELD RD & HARTSFIELD FOR in JACKSONVILLE, FL)
National Pollutant Discharge Elimination System NON-MAJOR (Tracking pollutant discharge elimination systems) - permit Organizations: ANDY CHAMBERS (CONTACT/OWNER)
PRESTIGE CLEANERS (7001 MERRILL ROAD SUITE 7 in JACKSONVILLE, FL)
(Resource Conservation and Recovery Act (tracking hazardous waste)) Organizations: MAKANJI JAY PARTNER (CONTACT/OWNER)
DAMES POINT CROSSING APARTMENT (8291 DAMES POINT CROSSING BLVD in JACKSONVILLE, FL)
National Pollutant Discharge Elimination System NON-MAJOR (Tracking pollutant discharge elimination systems) - permit Organizations: MICHAEL MOORE (CONTACT/OWNER)
SAGE DRY CLEANERS (5549 FT CAROLINE RD in JACKSONVILLE, FL)
(Resource Conservation and Recovery Act (tracking hazardous waste)) Organizations: ROBERT SAGE (CONTACT/OWNER)
SHAMI CITGO - FORT CAROLINE MO (3651 ROGERO ROAD in JACKSONVILLE, FL)
National Pollutant Discharge Elimination System NON-MAJOR (Tracking pollutant discharge elimination systems) - permit Organizations: ROGER COMBS (CONTACT/OWNER)
ROBERT W STOCKTON (7001-07 MERRILL ROAD in JACKSONVILLE, FL)
AIR MINOR (AIRS/AFS) Business SIC classification: DRYCLEANING PLANTS, EXCEPT RUG CLEANING
CREEKSIDE PARK APARTMENTS (5900 TOWNSEND RD in JACKSONVILLE, FL)
National Pollutant Discharge Elimination System NON-MAJOR (Tracking pollutant discharge elimination systems) - permit Alternative names: CHARLIE PALMER
DENIM & LACE CLEANERS (3533 UNIVERSITY BLVD N in JACKSONVILLE, FL)
AIR MINOR (AIRS/AFS) Business SIC classification: DRYCLEANING PLANTS, EXCEPT RUG CLEANING
Housing units lacking complete plumbing facilities: 1.1% Housing units lacking complete kitchen facilities: 0.4%
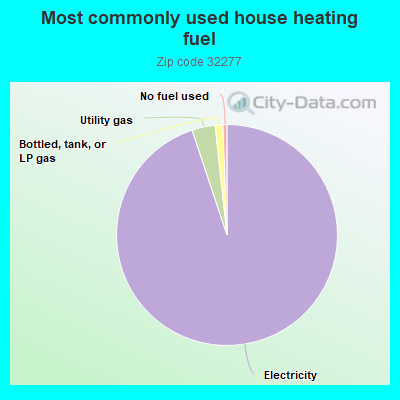
94.8%Electricity
3.4%Utility gas
1.1%Bottled, tank, or LP gas
0.6%No fuel used
Place of birth for U.S.-born residents:
This state: 17,324
Northeast: 3,040
Midwest: 2,023
South: 5,899
West: 1,291
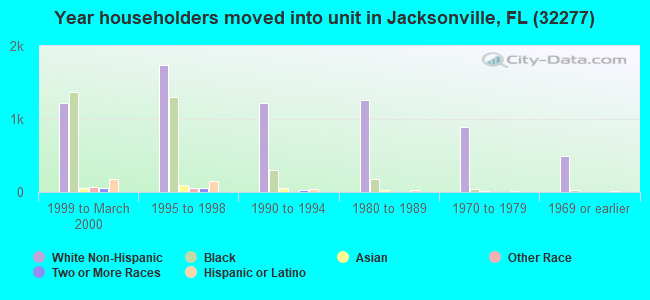
48% of the 32277 zip code residents lived in the same house 5 years ago. Out of people who lived in different houses, 70% lived in this county. Out of people who lived in different counties, 50% lived in Florida.
84% of the 32277 zip code residents lived in the same house 1 year ago. Out of people who lived in different houses, 56% moved from this county. Out of people who lived in different houses, 10% moved from different county within same state. Out of people who lived in different houses, 28% moved from different state. Out of people who lived in different houses, 1% moved from abroad.
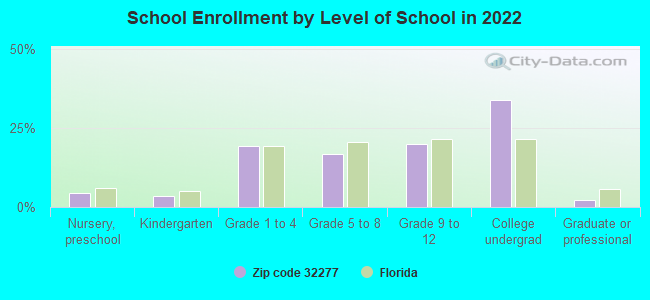
Private vs. public school enrollment:
Students in private schools in grades 1 to 8 (elementary and middle school): 1,096
Here:
29.7%
Florida:
15.8%
Students in private schools in grades 9 to 12 (high school): 423
Here:
20.8%
Florida:
12.9%
Students in private undergraduate colleges: 1,320
Here:
37.4%
Florida:
23.6%
Occupation by median earnings in the past 12 months ($)
90,334Architecture and engineering occupations
62,993Installation, maintenance, and repair occupations
62,143Business and financial operations occupations
61,026Computer and mathematical occupations
59,247Health diagnosing and treating practitioners and other technical occupations
56,859Management occupations
Companies with federal contracts located in this zip code (JACKSONVILLE, FL):
SHAH AND PRASAD CONSTRUCTORS, (7236 MERRILL ROAD; small business) : $1,362,939 in 10 contractsfrom 1999 to 2002
Contracts for Construction of Structures and Facilities -- Penal Facilities, Maintenance, Repair or Alteration of Real Property -- Hospitals and Infirmaries, Maintenance, Repair or Alteration of Real Property -- Sewage and Waste Facilities, Maintenance, Repair or Alteration of Real Property -- Other Administrative Facilities and Service Buildings by Bureau of Prisoners/Federal Prison System, Navy Signed by year:2000: $36,807; 2001: $67,437; 2002: $50,482; 2003: $0; 2004: $0; 2005: $0; 2006: $0.
Biggest contracts:
$1,200,000 with Bureau of Prisoners/Federal Prison System for Construction of Structures and Facilities -- Penal Facilities. Signed on 1999-12-15. Completion date: 2000-10-15.
$67,437 with Navy for Maintenance, Repair or Alteration of Real Property -- Hospitals and Infirmaries. Signed on 2001-11-15. Completion date: 2000-04-11.
$31,181, same as above.Signed on 2002-04-30. Completion date: 2002-06-01.
$26,000 with Bureau of Prisoners/Federal Prison System for Construction of Structures and Facilities -- Penal Facilities. Signed on 2000-02-15. Completion date: 2001-01-15.
SHAH CONSTRUCTION CO INC (7236 MERRILL ROAD; small business) : $256,713 in 6 contractsfrom 1999 to 2000
Contracts for Demolition of Buildings, Maintenance, Repair or Alteration of Real Property -- Office Buildings, Maintenance, Repair or Alteration of Real Property -- Other Administrative Facilities and Service Buildings, Maintenance, Repair or Alteration of Real Property -- Other Warehouse Buildings, and moreby Public Buildings Service, Navy Signed by year:2000: $67,055; 2001: $0; 2002: $0; 2003: $0; 2004: $0; 2005: $0; 2006: $0.
Biggest contracts:
$189,000 with Public Buildings Service for Demolition of Buildings. Signed on 1999-11-15. Completion date: 2000-01-15.
$74,000 with Public Buildings Service for Maintenance, Repair or Alteration of Real Property -- Office Buildings. Signed on 2000-01-15. Completion date: 2000-01-15.
$4,470 with Navy for Maintenance, Repair or Alteration of Real Property -- Other Administrative Facilities and Service Buildings. Signed on 1999-12-07. Completion date: 1999-04-30.
$3,735 with Navy for Maintenance, Repair or Alteration of Real Property -- Other Warehouse Buildings. Signed on 2000-02-01. Completion date: 1999-07-08.
MARITIME SOFTWARE SOLUTIONS, I (5704 MARLIN COURT; small business) : $249,685 in 3 contractsfrom 2001 to 2002
$95,660 with Navy for Other Professional Services. Taking place in MD. Signed on 2002-10-08. Completion date: 2003-12-31.
$93,986, same as above.Signed on 2001-12-31. Completion date: 2002-12-30.
$60,039, same as above.Signed on 2001-05-01. Completion date: 2001-12-30.
ENGINEERS PLUS INC (4109 E OLD MILL COVE; small business)
$15,000 with Navy for Expert Witness. Signed on 2006-05-16. Completion date: 2006-07-21.
GENESIS TECHNICAL SOLUTIONS, I (4160 FAWNGROVE RD; small business)
$5,460 with Army for ADP Support Equipment. Taking place in GA. Signed on 2004-12-09. Completion date: 2004-12-29.
CHARLOTTE A THOMPON (5928 WENTWORTH CIR N; small business)
$4,617 with Navy for Transcription Services. Taking place in GA. Signed on 2004-11-10. Completion date: 2004-12-31.
Top industries in this zip code by the number of employees in 2005:
2007 - 2018 National Fire Incident Reporting System (NFIRS) incidents
According to the data from the years 2007 - 2018 the average number of fire incidents per year is 56. The highest number of fire incidents - 71 took place in 2011, and the least - 37 in 2016. The data has a declining trend.
When looking into fire subcategories, the most reports belonged to: Outside Fires (39.6%), and Structure Fires (38.7%).
Fire incident types reported to NFIRS in Zip Code 32277


 Nearest zip codes: 32211, 32206, 32202, 32225, 32208, 32207.


 According to the data from the years 2007 - 2018 the average number of fire incidents per year is 56. The highest number of fire incidents - 71 took place in 2011, and the least - 37 in 2016. The data has a declining trend.
 When looking into fire subcategories, the most reports belonged to: Outside Fires (39.6%), and Structure Fires (38.7%).