Estimated zip code population in 2022: 49,938 Zip code population in 2010: 46,145 Zip code population in 2000: 38,765
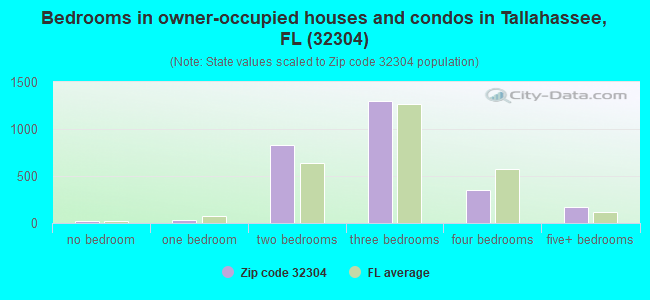
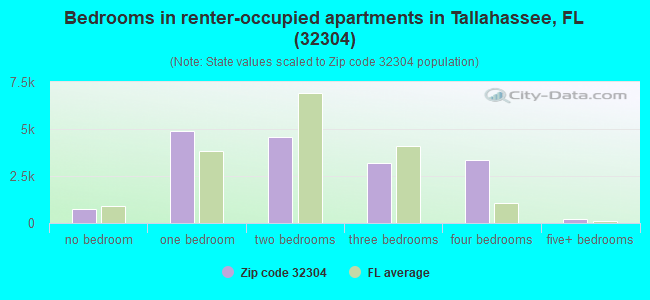
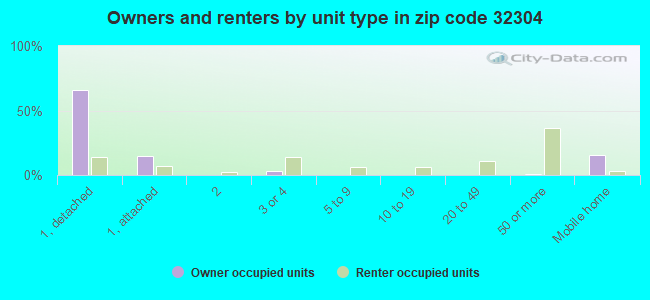
Houses and condos: 23,578 Renter-occupied apartments: 16,892
% of renters here:
86%
State:
33%
March 2022 cost of living index in zip code 32304: 90.1 (less than average, U.S. average is 100)
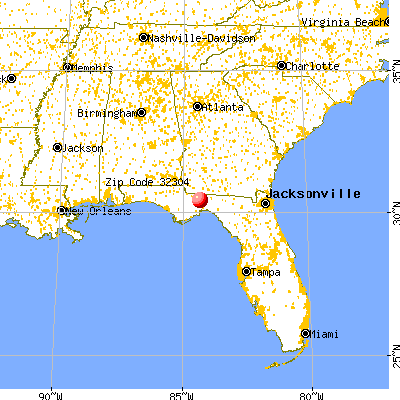
Land area: 15.7 sq. mi. Water area: 0.2 sq. mi.
Population density: 3,187 people per square mile
(average).
OSM Map
General Map
Google Map
MSN Map
OSM Map
General Map
Google Map
MSN Map
OSM Map
General Map
Google Map
MSN Map
OSM Map
General Map
Google Map
MSN Map
Please wait while loading the map...
Real estate property taxes paid for housing units in 2022:
This zip code:
0.6% ($1,033)
Florida:
0.7% ($2,529)
Median real estate property taxes paid for housing units with mortgages in 2022: $1,047 (0.5%) Median real estate property taxes paid for housing units with no mortgage in 2022: $950 (0.7%)
Averages for the 2020 tax year for zip code 32304, filed in 2021:
Average Adjusted Gross Income (AGI) in 2020: $24,306 (Individual Income Tax Returns)
Here:
$24,306
State:
$82,200
Salary/wage: $22,202 (reported on 91.3% of returns)
Here:
$22,202
State:
$58,347
(% of AGI for various income ranges: 1197.9% for AGIs below $25k, 3653.2% for AGIs $25k-50k, 6863.1% for AGIs $50k-75k, 10106.7% for AGIs $75k-100k, 16324.0% for AGIs $100k-200k)
Taxable interest for individuals: $698 (reported on 7.8% of returns)
This zip code:
$698
Florida:
$4,272
(% of AGI for various income ranges: 1.2% for AGIs below $25k, 2.6% for AGIs $25k-50k, 32.2% for AGIs $50k-75k, 23.3% for AGIs $75k-100k, 132.0% for AGIs $100k-200k)
Ordinary dividends: $2,025 (reported on 5.0% of returns)
Here:
$2,025
State:
$15,863
(% of AGI for various income ranges: 1.4% for AGIs below $25k, 3.0% for AGIs $25k-50k, 34.0% for AGIs $50k-75k, 117.3% for AGIs $75k-100k, 199.0% for AGIs $100k-200k)
Net capital gain/loss in AGI: +$5,671 (reported on 5.6% of returns)
Here:
+$5,671
State:
+$62,983
(% of AGI for various income ranges: 2.7% for AGIs below $25k, 19.7% for AGIs $25k-50k, 60.4% for AGIs $50k-75k, 188.0% for AGIs $75k-100k, 682.0% for AGIs $100k-200k)
Profit/loss from business: +$3,625 (reported on 14.3% of returns)
Here:
+$3,625
State:
+$9,719
(% of AGI for various income ranges: 53.7% for AGIs below $25k, 22.9% for AGIs $25k-50k, 193.5% for AGIs $50k-75k, 172.7% for AGIs $75k-100k, 782.0% for AGIs $100k-200k)
Taxable individual retirement arrangement distribution: $10,845 (reported on 1.5% of returns)
32304:
$10,845
Florida:
$24,823
(% of AGI for various income ranges: 2.7% for AGIs below $25k, 15.1% for AGIs $25k-50k, 92.5% for AGIs $50k-75k, 124.7% for AGIs $75k-100k, 830.0% for AGIs $100k-200k)
Total itemized deductions: $30,620 (reported on 1.5% of returns)
Here:
$30,620
State:
$45,393
(% of AGI for various income ranges: 6.0% for AGIs below $25k, 57.4% for AGIs $25k-50k, 337.6% for AGIs $50k-75k, 2146.0% for AGIs $100k-200k)
Charity contributions: $13,324 (reported on 1.3% of returns)
Here:
$13,324
State:
$20,178
(% of AGI for various income ranges: 24.3% for AGIs $25k-50k, 126.4% for AGIs $50k-75k, 872.0% for AGIs $100k-200k)
Taxes paid: $3,717 (reported on 1.3% of returns)
32304:
$3,717
State:
$6,967
(% of AGI for various income ranges: 0.6% for AGIs below $25k, 6.2% for AGIs $25k-50k, 36.5% for AGIs $50k-75k, 245.0% for AGIs $100k-200k)
Earned income credit: $2,503 (reported on 25.8% of returns)
Here:
$2,503
State:
$2,306
(% of AGI for various income ranges: 89.0% for AGIs below $25k, 60.0% for AGIs $25k-50k)
Percentage of individuals using paid preparers for their 2020 taxes: 94.0%
Here:
94%
State:
92%
(% for various income ranges: 94.4% for AGIs below $25k, 94.0% for AGIs $25k-50k, 90.8% for AGIs $50k-75k, 91.7% for AGIs $75k-100k, 90.0% for AGIs $100k-200k, 100.0% for AGIs over 200k)
Averages for the 2012 tax year for zip code 32304, filed in 2013:
Average Adjusted Gross Income (AGI) in 2012: $19,992 (Individual Income Tax Returns)
Here:
$19,992
State:
$60,316
Salary/wage: $17,906 (reported on 89.1% of returns)
Here:
$17,906
State:
$45,277
(% of AGI for various income ranges: 86.8% for AGIs below $25k, 82.8% for AGIs $25k-50k, 71.5% for AGIs $50k-75k, 68.2% for AGIs $75k-100k, 83.0% for AGIs $100k-200k)
Taxable interest for individuals: $1,848 (reported on 8.2% of returns)
This zip code:
$1,848
Florida:
$3,587
(% of AGI for various income ranges: 0.8% for AGIs below $25k, 0.6% for AGIs $25k-50k, 1.3% for AGIs $50k-75k, 0.6% for AGIs $75k-100k, 1.0% for AGIs $100k-200k)
Ordinary dividends: $11,841 (reported on 7.2% of returns)
Here:
$11,841
State:
$12,831
(% of AGI for various income ranges: 4.0% for AGIs below $25k, 6.2% for AGIs $25k-50k, 3.0% for AGIs $50k-75k, 0.8% for AGIs $75k-100k, 4.4% for AGIs $100k-200k)
Net capital gain/loss in AGI: +$4,075 (reported on 4.1% of returns)
Here:
+$4,075
State:
+$33,493
(% of AGI for various income ranges: 0.4% for AGIs below $25k, 0.7% for AGIs $25k-50k, 2.2% for AGIs $50k-75k, 0.4% for AGIs $75k-100k, 3.4% for AGIs $100k-200k)
Profit/loss from business: +$4,528 (reported on 10.2% of returns)
Here:
+$4,528
State:
+$10,012
(% of AGI for various income ranges: 4.1% for AGIs below $25k, 1.2% for AGIs $25k-50k, 0.5% for AGIs $50k-75k, 1.1% for AGIs $100k-200k)
Taxable individual retirement arrangement distribution: $9,432 (reported on 1.9% of returns)
32304:
$9,432
Florida:
$21,544
(% of AGI for various income ranges: 0.3% for AGIs below $25k, 0.6% for AGIs $25k-50k, 2.5% for AGIs $50k-75k, 4.7% for AGIs $100k-200k)
Total itemized deductions: $16,138 (29% of AGI, reported on 5.3% of returns)
Here:
$16,138
State:
$25,533
Here:
28.8% of AGI
State:
18.0% of AGI
(% of AGI for various income ranges: 1.8% for AGIs below $25k, 4.9% for AGIs $25k-50k, 7.3% for AGIs $50k-75k, 7.6% for AGIs $75k-100k, 13.8% for AGIs $100k-200k)
Charity contributions: $4,722 (reported on 3.9% of returns)
Here:
$4,722
State:
$5,698
(% of AGI for various income ranges: 0.2% for AGIs below $25k, 0.8% for AGIs $25k-50k, 1.9% for AGIs $50k-75k, 2.2% for AGIs $75k-100k, 4.1% for AGIs $100k-200k)
Taxes paid: $2,556 (reported on 4.8% of returns)
32304:
$2,556
State:
$6,203
(% of AGI for various income ranges: 0.2% for AGIs below $25k, 0.5% for AGIs $25k-50k, 1.1% for AGIs $50k-75k, 1.2% for AGIs $75k-100k, 3.0% for AGIs $100k-200k)
Earned income credit: $2,362 (reported on 27.7% of returns)
Here:
$2,362
State:
$2,372
(% of AGI for various income ranges: 6.7% for AGIs below $25k, 0.9% for AGIs $25k-50k)
Percentage of individuals using paid preparers for their 2012 taxes: 38.1%
Here:
38%
State:
54%
(% for various income ranges: 38.6% for AGIs below $25k, 33.8% for AGIs $25k-50k, 40.0% for AGIs $50k-75k, 42.9% for AGIs $75k-100k, 72.7% for AGIs $100k-200k)
Averages for the 2004 tax year for zip code 32304, filed in 2005:
Average Adjusted Gross Income (AGI) in 2004: $17,960 (Individual Income Tax Returns)
Here:
$17,960
State:
$50,523
Salary/wage: $16,611 (reported on 94.0% of returns)
Here:
$16,611
State:
$39,563
(% of AGI for various income ranges: 104.4% for AGIs below $10k, 93.2% for AGIs $10k-25k, 90.8% for AGIs $25k-50k, 80.0% for AGIs $50k-75k, 72.0% for AGIs $75k-100k, 46.7% for AGIs over 100k)
Taxable interest for individuals: $834 (reported on 13.8% of returns)
This zip code:
$834
Florida:
$3,211
(% of AGI for various income ranges: 0.6% for AGIs below $10k, 0.3% for AGIs $10k-25k, 0.5% for AGIs $25k-50k, 1.0% for AGIs $50k-75k, 1.1% for AGIs $75k-100k, 1.6% for AGIs over 100k)
Taxable dividends: $1,438 (reported on 5.9% of returns)
Here:
$1,438
State:
$6,129
(% of AGI for various income ranges: 0.3% for AGIs below $10k, 0.1% for AGIs $10k-25k, 0.3% for AGIs $25k-50k, 0.6% for AGIs $50k-75k, 0.6% for AGIs $75k-100k, 2.0% for AGIs over 100k)
Net capital gain/loss: +$7,811 (reported on 4.8% of returns)
Here:
+$7,811
State:
+$27,205
(% of AGI for various income ranges: -0.1% for AGIs below $10k, 0.3% for AGIs $10k-25k, 0.3% for AGIs $25k-50k, 0.9% for AGIs $50k-75k, 1.3% for AGIs $75k-100k, 18.8% for AGIs over 100k)
Profit/loss from business: +$3,730 (reported on 6.7% of returns)
Here:
+$3,730
State:
+$10,634
(% of AGI for various income ranges: 0.9% for AGIs below $10k, 2.1% for AGIs $10k-25k, 0.8% for AGIs $25k-50k, 1.9% for AGIs $50k-75k, 0.7% for AGIs $75k-100k, 1.0% for AGIs over 100k)
IRA payment deduction: $1,932 (reported on 0.7% of returns)
32304:
$1,932
Florida:
$3,082
Total itemized deductions: $12,525 (25% of AGI, reported on 6.8% of returns)
Here:
$12,525
State:
$20,370
Here:
25.2% of AGI
State:
20.7% of AGI
(% of AGI for various income ranges: 1.5% for AGIs below $10k, 1.9% for AGIs $10k-25k, 6.1% for AGIs $25k-50k, 7.6% for AGIs $50k-75k, 9.6% for AGIs $75k-100k, 8.3% for AGIs over 100k)
Charity contributions deductions: $4,036 (7% of AGI, reported on 5.2% of returns)
Here:
$4,036
State:
$4,064
Here:
7.4% of AGI
State:
3.8% of AGI
(% of AGI for various income ranges: 0.0% for AGIs below $10k, 0.4% for AGIs $10k-25k, 1.3% for AGIs $25k-50k, 2.3% for AGIs $50k-75k, 2.7% for AGIs $75k-100k, 2.8% for AGIs over 100k)
Total tax: $2,242 (reported on 55.6% of returns)
32304:
$2,242
State:
$9,431
(% of AGI for various income ranges: 1.5% for AGIs below $10k, 3.7% for AGIs $10k-25k, 7.4% for AGIs $25k-50k, 10.6% for AGIs $50k-75k, 11.9% for AGIs $75k-100k, 16.7% for AGIs over 100k)
Earned income credit: $1,783 (reported on 24.9% of returns)
Here:
$1,783
State:
$1,808
Percentage of individuals using paid preparers for their 2004 taxes: 46.4%
Here:
46%
State:
60%
(% for various income ranges: 39.3% for AGIs below $10k, 53.3% for AGIs $10k-25k, 49.1% for AGIs $25k-50k, 46.9% for AGIs $50k-75k, 46.6% for AGIs $75k-100k, 66.4% for AGIs over 100k)
Likely homosexual households (counted as self-reported same-sex unmarried-partner households)
Lesbian couples: 0.5% of all households
Gay men: 0.0% of all households
Household received Food Stamps/SNAP in the past 12 months: 2,834 Household did not receive Food Stamps/SNAP in the past 12 months: 16,880
Women who had a birth in the past 12 months: 273 (275 now married, 10 unmarried) Women who did not have a birth in the past 12 months: 21,375 (991 now married, 20,354 unmarried)
Housing units in zip code 32304 with a mortgage: 1,314 (98 second mortgage, 27 home equity loan, 59 both second mortgage and home equity loan) Houses without a mortgage: 48
Median monthly owner costs for units with a mortgage: $1,281 Median monthly owner costs for units without a mortgage: $442
Residents with income below the poverty level in 2022:
This zip code:
51.4%
Whole state:
12.7%
Residents with income below 50% of the poverty level in 2022:
This zip code:
16.7%
Whole state:
6.6%
Median number of rooms in houses and condos:
Here:
5.3
State:
5.9
Median number of rooms in apartments:
Here:
4.0
State:
4.2
Notable locations in this zip code not listed on our city pages
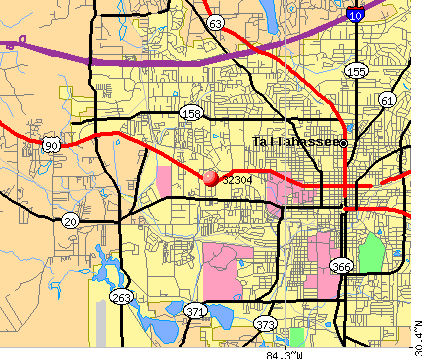
Notable locations in zip code 32304: San Luis De Talimali (A), Doak S. Campbell Stadium (B), University Plaza (C), Jackson Bluff Center (D), Tallahassee City Fire Department Station 4 (E), Tallahassee Community College Library (F), Robert Manning Strozier Library - Florida State Univ ersity (G). Display/hide their locations on the map
Churches in zip code 32304 include: Church of Christ Westside (A), Seminole Baptist Church (B), University Heights Church (C), Westminster Presbyterian Church (D), The Church of Jesus Christ of Latter Day Saints (E), Church of God of Prophecy (F), Co-Cathedral of Saint Thomas More (G), Church of Christ-Call Street (H), The First Christian Church (I). Display/hide their locations on the map
940 married couples with children.
1,706 single-parent households (296 men, 1,410 women).
86.0% of residents of 32304 zip code speak English at home.
5.5% of residents speak Spanish at home (89% very well, 8% well, 2% not well, 2% not at all).
3.7% of residents speak other Indo-European language at home (86% very well, 12% well, 2% not well).
2.6% of residents speak Asian or Pacific Island language at home (63% very well, 31% well, 4% not well, 2% not at all).
1.0% of residents speak other language at home (77% very well, 23% well).
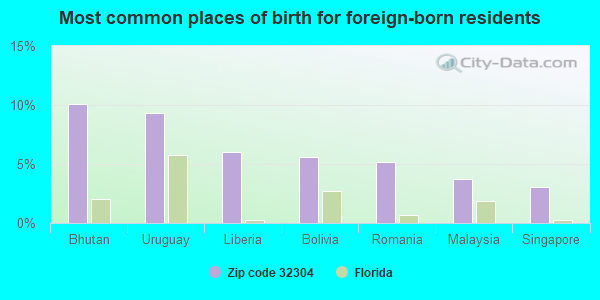
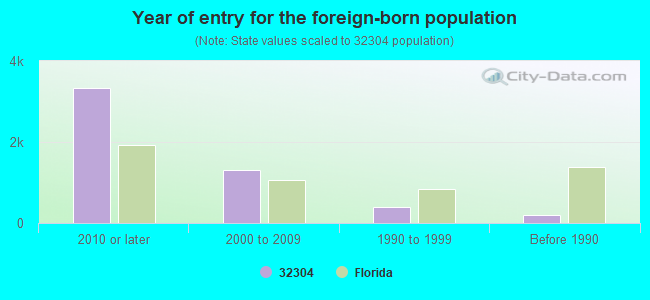
Foreign born population: 3,672 (7.4%) (41.0% of them are naturalized citizens)
Major facilities with environmental interests located in this zip code:
ARVAH B HOPKINS POWER PLANT (1125 GEDDIE ROAD in TALLAHASSEE, FL)
AIR MAJOR (AIRS/AFS) - ICIS-04-2004-1812, FORMAL ENFORCEMENT ACTION AIR PROGRAM (Clean Air Markets Division Business System) STATE MASTER (FDM) - WAFR-FL0025518, POWER PLANT WASTEWATER PROGRAM CRITERIA AND HAZARDOUS AIR POLLUTANT INVENTORY (Inventory of air pollution sources) National Pollutant Discharge Elimination System MAJOR (Tracking pollutant discharge elimination systems) - permit National Pollutant Discharge Elimination System NON-MAJOR (Tracking pollutant discharge elimination systems) - permit (Resource Conservation and Recovery Act (tracking hazardous waste)) TRI REPORTER (Tracking of toxic chemicals releasing facilities) Business SIC classification: ELECTRIC SERVICES Organizations: CITY OF TALLAHASSEE, CITY OF TALLAHASSEE ELECTRIC (CONTACT/APPLICANT)
, TALLAHASSEE HOPKINS GEN STA (CONTACT/APPLICANT)
, JENNETTE CURTIS (CONTACT/OWNER)
, RICARDO FERNANDEZ (CONTACT/OWNER)
, RICARDO FERNANDEZ (CONTACT/OWNER)
, CITY OF TALLAHASSEE (CONTACT/PERMIT)
, CITY OF TALLAHASSEE ELECTRIC (CONTACT/PERMIT)
Alternative names: ARVAH B. HOPKINS GENERATING, ARVAH B HOPKINS GENERATING ST, ARVAH B HOPKINS GENERATING STATION, CITY OF TALLAHASSEE, CITY OF TALLAHASSEE ARVAH B HOPKINS GENERATING STATION, TALLAHASSEE HOPKINS GEN STA
LEGACY TOYOTA OF TALLAHASSEE (3705 W TENNESSEE ST in TALLAHASSEE, FL)
STATE MASTER (FDM) - CHAZ-FLR000028712, HAZARDOUS WASTE REGULATION PROGRAM (Resource Conservation and Recovery Act (tracking hazardous waste)) Small Quantity Generators, between 100 kg and 1000 kg of hazardous waste/month (Resource Conservation and Recovery Act (tracking hazardous waste)) TRANSPORTER (Resource Conservation and Recovery Act (tracking hazardous waste)) Business SIC classification: TOP, BODY, AND UPHOLSTERY REPAIR SHOPS AND PAINT SHOPS; AUTOMOTIVE REPAIR SHOPS Organizations: BOBBIN TRACE AUTOMOTIVE LLC (CONTACT/OWNER)
Alternative names: TEAM TOYOTA INC
ROADWAY EXPRESS INC - T737 (4539 MOORE CIRCLE in TALLAHASSEE, FL)
STATE MASTER (FDM) - WAFR-FLR05G056, NPDES STORMWATER PROGRAM, NPDES STORMWATER PERMIT National Pollutant Discharge Elimination System NON-MAJOR (Tracking pollutant discharge elimination systems) - permit Business SIC classification: TRUCKING, EXCEPT LOCAL Organizations: JEAN GODWIN (CONTACT/OWNER)
ACCURATE AUTO & FLEET INC (1277 BLOUNTSTOWN HWY in TALLAHASSEE, FL)
STATE MASTER (FDM) - CHAZ-FLD984166934, HAZARDOUS WASTE REGULATION PROGRAM (Resource Conservation and Recovery Act (tracking hazardous waste)) Business SIC classification: TOP, BODY, AND UPHOLSTERY REPAIR SHOPS AND PAINT SHOPS Organizations: TRACEY STRAIN (CONTACT/OWNER)
PIT STOP GARAGE (5643 GUM RD in TALLAHASSEE, FL)
STATE MASTER (FDM) - CHAZ-FLR000093567, HAZARDOUS WASTE REGULATION PROGRAM (Resource Conservation and Recovery Act (tracking hazardous waste)) Business SIC classification: GENERAL CONTRACTORS-NONRESIDENTIAL BUILDINGS, OTHER THAN INDUSTRIAL BUILDINGS AND WAREHOUSES Organizations: JAMES ARNOLD ANDERSON (CONTACT/OWNER)
Alternative names: ANDERSON FACILITY
SOUTHERN BELL TRAILER SALES (5876 W TENNESSEE ST in TALLAHASSEE, FL)
(Integrated Compliance Information System) - ICIS-04-1990-0109, FORMAL ENFORCEMENT ACTION (Resource Conservation and Recovery Act (tracking hazardous waste)) Business SIC classification: OPERATORS OF RESIDENTIAL MOBILE HOME SITES Organizations: PEARLIE BELL, PRES (CONTACT/OWNER)
MCKENZIE TANK LINES INC (4742 BLOUNTSTOWN HWY in TALLAHASSEE, FL)
National Pollutant Discharge Elimination System NON-MAJOR (Tracking pollutant discharge elimination systems) - permit (Resource Conservation and Recovery Act (tracking hazardous waste)) Business SIC classification: TRUCKING, EXCEPT LOCAL Organizations: JOSEPH WIER (CONTACT/OWNER)
, JIM POLSON, MGR (CONTACT/OWNER)
Alternative names: MCKENZIE TANK LINES TRACTOR SP
CITY OF TALLAHASSEE - TALTRAN (555 APPLEYARD DR in TALLAHASSEE, FL)
ENFORCEMENT/COMPLIANCE ACTIVITY (Integrated Compliance Information System) National Pollutant Discharge Elimination System NON-MAJOR (Tracking pollutant discharge elimination systems) - permit (Resource Conservation and Recovery Act (tracking hazardous waste)) Business SIC classification: LOCAL AND SUBURBAN TRANSIT Organizations: MICHAEL WRIGHT (CONTACT/OWNER)
, JAMES CARMAN, SUPT OF MAINT (CONTACT/OWNER)
Alternative names: TALLAHASSEE TALTRAN, CITY OF, TALTRAN OPERATIONS
ACADEMIC RESOURCE CENTER (526 N APPLEYARD DR in TALLAHASSEE, FL)
(National Center for Education Statistics) - STATE ID-1101 Organizations: LEON COUNTY SCHOOL DISTRICT (SCHOOL DISTRICT)
JOHN G. RILEY ELEMENTARY SCHOOL (1400 INDIANA ST in TALLAHASSEE, FL)
(National Center for Education Statistics) - STATE ID-0231 Organizations: LEON COUNTY SCHOOL DISTRICT (SCHOOL DISTRICT)
HOSPITAL/HOMEBOUND (2757 WEST PENSACOLA ST. in TALLAHASSEE, FL)
(National Center for Education Statistics) - STATE ID-9004 Organizations: LEON COUNTY SCHOOL DISTRICT (SCHOOL DISTRICT)
LEWIS M. LIVELY AREA VOCATIONAL-TECHNICAL (500 APPLEYARD DR in TALLAHASSEE, FL)
(National Center for Education Statistics) - STATE ID-0361 Organizations: LEON COUNTY SCHOOL DISTRICT (SCHOOL DISTRICT)
GRETCHEN EVERHART SCHOOL FOR EXCEPTIONAL STUDENTS (2750 MISSION RD in TALLAHASSEE, FL)
(National Center for Education Statistics) - STATE ID-0411 Organizations: LEON COUNTY SCHOOL DISTRICT (SCHOOL DISTRICT)
Housing units lacking complete plumbing facilities: 3.1% Housing units lacking complete kitchen facilities: 2.9%
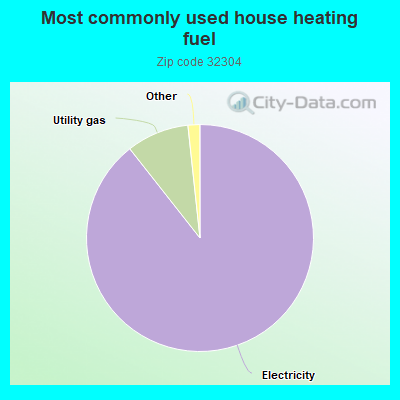
89.4%Electricity
8.9%Utility gas
0.8%Bottled, tank, or LP gas
0.8%No fuel used
Population in 1990: 33,437. Population change in the 1990s: +5,328 (+15.9%).
Place of birth for U.S.-born residents:
This state: 31,683
Northeast: 3,515
Midwest: 2,108
South: 5,862
West: 1,491
19% of the 32304 zip code residents lived in the same house 5 years ago. Out of people who lived in different houses, 22% lived in this county. Out of people who lived in different counties, 50% lived in Florida.
69% of the 32304 zip code residents lived in the same house 1 year ago. Out of people who lived in different houses, 50% moved from this county. Out of people who lived in different houses, 26% moved from different county within same state. Out of people who lived in different houses, 13% moved from different state. Out of people who lived in different houses, 3% moved from abroad.
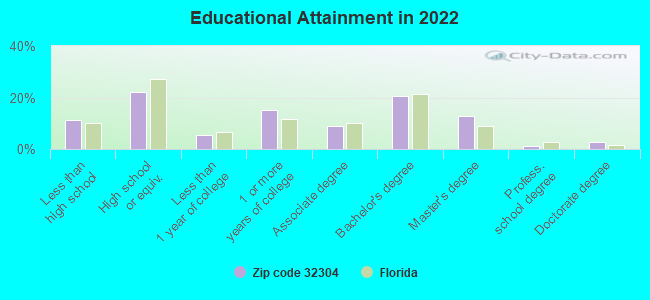
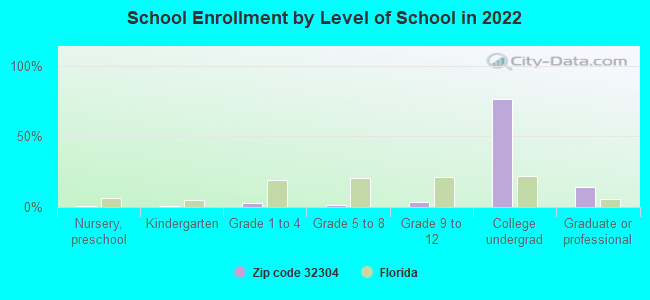
Private vs. public school enrollment:
Students in private schools in grades 1 to 8 (elementary and middle school): 115
Here:
8.6%
Florida:
15.8%
Students in private schools in grades 9 to 12 (high school): 47
Here:
4.4%
Florida:
12.9%
Students in private undergraduate colleges: 305
Here:
1.4%
Florida:
23.6%
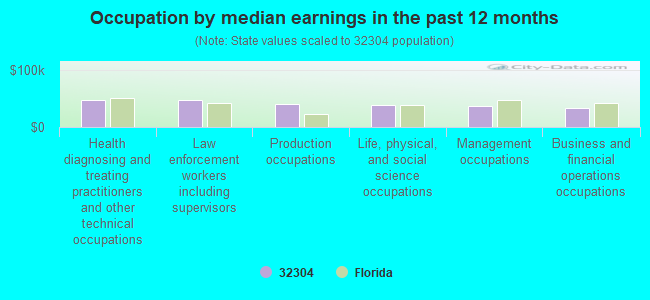
Occupation by median earnings in the past 12 months ($)
47,249Health diagnosing and treating practitioners and other technical occupations
47,129Law enforcement workers including supervisors
40,574Production occupations
37,644Life, physical, and social science occupations
36,108Management occupations
33,334Business and financial operations occupations
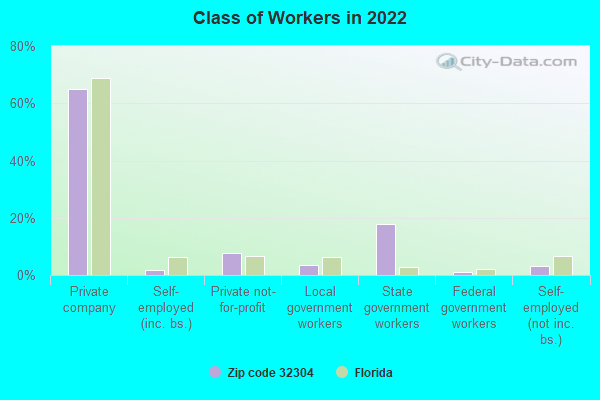
Companies with federal contracts located in this zip code (TALLAHASSEE, FL):
DOWLING, J H INC (705 W MADISON STREET) : $97,576 in 4 contractsfrom 2002 to 2005
$35,660 with U.S. Army Corps of Engineers - civil program financing only for Pipe, Tube and Rigid Tubing. Signed on 2002-09-27. Completion date: 2002-10-27.
$27,449 with Army for Pipe, Tube and Rigid Tubing. Signed on 2005-02-18. Completion date: 2005-06-30.
$27,449 with U.S. Army Corps of Engineers - civil program financing only for Pipe, Tube and Rigid Tubing. Signed on 2005-02-18. Completion date: 2005-06-30.
$7,018 with Army for Miscellaneous Items. Taking place in AL. Signed on 2003-07-15. Completion date: 2003-08-15.
HOLLEY INC (705 MABRY ST; small business) : $75,541 in 36 contractsfrom 2004 to 2006
Contracts for Marine Hardware and Hull Items, Batteries, Nonrechargeable, Batteries, Rechargeable, Industrial Assembly Machines, and moreby Navy, Bureau of Prisoners/Federal Prison System Signed by year:2000: $0; 2001: $0; 2002: $0; 2003: $0; 2004: $55,946; 2005: $10,012; 2006: $9,583.
Biggest contracts:
$16,653 with Navy for Marine Hardware and Hull Items. Signed on 2004-08-24. Completion date: 2004-10-15.
$6,176 with Navy for Batteries, Nonrechargeable. Signed on 2004-08-13. Completion date: 2004-09-20.
$4,973 with Navy for Batteries, Rechargeable. Signed on 2004-07-02. Completion date: 2004-09-01.
$4,485 with Navy for Industrial Assembly Machines. Signed on 2006-01-20. Completion date: 2006-01-20.
RAINEY CAWTHON DISTRIBUTOR (601 WEST MADISON ST; small business) : $67,349 in 2 contractsin 2001
$50,796 with Army for Oils and Greases: Cutting, Lubricating, and Hydraulic. Taking place in AL. Signed on 2001-12-19. Completion date: 2002-01-11.
$16,553, same as above.Signed on 2001-12-14. Completion date: 2001-12-28.
LAWSON, JOEL H, INC (1505 BLOUNTSTOWN ST; small business) : $48,700 in 2 contractsin 2003
$33,600 with Air Force for Construction of Structures and Facilities -- Recreation Facilities (Non-Building). Signed on 2003-09-30. Completion date: 2003-11-26.
$15,100, same as above.Signed on 2003-09-30. Completion date: 2003-11-26.
K & D PRODUCE INC (1937 W TENNESSEE ST; small business) : $37,909 in 5 contractsfrom 2004 to 2005
Contracts for Fruits and Vegetables by Defense Logistics Agency Signed by year:2000: $0; 2001: $0; 2002: $0; 2003: $0; 2004: $25,863; 2005: $12,046; 2006: $0.
Biggest contracts:
$11,248 with Defense Logistics Agency for Fruits and Vegetables. Signed on 2004-10-06. Completion date: 2004-10-06.
$8,901, same as above.Signed on 2005-10-06. Completion date: 2005-10-06.
$8,156, same as above.Signed on 2004-10-09. Completion date: 2004-10-09.
$6,459, same as above.Signed on 2004-10-09. Completion date: 2004-10-09.
CRAGCO, INC (130 PROGRESS DRIVE; small business) : $19,315 in 3 contractsfrom 2004 to 2005
$8,091 with Navy for Miscellaneous Items. Signed on 2004-10-06. Completion date: 2004-11-25.
$7,508, same as above.Signed on 2004-11-16. Completion date: 2006-01-10.
$3,716, same as above.Signed on 2005-09-08. Completion date: 2005-10-10.
ENTERPRISE RENT-A-CAR COMPANY (1485 BLOUNTSTOWN STREET) : $16,712 in 5 contractsin 2005
Contracts for Lease or Rental of Equipment -- Ground Effect Vehicles, Motor Vehicles, Trailers, and Cycles by Army Signed by year:2000: $0; 2001: $0; 2002: $0; 2003: $0; 2004: $0; 2005: $16,712; 2006: $0.
Biggest contracts:
$7,357 with Army for Lease or Rental of Equipment -- Ground Effect Vehicles, Motor Vehicles, Trailers, and Cycles. Signed on 2005-07-27. Completion date: 2005-03-10.
$5,644, same as above.Signed on 2005-05-26. Completion date: 2005-09-30.
$2,300, same as above.Signed on 2005-05-18. Completion date: 2005-05-31.
$1,411, same as above.Signed on 2005-11-04. Completion date: 2005-12-30.
CAPITAL RUBBER & INDUSTRIAL SU (130 PROGRESS DRIVE; small business)
$10,335 with Navy for Hose, Pipe, Tube, Lubrication, and Railing Fittings. Signed on 2003-12-17. Completion date: 2004-01-23.
AUTO ELECTRIC INC (1105 CAPTIAL CIRCLE NW)
$6,675 with U.S. Army Corps of Engineers - civil program financing only for Miscellaneous Engine Accessories, Aircraft. Signed on 2003-07-31. Completion date: 2003-08-15.
FULL PRESS APPAREL INC (645 W GAINES ST; small business)
$4,860 with Navy for Clothing, Special Purpose. Signed on 2005-02-24. Completion date: 2005-03-15.
Top industries in this zip code by the number of employees in 2005:
2002 - 2018 National Fire Incident Reporting System (NFIRS) incidents
According to the data from the years 2002 - 2018 the average number of fire incidents per year is 156. The highest number of fire incidents - 276 took place in 2006, and the least - 0 in 2004. The data has a rising trend.
When looking into fire subcategories, the most reports belonged to: Outside Fires (48.1%), and Structure Fires (33.4%).
Fire incident types reported to NFIRS in Zip Code 32304


 Nearest zip codes: 32303, 32399, 32301, 32308, 32343, 32305.


 According to the data from the years 2002 - 2018 the average number of fire incidents per year is 156. The highest number of fire incidents - 276 took place in 2006, and the least - 0 in 2004. The data has a rising trend.
 When looking into fire subcategories, the most reports belonged to: Outside Fires (48.1%), and Structure Fires (33.4%).