Estimated zip code population in 2022: 8,793 Zip code population in 2010: 8,133 Zip code population in 2000: 7,756
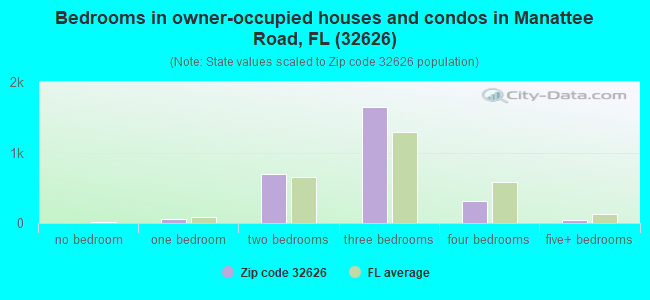
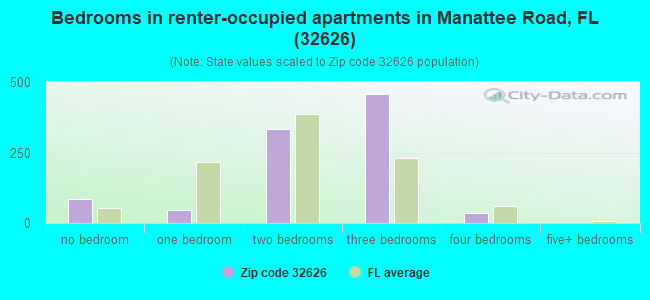
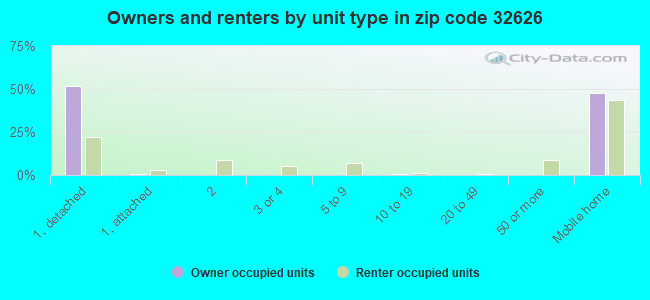
Houses and condos: 4,469 Renter-occupied apartments: 962
% of renters here:
26%
State:
33%
March 2022 cost of living index in zip code 32626: 81.9 (low, U.S. average is 100)
Land area: 204.1 sq. mi. Water area: 3.0 sq. mi.
Population density: 43 people per square mile
(very low).
OSM Map
General Map
Google Map
MSN Map
OSM Map
General Map
Google Map
MSN Map
OSM Map
General Map
Google Map
MSN Map
OSM Map
General Map
Google Map
MSN Map
Please wait while loading the map...
Real estate property taxes paid for housing units in 2022:
This zip code:
0.6% ($1,054)
Florida:
0.7% ($2,529)
Median real estate property taxes paid for housing units with mortgages in 2022: $1,320 (0.7%) Median real estate property taxes paid for housing units with no mortgage in 2022: $903 (0.6%)
Averages for the 2020 tax year for zip code 32626, filed in 2021:
Average Adjusted Gross Income (AGI) in 2020: $49,256 (Individual Income Tax Returns)
Here:
$49,256
State:
$82,200
Salary/wage: $37,991 (reported on 75.3% of returns)
Here:
$37,991
State:
$58,347
(% of AGI for various income ranges: 1112.1% for AGIs below $25k, 3424.5% for AGIs $25k-50k, 6044.1% for AGIs $50k-75k, 8362.7% for AGIs $75k-100k, 13724.0% for AGIs $100k-200k)
Taxable interest for individuals: $1,824 (reported on 23.8% of returns)
This zip code:
$1,824
Florida:
$4,272
(% of AGI for various income ranges: 15.7% for AGIs below $25k, 23.2% for AGIs $25k-50k, 56.6% for AGIs $50k-75k, 91.3% for AGIs $75k-100k, 207.3% for AGIs $100k-200k)
Ordinary dividends: $5,521 (reported on 11.4% of returns)
Here:
$5,521
State:
$15,863
(% of AGI for various income ranges: 17.7% for AGIs below $25k, 26.0% for AGIs $25k-50k, 82.5% for AGIs $50k-75k, 120.7% for AGIs $75k-100k, 313.3% for AGIs $100k-200k)
Net capital gain/loss in AGI: +$16,206 (reported on 10.8% of returns)
Here:
+$16,206
State:
+$62,983
(% of AGI for various income ranges: 3.9% for AGIs below $25k, 40.5% for AGIs $25k-50k, 112.2% for AGIs $50k-75k, 382.7% for AGIs $75k-100k, 1013.3% for AGIs $100k-200k)
Profit/loss from business: +$5,738 (reported on 14.2% of returns)
Here:
+$5,738
State:
+$9,719
(% of AGI for various income ranges: 126.0% for AGIs below $25k, 74.7% for AGIs $25k-50k, 12.8% for AGIs $50k-75k, 140.0% for AGIs $75k-100k, 343.3% for AGIs $100k-200k)
Taxable individual retirement arrangement distribution: $18,319 (reported on 9.6% of returns)
32626:
$18,319
Florida:
$24,823
(% of AGI for various income ranges: 46.5% for AGIs below $25k, 121.4% for AGIs $25k-50k, 272.8% for AGIs $50k-75k, 726.7% for AGIs $75k-100k, 1668.0% for AGIs $100k-200k)
Total itemized deductions: $33,580 (reported on 3.0% of returns)
Here:
$33,580
State:
$45,393
(% of AGI for various income ranges: 77.9% for AGIs $25k-50k, 389.1% for AGIs $50k-75k, 1029.3% for AGIs $100k-200k)
Charity contributions: $12,157 (reported on 2.1% of returns)
Here:
$12,157
State:
$20,178
(% of AGI for various income ranges: 72.2% for AGIs $50k-75k, 413.3% for AGIs $100k-200k)
Taxes paid: $5,230 (reported on 3.0% of returns)
32626:
$5,230
State:
$6,967
(% of AGI for various income ranges: 10.5% for AGIs $25k-50k, 52.2% for AGIs $50k-75k, 186.0% for AGIs $100k-200k)
Earned income credit: $2,620 (reported on 25.3% of returns)
Here:
$2,620
State:
$2,306
(% of AGI for various income ranges: 140.5% for AGIs below $25k, 89.7% for AGIs $25k-50k)
Percentage of individuals using paid preparers for their 2020 taxes: 93.4%
Here:
93%
State:
92%
(% for various income ranges: 92.9% for AGIs below $25k, 93.4% for AGIs $25k-50k, 95.5% for AGIs $50k-75k, 95.8% for AGIs $75k-100k, 92.3% for AGIs $100k-200k, 83.3% for AGIs over 200k)
Averages for the 2012 tax year for zip code 32626, filed in 2013:
Average Adjusted Gross Income (AGI) in 2012: $35,941 (Individual Income Tax Returns)
Here:
$35,941
State:
$60,316
Salary/wage: $30,778 (reported on 76.6% of returns)
Here:
$30,778
State:
$45,277
(% of AGI for various income ranges: 70.3% for AGIs below $25k, 74.9% for AGIs $25k-50k, 64.7% for AGIs $50k-75k, 69.1% for AGIs $75k-100k, 49.9% for AGIs $100k-200k)
Taxable interest for individuals: $1,682 (reported on 21.1% of returns)
This zip code:
$1,682
Florida:
$3,587
(% of AGI for various income ranges: 1.2% for AGIs below $25k, 0.8% for AGIs $25k-50k, 1.2% for AGIs $50k-75k, 0.8% for AGIs $75k-100k, 1.0% for AGIs $100k-200k)
Ordinary dividends: $4,955 (reported on 11.9% of returns)
Here:
$4,955
State:
$12,831
(% of AGI for various income ranges: 2.0% for AGIs below $25k, 2.3% for AGIs $25k-50k, 1.4% for AGIs $50k-75k, 0.3% for AGIs $75k-100k, 1.6% for AGIs $100k-200k)
Net capital gain/loss in AGI: +$5,179 (reported on 9.2% of returns)
Here:
+$5,179
State:
+$33,493
(% of AGI for various income ranges: 0.9% for AGIs $25k-50k, 0.4% for AGIs $50k-75k, 0.4% for AGIs $75k-100k, 4.1% for AGIs $100k-200k)
Profit/loss from business: +$7,611 (reported on 13.8% of returns)
Here:
+$7,611
State:
+$10,012
(% of AGI for various income ranges: 8.3% for AGIs below $25k, 2.0% for AGIs $25k-50k, 1.5% for AGIs $50k-75k, 1.3% for AGIs $75k-100k, 2.0% for AGIs $100k-200k)
Taxable individual retirement arrangement distribution: $14,929 (reported on 9.2% of returns)
32626:
$14,929
Florida:
$21,544
(% of AGI for various income ranges: 2.5% for AGIs below $25k, 2.5% for AGIs $25k-50k, 4.0% for AGIs $50k-75k, 3.9% for AGIs $75k-100k, 6.1% for AGIs $100k-200k)
Total itemized deductions: $19,433 (26% of AGI, reported on 13.8% of returns)
Here:
$19,433
State:
$25,533
Here:
26.4% of AGI
State:
18.0% of AGI
(% of AGI for various income ranges: 5.3% for AGIs below $25k, 6.8% for AGIs $25k-50k, 7.5% for AGIs $50k-75k, 8.7% for AGIs $75k-100k, 9.0% for AGIs $100k-200k)
Charity contributions: $4,587 (reported on 8.8% of returns)
Here:
$4,587
State:
$5,698
(% of AGI for various income ranges: 0.3% for AGIs below $25k, 0.6% for AGIs $25k-50k, 0.9% for AGIs $50k-75k, 1.1% for AGIs $75k-100k, 2.5% for AGIs $100k-200k)
Taxes paid: $2,957 (reported on 13.4% of returns)
32626:
$2,957
State:
$6,203
(% of AGI for various income ranges: 0.5% for AGIs below $25k, 0.8% for AGIs $25k-50k, 0.9% for AGIs $50k-75k, 1.5% for AGIs $75k-100k, 1.8% for AGIs $100k-200k)
Earned income credit: $2,482 (reported on 29.1% of returns)
Here:
$2,482
State:
$2,372
(% of AGI for various income ranges: 9.1% for AGIs below $25k, 1.4% for AGIs $25k-50k)
Percentage of individuals using paid preparers for their 2012 taxes: 49.4%
Here:
49%
State:
54%
(% for various income ranges: 46.3% for AGIs below $25k, 48.6% for AGIs $25k-50k, 55.6% for AGIs $50k-75k, 56.2% for AGIs $75k-100k, 64.3% for AGIs $100k-200k)
Averages for the 2004 tax year for zip code 32626, filed in 2005:
Average Adjusted Gross Income (AGI) in 2004: $30,814 (Individual Income Tax Returns)
Here:
$30,814
State:
$50,523
Salary/wage: $26,956 (reported on 78.2% of returns)
Here:
$26,956
State:
$39,563
(% of AGI for various income ranges: 98.7% for AGIs below $10k, 72.6% for AGIs $10k-25k, 74.4% for AGIs $25k-50k, 79.9% for AGIs $50k-75k, 72.8% for AGIs $75k-100k, 34.9% for AGIs over 100k)
Taxable interest for individuals: $2,851 (reported on 31.2% of returns)
This zip code:
$2,851
Florida:
$3,211
(% of AGI for various income ranges: 5.6% for AGIs below $10k, 2.5% for AGIs $10k-25k, 1.9% for AGIs $25k-50k, 1.0% for AGIs $50k-75k, 2.0% for AGIs $75k-100k, 6.8% for AGIs over 100k)
Taxable dividends: $2,676 (reported on 14.6% of returns)
Here:
$2,676
State:
$6,129
(% of AGI for various income ranges: 3.9% for AGIs below $10k, 1.1% for AGIs $10k-25k, 0.8% for AGIs $25k-50k, 0.2% for AGIs $50k-75k, 0.3% for AGIs $75k-100k, 3.3% for AGIs over 100k)
Net capital gain/loss: +$12,276 (reported on 13.2% of returns)
Here:
+$12,276
State:
+$27,205
(% of AGI for various income ranges: 0.7% for AGIs below $10k, 0.4% for AGIs $10k-25k, 1.6% for AGIs $25k-50k, 1.4% for AGIs $50k-75k, 5.2% for AGIs $75k-100k, 20.4% for AGIs over 100k)
Profit/loss from business: +$4,585 (reported on 14.4% of returns)
Here:
+$4,585
State:
+$10,634
(% of AGI for various income ranges: 6.6% for AGIs below $10k, 5.6% for AGIs $10k-25k, 1.7% for AGIs $25k-50k, 2.2% for AGIs $50k-75k, -0.0% for AGIs $75k-100k, -0.0% for AGIs over 100k)
IRA payment deduction: $3,400 (reported on 1.3% of returns)
32626:
$3,400
Florida:
$3,082
Total itemized deductions: $17,099 (28% of AGI, reported on 13.5% of returns)
Here:
$17,099
State:
$20,370
Here:
28.2% of AGI
State:
20.7% of AGI
(% of AGI for various income ranges: 4.5% for AGIs below $10k, 6.4% for AGIs $10k-25k, 7.7% for AGIs $25k-50k, 6.6% for AGIs $50k-75k, 8.0% for AGIs $75k-100k, 9.3% for AGIs over 100k)
Charity contributions deductions: $3,901 (6% of AGI, reported on 9.9% of returns)
Here:
$3,901
State:
$4,064
Here:
6.0% of AGI
State:
3.8% of AGI
(% of AGI for various income ranges: 0.6% for AGIs $10k-25k, 0.9% for AGIs $25k-50k, 1.5% for AGIs $50k-75k, 1.5% for AGIs $75k-100k, 2.3% for AGIs over 100k)
Total tax: $4,073 (reported on 65.2% of returns)
32626:
$4,073
State:
$9,431
(% of AGI for various income ranges: 3.5% for AGIs below $10k, 3.2% for AGIs $10k-25k, 6.3% for AGIs $25k-50k, 8.7% for AGIs $50k-75k, 11.2% for AGIs $75k-100k, 16.7% for AGIs over 100k)
Earned income credit: $1,838 (reported on 26.0% of returns)
Here:
$1,838
State:
$1,808
Percentage of individuals using paid preparers for their 2004 taxes: 55.9%
Here:
56%
State:
60%
(% for various income ranges: 52.3% for AGIs below $10k, 57.6% for AGIs $10k-25k, 54.0% for AGIs $25k-50k, 55.1% for AGIs $50k-75k, 66.7% for AGIs $75k-100k, 69.7% for AGIs over 100k)
Likely homosexual households (counted as self-reported same-sex unmarried-partner households)
Lesbian couples: 0.0% of all households
Gay men: 0.1% of all households
Household received Food Stamps/SNAP in the past 12 months: 754 Household did not receive Food Stamps/SNAP in the past 12 months: 2,953
Women who had a birth in the past 12 months: 85 (20 now married, 60 unmarried) Women who did not have a birth in the past 12 months: 1,599 (806 now married, 793 unmarried)
Housing units in zip code 32626 with a mortgage: 1,298 (55 second mortgage, 46 both second mortgage and home equity loan) Houses without a mortgage: 31
Median monthly owner costs for units with a mortgage: $1,092 Median monthly owner costs for units without a mortgage: $326
Residents with income below the poverty level in 2022:
This zip code:
14.0%
Whole state:
12.7%
Residents with income below 50% of the poverty level in 2022:
This zip code:
6.0%
Whole state:
6.6%
Median number of rooms in houses and condos:
Here:
5.6
State:
5.9
Median number of rooms in apartments:
Here:
4.8
State:
4.2
Notable locations in this zip code not listed on our city pages
Notable locations in zip code 32626: Chiefland Camp (A), Lower Clay Landing (B), Newton (C), Janney (D), Fletcher Landing (E), Clay Landing (F), Ipco Station (G), New Clay Landing (H), Chiefland High School Football Stadium (I), Levy County Emergency Medical Services Medic 2 (J), Fowlers Bluff Volunteer Fire Department (K), Levy County EMS Station Number 2 (L), Chiefland Police Department (M), Chiefland Fire and Rescue (N), Chiefland City Hall (O), Luther Callaway Library (P). Display/hide their locations on the map
Churches in zip code 32626 include: North Chiefland Church of God (A), Rocky Hammock Church (B), St. John Missionary Baptist Church (C), New Zion Church (D), Mount Bethel United Methodist Church (E), Union Church (F), Long Pond Church (G), Lighthouse Word Church (H), First United Methodist Church (I). Display/hide their locations on the map
Cemeteries: Carter Cemetery (1), Adamsville Cemetery (2), Galilee Cemetery (3), Levyville Cemetery (4), Hardee Cemetery (5), New Zion Cemetery (6), Mt. Olive Cemetery (7). Display/hide their locations on the map
Lakes: Long Pond (A), Bonnet Pond (B), Spur Pond (C), Camp Pond (D), Drummond Pond (E), Sand Pond (F), Shacklefoot Pond (G), Long Pond (H). Display/hide their locations on the map
In group quarters: 14 (-1 institutionalized population)
Size of family households: 1,238 2-persons, 492 3-persons, 325 4-persons, 82 5-persons, 132 6-persons, 110 7-or-more-persons
Size of nonfamily households: 1,179 1-person, 144 2-persons, 28 3-persons
973 married couples with children.
635 single-parent households (325 men, 310 women).
92.1% of residents of 32626 zip code speak English at home.
6.2% of residents speak Spanish at home (48% very well, 28% well, 19% not well, 5% not at all).
0.3% of residents speak other Indo-European language at home (100% very well).
1.1% of residents speak Asian or Pacific Island language at home (80% very well, 20% well).
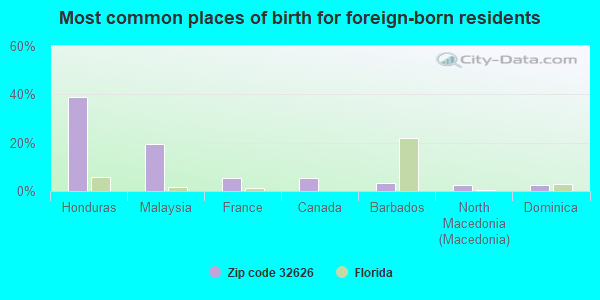
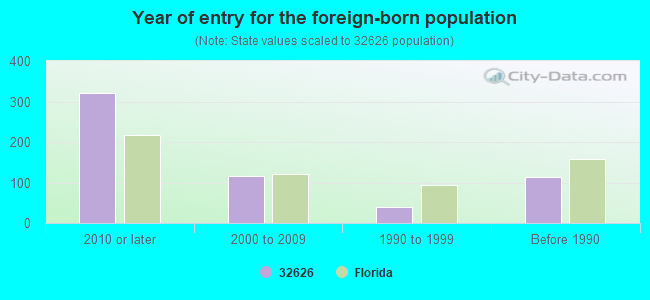
Foreign born population: 310 (3.5%) (24.5% of them are naturalized citizens)
This zip code:
3.5%
Whole state:
21.7%
39%Honduras
20%Malaysia
6%France
6%Canada
3%Barbados
3%North Macedonia (Macedonia)
2%Dominica
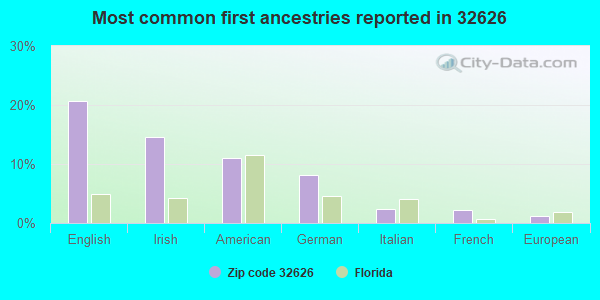
21%English
15%Irish
11%American
8%German
2%Italian
2%French
1%European
Year of entry for the foreign-born population
3202010 or later
1172000 to 2009
401990 to 1999
113Before 1990
Facilities with environmental interests located in this zip code:
GEORGIA PACIFIC CORP (SR 5346 in CHIEFLAND, FL)
(Resource Conservation and Recovery Act (tracking hazardous waste)) Business NAICS classification: WOOD PRESERVATION. Organizations: GERALD TICE, ENV ENG SOU DIV (CONTACT/OWNER)
JOES RADIATOR SHOP (215 SE 4TH AVE in CHIEFLAND, FL)
(Resource Conservation and Recovery Act (tracking hazardous waste)) Business NAICS classification: GENERAL AUTOMOTIVE REPAIR. Organizations: JOSEPH BURNS, DEALER (CONTACT/OWNER)
LLOYD LANE INC (112 WEST ADAMS STREET in CHIEFLAND, FL)
(Resource Conservation and Recovery Act (tracking hazardous waste)) Organizations: LLOYD LANE, PRESIDENT (CONTACT/OWNER)
MINI WAREHOUSE ( in CHIEFLAND, FL)
National Pollutant Discharge Elimination System NON-MAJOR (Tracking pollutant discharge elimination systems) - permit Organizations: OWEN BAYNARD (CONTACT/OWNER)
REED AUTOMOTIVE INC (10 N MAIN ST in CHIEFLAND, FL)
(Resource Conservation and Recovery Act (tracking hazardous waste)) Business NAICS classification: GENERAL AUTOMOTIVE REPAIR. Organizations: TERANCE REED (CONTACT/OWNER)
REED AUTOMOTIVE INC (15 NW 1ST AVE in CHIEFLAND, FL)
(Resource Conservation and Recovery Act (tracking hazardous waste))
CIRCLE K #2812 (MAIN ST/US HWY 19-98 in CHIEFLAND, FL)
(Resource Conservation and Recovery Act (tracking hazardous waste)) Organizations: STEVE BELIN, COMPLIANCE MGR (CONTACT/OWNER)
HOSPICE TRI-COUNTY (311 NE 9TH ST. in CHIEFLAND, FL)
National Pollutant Discharge Elimination System NON-MAJOR (Tracking pollutant discharge elimination systems) - permit
DEPT OF TRANSPORTATION (1820 S YOUNG BLVD in CHIEFLAND, FL)
Small Quantity Generators, between 100 kg and 1000 kg of hazardous waste/month (Resource Conservation and Recovery Act (tracking hazardous waste)) Organizations: FLORIDA DEPT OF TRANSPORTATION (CONTACT/OWNER)
SCOGGINS CHEVROLET OLDS INC (1724 NORTH MAIN STREET in CHIEFLAND, FL)
Small Quantity Generators, between 100 kg and 1000 kg of hazardous waste/month (Resource Conservation and Recovery Act (tracking hazardous waste)) Business NAICS classification: ALL OTHER MOTOR VEHICLE DEALERS. Organizations: SCOGGINS VICTOR MGR (CONTACT/OWNER)
Housing units lacking complete plumbing facilities: 2.2% Housing units lacking complete kitchen facilities: 0.7%
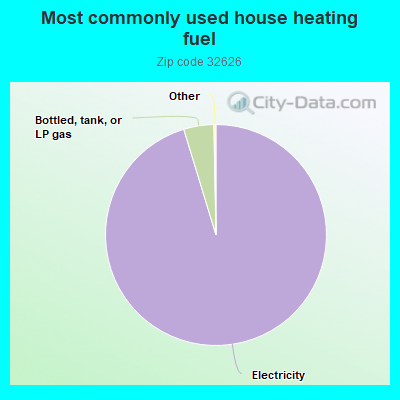
95.3%Electricity
4.4%Bottled, tank, or LP gas
Population in 1990: 7,498. Population change in the 1990s: +258 (+3.4%).
Place of birth for U.S.-born residents:
This state: 4,590
Northeast: 1,194
Midwest: 1,005
South: 1,127
West: 247
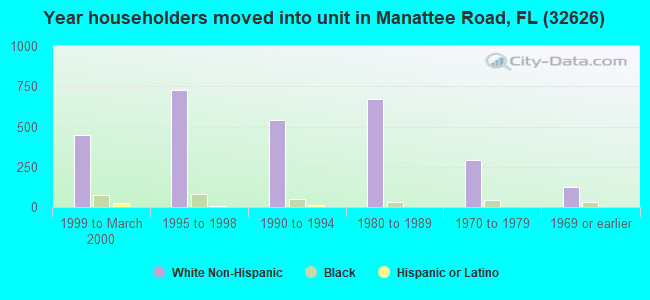
59% of the 32626 zip code residents lived in the same house 5 years ago. Out of people who lived in different houses, 41% lived in this county. Out of people who lived in different counties, 50% lived in Florida.
88% of the 32626 zip code residents lived in the same house 1 year ago. Out of people who lived in different houses, 32% moved from this county. Out of people who lived in different houses, 52% moved from different county within same state. Out of people who lived in different houses, 14% moved from different state. Out of people who lived in different houses, 1% moved from abroad.
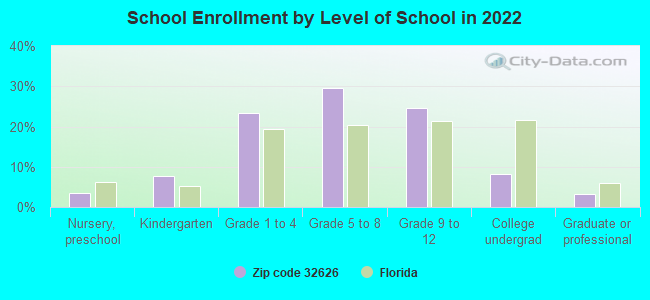
Private vs. public school enrollment:
Students in private schools in grades 1 to 8 (elementary and middle school): 53
Here:
5.7%
Florida:
15.8%
Students in private schools in grades 9 to 12 (high school): 7
Here:
1.7%
Florida:
12.9%
Students in private undergraduate colleges: 11
Here:
7.8%
Florida:
23.6%
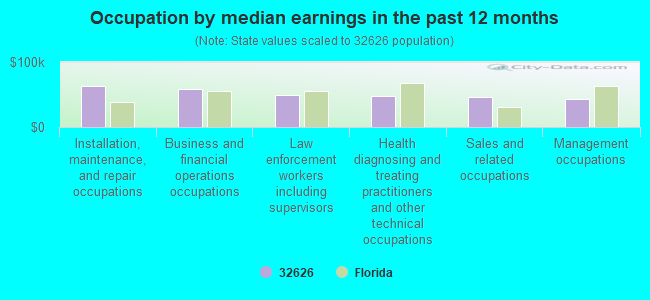
Occupation by median earnings in the past 12 months ($)
62,979Installation, maintenance, and repair occupations
58,885Business and financial operations occupations
49,365Law enforcement workers including supervisors
47,722Health diagnosing and treating practitioners and other technical occupations
46,391Sales and related occupations
43,325Management occupations
Companies with federal contracts located in this zip code:
THE TRAINING SYSTEMS INC (1225 SE 4TH TER in CHIEFLAND, FL; small business) : $10,442,396 in 25 contractsfrom 2003 to 2005
Contracts for Operation Training Devices, Miscellaneous Items, Training Aids, Armament Training Devices, and moreby Army, Navy, Air Force, Defense Logistics Agency, and others Signed by year:2000: $0; 2001: $0; 2002: $0; 2003: $271,834; 2004: $1,609,452; 2005: $8,561,110; 2006: $0.
Biggest contracts:
$3,627,938 with Army for Operation Training Devices. Signed on 2005-03-24. Completion date: 2005-07-15.
$3,581,430, same as above.Signed on 2005-03-07. Completion date: 2005-07-15.
$1,101,741, same as above.Signed on 2004-08-19. Completion date: 2004-10-19.
$956,615 with Navy for Miscellaneous Items. Signed on 2005-09-28. Completion date: 2006-03-30.
AGRICULTURE AND CONSUMER SERVI (9850 NW 42ND CT in CHIEFLAND, FL) : $20,000 in 2 contractsfrom 2002 to 2004
$20,000 with Food and Drug Administration for Other Quality Control, Testing and Inspection Services -- Miscellaneous. Signed on 2002-05-15. Completion date: 2003-05-15.
$0, same as above.Signed on 2004-09-27. Completion date: 2003-05-31.
Top industries in this zip code by the number of employees in 2005:
Health Care and Social Assistance: Home Health Care Services (50-99: 1, 20-49: 1)
Finance and Insurance: Commercial Banking (50-99: 1, 10-19: 1)
Accommodation and Food Services: Hotels (except Casino Hotels) and Motels (20-49: 2, 1-4: 1)
Educational Services: Elementary and Secondary Schools (20-49: 1, 10-19: 1)
People in group quarters in 2010:
10 people in in-patient hospice facilities
People in group quarters in 2000:
45 people in other noninstitutional group quarters
Fatal accident statistics in 2014:
Fatal accident count: 3
Vehicles involved in fatal accidents: 5
Fatal accidents caused by drunken drivers: 3
Fatalities: 3
Persons involved in fatal accidents: 11
Pedestrians involved in fatal accidents: 0
Fatal accident statistics in 2013:
Fatal accident count: 5
Vehicles involved in fatal accidents: 8
Fatal accidents caused by drunken drivers: 1
Fatalities: 7
Persons involved in fatal accidents: 15
Pedestrians involved in fatal accidents: 0
2002 - 2018 National Fire Incident Reporting System (NFIRS) incidents
According to the data from the years 2002 - 2018 the average number of fire incidents per year is 59. The highest number of reported fire incidents - 99 took place in 2017, and the least - 14 in 2002. The data has a growing trend.
When looking into fire subcategories, the most reports belonged to: Outside Fires (45.0%), and Structure Fires (30.5%).
Fire incident types reported to NFIRS in Zip Code 32626
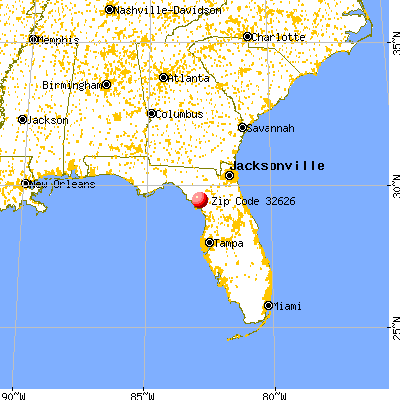


 Nearest zip codes: 32683, 32693, 32692, 32625, 32680, 32639.


 According to the data from the years 2002 - 2018 the average number of fire incidents per year is 59. The highest number of reported fire incidents - 99 took place in 2017, and the least - 14 in 2002. The data has a growing trend.
 When looking into fire subcategories, the most reports belonged to: Outside Fires (45.0%), and Structure Fires (30.5%).