Estimated zip code population in 2022: 23,062 Zip code population in 2010: 19,491 Zip code population in 2000: 16,485
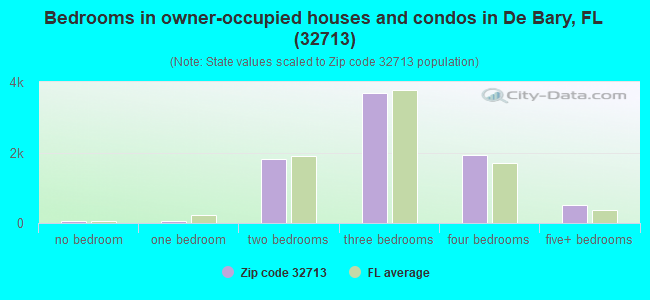
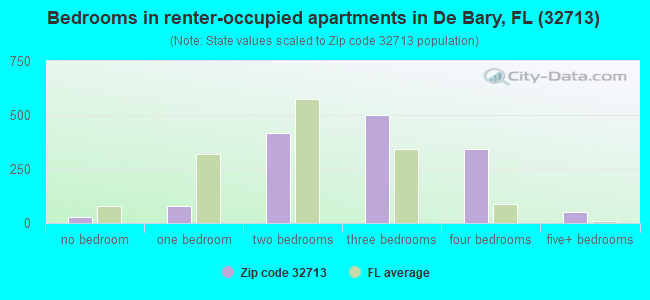
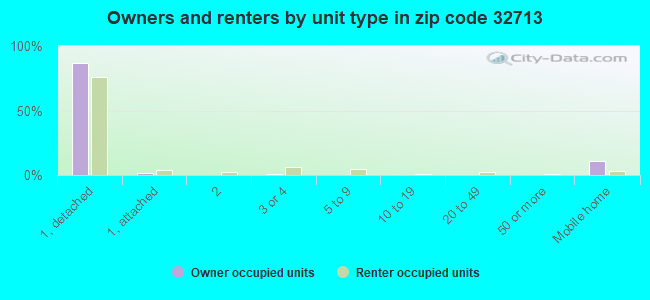
Houses and condos: 9,808 Renter-occupied apartments: 1,418
% of renters here:
15%
State:
33%
March 2022 cost of living index in zip code 32713: 89.2 (less than average, U.S. average is 100)
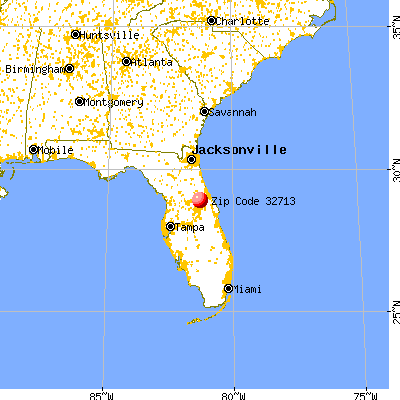
Land area: 20.7 sq. mi. Water area: 3.0 sq. mi.
Population density: 1,116 people per square mile
(low).
OSM Map
General Map
Google Map
MSN Map
OSM Map
General Map
Google Map
MSN Map
OSM Map
General Map
Google Map
MSN Map
OSM Map
General Map
Google Map
MSN Map
Please wait while loading the map...
Real estate property taxes paid for housing units in 2022:
This zip code:
0.9% ($2,914)
Florida:
0.7% ($2,529)
Median real estate property taxes paid for housing units with mortgages in 2022: $3,296 (0.9%) Median real estate property taxes paid for housing units with no mortgage in 2022: $2,036 (0.6%)
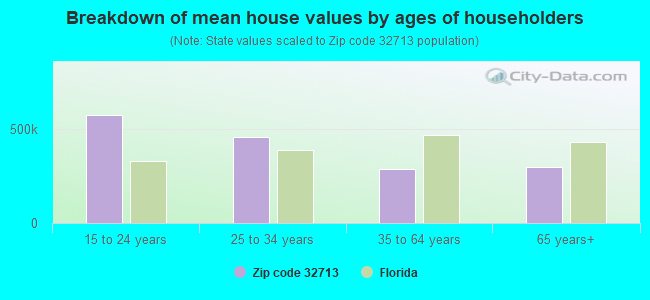
Estimated median house/condo value in 2022: $341,376
32713:
$341,376
Florida:
$354,100
According to our research of Florida and other state lists, there were 17 registered sex offenders living in 32713 zip code as of April 27, 2024. The ratio of all residents to sex offenders in zip code 32713 is 1,188 to 1. The ratio of registered sex offenders to all residents in this zip code is lower than the state average.
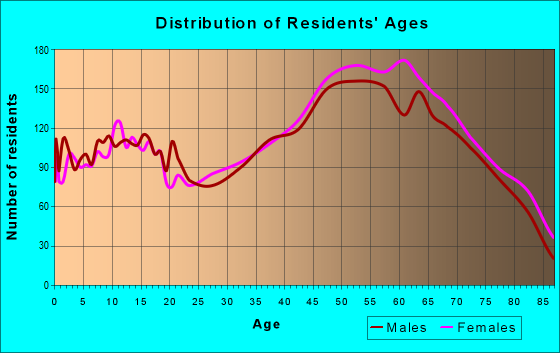
Median resident age:
This zip code:
46.3 years
Florida median age:
42.7 years
Average household size:
This zip code:
2.5 people
Florida:
2.5 people
Averages for the 2020 tax year for zip code 32713, filed in 2021:
Average Adjusted Gross Income (AGI) in 2020: $69,722 (Individual Income Tax Returns)
Here:
$69,722
State:
$82,200
Salary/wage: $61,580 (reported on 77.1% of returns)
Here:
$61,580
State:
$58,347
(% of AGI for various income ranges: 1105.5% for AGIs below $25k, 3546.3% for AGIs $25k-50k, 6351.3% for AGIs $50k-75k, 9096.5% for AGIs $75k-100k, 17096.6% for AGIs $100k-200k, 62607.3% for AGIs over 200k)
Taxable interest for individuals: $1,452 (reported on 28.0% of returns)
This zip code:
$1,452
Florida:
$4,272
(% of AGI for various income ranges: 23.3% for AGIs below $25k, 27.4% for AGIs $25k-50k, 36.3% for AGIs $50k-75k, 76.6% for AGIs $75k-100k, 100.5% for AGIs $100k-200k, 858.0% for AGIs over 200k)
Ordinary dividends: $5,083 (reported on 19.6% of returns)
Here:
$5,083
State:
$15,863
(% of AGI for various income ranges: 32.8% for AGIs below $25k, 43.8% for AGIs $25k-50k, 101.6% for AGIs $50k-75k, 140.7% for AGIs $75k-100k, 300.7% for AGIs $100k-200k, 2563.3% for AGIs over 200k)
Net capital gain/loss in AGI: +$12,343 (reported on 18.0% of returns)
Here:
+$12,343
State:
+$62,983
(% of AGI for various income ranges: 12.6% for AGIs below $25k, 30.2% for AGIs $25k-50k, 91.1% for AGIs $50k-75k, 291.2% for AGIs $75k-100k, 598.2% for AGIs $100k-200k, 9419.3% for AGIs over 200k)
Profit/loss from business: +$9,127 (reported on 16.6% of returns)
Here:
+$9,127
State:
+$9,719
(% of AGI for various income ranges: 121.1% for AGIs below $25k, 120.0% for AGIs $25k-50k, 134.9% for AGIs $50k-75k, 263.4% for AGIs $75k-100k, 448.4% for AGIs $100k-200k, 1973.3% for AGIs over 200k)
Taxable individual retirement arrangement distribution: $19,698 (reported on 12.0% of returns)
32713:
$19,698
Florida:
$24,823
(% of AGI for various income ranges: 98.0% for AGIs below $25k, 146.1% for AGIs $25k-50k, 314.7% for AGIs $50k-75k, 497.8% for AGIs $75k-100k, 705.0% for AGIs $100k-200k, 3758.0% for AGIs over 200k)
Total itemized deductions: $34,201 (reported on 6.6% of returns)
Here:
$34,201
State:
$45,393
(% of AGI for various income ranges: 32.5% for AGIs below $25k, 121.9% for AGIs $25k-50k, 341.8% for AGIs $50k-75k, 316.4% for AGIs $75k-100k, 660.1% for AGIs $100k-200k, 5388.0% for AGIs over 200k)
Charity contributions: $10,231 (reported on 5.2% of returns)
Here:
$10,231
State:
$20,178
(% of AGI for various income ranges: 13.7% for AGIs $25k-50k, 48.2% for AGIs $50k-75k, 62.0% for AGIs $75k-100k, 187.7% for AGIs $100k-200k, 1696.0% for AGIs over 200k)
Taxes paid: $5,784 (reported on 6.5% of returns)
32713:
$5,784
State:
$6,967
(% of AGI for various income ranges: 5.0% for AGIs below $25k, 21.2% for AGIs $25k-50k, 59.4% for AGIs $50k-75k, 63.9% for AGIs $75k-100k, 133.6% for AGIs $100k-200k, 638.7% for AGIs over 200k)
Earned income credit: $2,143 (reported on 12.6% of returns)
Here:
$2,143
State:
$2,306
(% of AGI for various income ranges: 82.6% for AGIs below $25k, 51.6% for AGIs $25k-50k, 0.7% for AGIs $50k-75k)
Percentage of individuals using paid preparers for their 2020 taxes: 93.1%
Here:
93%
State:
92%
(% for various income ranges: 92.6% for AGIs below $25k, 93.6% for AGIs $25k-50k, 93.2% for AGIs $50k-75k, 93.7% for AGIs $75k-100k, 93.1% for AGIs $100k-200k, 93.2% for AGIs over 200k)
Averages for the 2012 tax year for zip code 32713, filed in 2013:
Average Adjusted Gross Income (AGI) in 2012: $58,154 (Individual Income Tax Returns)
Here:
$58,154
State:
$60,316
Salary/wage: $49,303 (reported on 77.1% of returns)
Here:
$49,303
State:
$45,277
(% of AGI for various income ranges: 66.0% for AGIs below $25k, 72.3% for AGIs $25k-50k, 69.5% for AGIs $50k-75k, 69.8% for AGIs $75k-100k, 73.4% for AGIs $100k-200k, 41.7% for AGIs over 200k)
Taxable interest for individuals: $2,041 (reported on 34.7% of returns)
This zip code:
$2,041
Florida:
$3,587
(% of AGI for various income ranges: 1.9% for AGIs below $25k, 1.0% for AGIs $25k-50k, 1.3% for AGIs $50k-75k, 0.6% for AGIs $75k-100k, 0.8% for AGIs $100k-200k, 2.0% for AGIs over 200k)
Ordinary dividends: $4,795 (reported on 21.7% of returns)
Here:
$4,795
State:
$12,831
(% of AGI for various income ranges: 1.7% for AGIs below $25k, 1.6% for AGIs $25k-50k, 1.2% for AGIs $50k-75k, 1.2% for AGIs $75k-100k, 1.8% for AGIs $100k-200k, 2.8% for AGIs over 200k)
Net capital gain/loss in AGI: +$11,119 (reported on 17.1% of returns)
Here:
+$11,119
State:
+$33,493
(% of AGI for various income ranges: 0.6% for AGIs $50k-75k, 0.5% for AGIs $75k-100k, 1.1% for AGIs $100k-200k, 14.6% for AGIs over 200k)
Profit/loss from business: +$8,878 (reported on 15.2% of returns)
Here:
+$8,878
State:
+$10,012
(% of AGI for various income ranges: 7.4% for AGIs below $25k, 2.7% for AGIs $25k-50k, 2.0% for AGIs $50k-75k, 1.1% for AGIs $75k-100k, 1.9% for AGIs $100k-200k, 1.8% for AGIs over 200k)
Taxable individual retirement arrangement distribution: $16,386 (reported on 15.1% of returns)
32713:
$16,386
Florida:
$21,544
(% of AGI for various income ranges: 5.5% for AGIs below $25k, 4.2% for AGIs $25k-50k, 4.3% for AGIs $50k-75k, 5.1% for AGIs $75k-100k, 4.8% for AGIs $100k-200k, 2.4% for AGIs over 200k)
Total itemized deductions: $20,195 (19% of AGI, reported on 28.0% of returns)
Here:
$20,195
State:
$25,533
Here:
18.9% of AGI
State:
18.0% of AGI
(% of AGI for various income ranges: 10.1% for AGIs below $25k, 9.4% for AGIs $25k-50k, 10.2% for AGIs $50k-75k, 11.1% for AGIs $75k-100k, 11.3% for AGIs $100k-200k, 6.2% for AGIs over 200k)
Charity contributions: $3,750 (reported on 22.3% of returns)
Here:
$3,750
State:
$5,698
(% of AGI for various income ranges: 0.7% for AGIs below $25k, 1.0% for AGIs $25k-50k, 1.4% for AGIs $50k-75k, 1.7% for AGIs $75k-100k, 1.7% for AGIs $100k-200k, 1.5% for AGIs over 200k)
Taxes paid: $4,500 (reported on 27.5% of returns)
32713:
$4,500
State:
$6,203
(% of AGI for various income ranges: 1.6% for AGIs below $25k, 1.6% for AGIs $25k-50k, 1.9% for AGIs $50k-75k, 2.2% for AGIs $75k-100k, 2.5% for AGIs $100k-200k, 2.3% for AGIs over 200k)
Earned income credit: $2,032 (reported on 15.6% of returns)
Here:
$2,032
State:
$2,372
(% of AGI for various income ranges: 5.3% for AGIs below $25k, 0.8% for AGIs $25k-50k)
Percentage of individuals using paid preparers for their 2012 taxes: 46.4%
Here:
46%
State:
54%
(% for various income ranges: 41.9% for AGIs below $25k, 44.1% for AGIs $25k-50k, 50.4% for AGIs $50k-75k, 47.8% for AGIs $75k-100k, 53.6% for AGIs $100k-200k, 75.0% for AGIs over 200k)
Averages for the 2004 tax year for zip code 32713, filed in 2005:
Average Adjusted Gross Income (AGI) in 2004: $51,195 (Individual Income Tax Returns)
Here:
$51,195
State:
$50,523
Salary/wage: $45,661 (reported on 79.4% of returns)
Here:
$45,661
State:
$39,563
(% of AGI for various income ranges: 138.9% for AGIs below $10k, 65.6% for AGIs $10k-25k, 73.4% for AGIs $25k-50k, 72.8% for AGIs $50k-75k, 77.8% for AGIs $75k-100k, 65.0% for AGIs over 100k)
Taxable interest for individuals: $1,945 (reported on 50.3% of returns)
This zip code:
$1,945
Florida:
$3,211
(% of AGI for various income ranges: 10.3% for AGIs below $10k, 3.8% for AGIs $10k-25k, 2.0% for AGIs $25k-50k, 1.3% for AGIs $50k-75k, 1.6% for AGIs $75k-100k, 1.7% for AGIs over 100k)
Taxable dividends: $2,629 (reported on 28.1% of returns)
Here:
$2,629
State:
$6,129
(% of AGI for various income ranges: 6.8% for AGIs below $10k, 2.2% for AGIs $10k-25k, 1.2% for AGIs $25k-50k, 1.1% for AGIs $50k-75k, 1.3% for AGIs $75k-100k, 1.5% for AGIs over 100k)
Net capital gain/loss: +$9,570 (reported on 23.6% of returns)
Here:
+$9,570
State:
+$27,205
(% of AGI for various income ranges: -0.3% for AGIs below $10k, 0.2% for AGIs $10k-25k, 0.9% for AGIs $25k-50k, 1.4% for AGIs $50k-75k, 1.0% for AGIs $75k-100k, 9.9% for AGIs over 100k)
Profit/loss from business: +$9,428 (reported on 14.9% of returns)
Here:
+$9,428
State:
+$10,634
(% of AGI for various income ranges: 2.2% for AGIs below $10k, 4.9% for AGIs $10k-25k, 2.8% for AGIs $25k-50k, 2.3% for AGIs $50k-75k, 2.9% for AGIs $75k-100k, 2.5% for AGIs over 100k)
IRA payment deduction: $3,346 (reported on 3.3% of returns)
32713:
$3,346
Florida:
$3,082
(% of AGI for various income ranges: 0.4% for AGIs $10k-25k, 0.3% for AGIs $25k-50k, 0.2% for AGIs $50k-75k, 0.2% for AGIs $75k-100k, 0.1% for AGIs over 100k)
Self-employed pension: $10,243 (reported on 0.4% of returns)
Here:
$10,243
Florida:
$15,857
Total itemized deductions: $17,646 (21% of AGI, reported on 39.2% of returns)
Here:
$17,646
State:
$20,370
Here:
21.3% of AGI
State:
20.7% of AGI
(% of AGI for various income ranges: 27.7% for AGIs below $10k, 13.0% for AGIs $10k-25k, 15.5% for AGIs $25k-50k, 15.1% for AGIs $50k-75k, 15.0% for AGIs $75k-100k, 10.9% for AGIs over 100k)
Charity contributions deductions: $2,879 (3% of AGI, reported on 32.6% of returns)
Here:
$2,879
State:
$4,064
Here:
3.3% of AGI
State:
3.8% of AGI
(% of AGI for various income ranges: 1.4% for AGIs below $10k, 1.3% for AGIs $10k-25k, 1.6% for AGIs $25k-50k, 2.0% for AGIs $50k-75k, 1.9% for AGIs $75k-100k, 2.0% for AGIs over 100k)
Total tax: $7,686 (reported on 79.6% of returns)
32713:
$7,686
State:
$9,431
(% of AGI for various income ranges: 4.0% for AGIs below $10k, 4.0% for AGIs $10k-25k, 6.7% for AGIs $25k-50k, 8.8% for AGIs $50k-75k, 10.7% for AGIs $75k-100k, 18.2% for AGIs over 100k)
Earned income credit: $1,544 (reported on 10.2% of returns)
Here:
$1,544
State:
$1,808
Percentage of individuals using paid preparers for their 2004 taxes: 53.8%
Here:
54%
State:
60%
(% for various income ranges: 47.2% for AGIs below $10k, 54.2% for AGIs $10k-25k, 53.9% for AGIs $25k-50k, 55.9% for AGIs $50k-75k, 52.5% for AGIs $75k-100k, 60.8% for AGIs over 100k)
Likely homosexual households (counted as self-reported same-sex unmarried-partner households)
Lesbian couples: 0.1% of all households
Gay men: 0.0% of all households
Household received Food Stamps/SNAP in the past 12 months: 605 Household did not receive Food Stamps/SNAP in the past 12 months: 8,828
Women who had a birth in the past 12 months: 154 (56 now married, 92 unmarried) Women who did not have a birth in the past 12 months: 4,233 (2,311 now married, 1,924 unmarried)
Housing units in zip code 32713 with a mortgage: 4,797 (343 second mortgage, 285 both second mortgage and home equity loan) Houses without a mortgage: 70
Median monthly owner costs for units with a mortgage: $1,790 Median monthly owner costs for units without a mortgage: $588
Residents with income below the poverty level in 2022:
This zip code:
7.3%
Whole state:
12.7%
Residents with income below 50% of the poverty level in 2022:
This zip code:
2.9%
Whole state:
6.6%
Median number of rooms in houses and condos:
Here:
6.2
State:
5.9
Median number of rooms in apartments:
Here:
5.4
State:
4.2
Notable locations in this zip code not listed on our city pages
Notable locations in zip code 32713: Coral Oaks Golf Course (A), Sanford Power Plant (B), Emanuel Landing (C), Volusia County Fire Services Station 33 Debary (D), Debary Public Library (E). Display/hide their locations on the map
Churches in zip code 32713 include: Rivercity Christian Church (A), Kingdom Hall of Jehovahs Witnesses (B), First Baptist Church of Debary (C), Community United Methodist Church (D). Display/hide their locations on the map
Lakes: Angeles Lake (A), Lake Anna Marie (B), Lago Lindo (C), Bass Lake (D), Big Whirl (E), Bonita Lake (F), Konomac Lake (G), Lake Susan (H). Display/hide their locations on the map
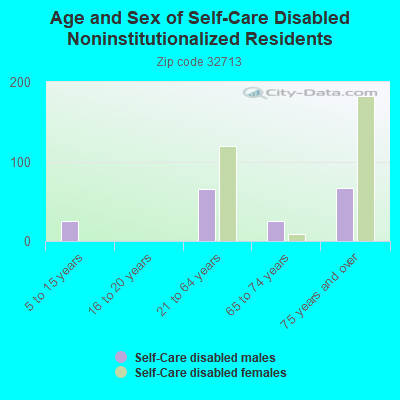
In group quarters: 142 (-1 institutionalized population)
Size of family households: 2,737 2-persons, 1,637 3-persons, 1,245 4-persons, 345 5-persons, 201 6-persons, 77 7-or-more-persons
Size of nonfamily households: 2,365 1-person, 763 2-persons, 19 3-persons
2,846 married couples with children.
922 single-parent households (262 men, 660 women).
85.2% of residents of 32713 zip code speak English at home.
10.3% of residents speak Spanish at home (83% very well, 11% well, 6% not well).
1.2% of residents speak other Indo-European language at home (92% very well, 5% well, 3% not well).
2.4% of residents speak Asian or Pacific Island language at home (98% very well, 1% well, 1% not well).
0.4% of residents speak other language at home (100% very well).
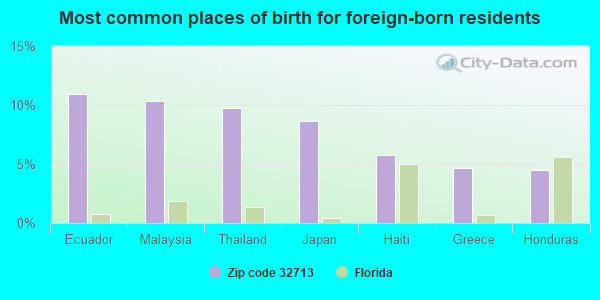
Foreign born population: 2,143 (9.3%) (90.8% of them are naturalized citizens)
This zip code:
9.3%
Whole state:
21.7%
11%Ecuador
10%Malaysia
10%Thailand
9%Japan
6%Haiti
5%Greece
4%Honduras
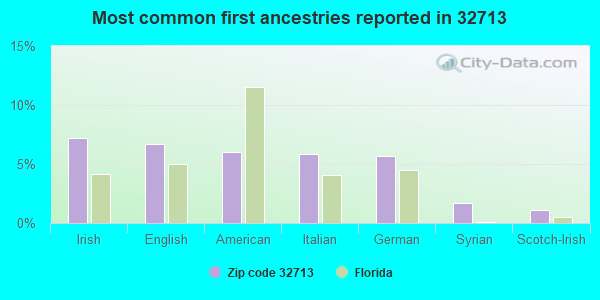
7%Irish
7%English
6%American
6%Italian
6%German
2%Syrian
1%Scotch-Irish
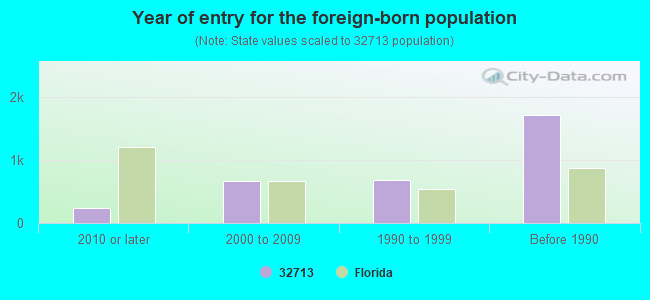
Year of entry for the foreign-born population
2332010 or later
6642000 to 2009
6781990 to 1999
1,710Before 1990
Major facilities with environmental interests located in this zip code:
RANGER CONSTRUCTION INDUSTRIES, INC. (320 BENSON JUNCTION ROAD in DEBARY, FL)
AIR MINOR (AIRS/AFS) AIR SYNTHETIC MINOR (AIRS/AFS) CRITERIA AND HAZARDOUS AIR POLLUTANT INVENTORY (Inventory of air pollution sources) National Pollutant Discharge Elimination System NON-MAJOR (Tracking pollutant discharge elimination systems) - permit Business SIC classification: ASPHALT PAVING MIXTURES AND BLOCKS Organizations: MARK VEILLETTE (CONTACT/OWNER)
READING EDGE ACADEMY (2975 ENTERPRISE ROAD in DEBARY, FL)
(National Center for Education Statistics) - STATE ID-6891 Organizations: VOLUSIA COUNTY SCHOOL DISTRICT (SCHOOL DISTRICT)
DEBARY ELEMENTARY SCHOOL (88 WEST HIGHBANKS RD in DEBARY, FL)
(National Center for Education Statistics) - STATE ID-7761 Organizations: VOLUSIA COUNTY SCHOOL DISTRICT (SCHOOL DISTRICT)
CUMBERLAND FARMS #1075 (14 US HWY 17-92 in DEBARY, FL)
National Pollutant Discharge Elimination System NON-MAJOR (Tracking pollutant discharge elimination systems) - permit Small Quantity Generators, between 100 kg and 1000 kg of hazardous waste/month (Resource Conservation and Recovery Act (tracking hazardous waste)) - notification Small Quantity Generators, between 100 kg and 1000 kg of hazardous waste/month (Resource Conservation and Recovery Act (tracking hazardous waste)) - notification Business SIC classification: GASOLINE SERVICE STATIONS Organizations: JOYCE SCHULTZ, UST COORD (CONTACT/OWNER)
, JOYCE SCHULTZ, DEALER (CONTACT/OWNER)
Alternative names: CUMBERLAND FARMS #0981
LAKE MONROE PARK (975 SOUTH HIGHWAY 17-92 in DEBARY, FL)
National Pollutant Discharge Elimination System NON-MAJOR (Tracking pollutant discharge elimination systems) - permit Organizations: BILL APGAR (CONTACT/OWNER)
RIVIERA BELLA PHASE 2B (FT FLORIDA ROAD in DEBARY, FL)
National Pollutant Discharge Elimination System NON-MAJOR (Tracking pollutant discharge elimination systems) - permit Organizations: NOY RIVERS (CONTACT/OWNER)
Alternative names: LAKE NONA PARCEL 8
SPRING TO SPRING TRAIL PHASE I (LAKE MONROE TRAIL TO GEMENI SP in DEBARY, FL)
National Pollutant Discharge Elimination System NON-MAJOR (Tracking pollutant discharge elimination systems) - permit Organizations: MATT BLANTON (CONTACT/OWNER)
Alternative names: MEUTH CONSTRUCTION SUPPLY
GLEN ABBEY UNIT 5 (GLEN ABBEY LANE in DEBARY, FL)
National Pollutant Discharge Elimination System NON-MAJOR (Tracking pollutant discharge elimination systems) - permit Organizations: TIM O'NEIL (CONTACT/OWNER)
Alternative names: LEXINGTON COMMONS
INLAND MATERIALS (320 BENSON JUNCTION RD in DEBARY, FL)
National Pollutant Discharge Elimination System NON-MAJOR (Tracking pollutant discharge elimination systems) - permit Organizations: VINCENT MURPHY (CONTACT/OWNER)
JOES BODY SHOP (321 E HIGHBANKS RD in DEBARY, FL)
(Resource Conservation and Recovery Act (tracking hazardous waste)) Organizations: JOSEPH GRANDI, OWNER (CONTACT/OWNER)
JOSEPH SUBDIVISION (W SIDE DIRKSEN RD, W OF I-4/DI in DEBARY, FL)
National Pollutant Discharge Elimination System NON-MAJOR (Tracking pollutant discharge elimination systems) - permit Organizations: AUGUSTINE JOSEPH (CONTACT/OWNER)
LOT 19 SPRINGVIEW INDUSTRIAL P (N/A in DEBARY, FL)
National Pollutant Discharge Elimination System NON-MAJOR (Tracking pollutant discharge elimination systems) - permit Organizations: PAT CALLAWAY (CONTACT/OWNER)
LOT 2 - SPRINGVIEW COMMERCE PA (LOT 2 UNIT 1 in DEBARY, FL)
National Pollutant Discharge Elimination System NON-MAJOR (Tracking pollutant discharge elimination systems) - permit Organizations: PAUL GODDARD (CONTACT/OWNER)
Housing units lacking complete plumbing facilities: 0.1% Housing units lacking complete kitchen facilities: 0.4%
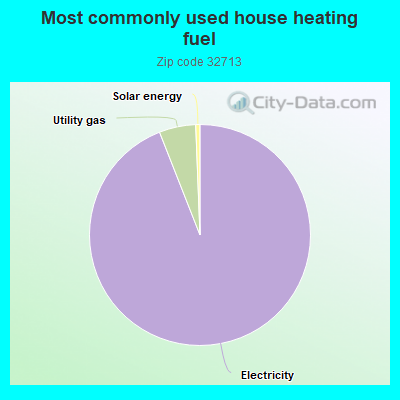
93.0%Electricity
5.3%Utility gas
0.6%Solar energy
Population in 1990: 9,491. Population change in the 1990s: +6,994 (+73.7%).
Place of birth for U.S.-born residents:
This state: 7,032
Northeast: 5,297
Midwest: 3,458
South: 3,038
West: 661
54% of the 32713 zip code residents lived in the same house 5 years ago. Out of people who lived in different houses, 37% lived in this county. Out of people who lived in different counties, 50% lived in Florida.
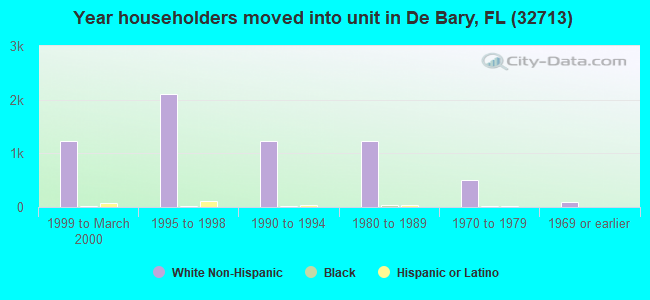
92% of the 32713 zip code residents lived in the same house 1 year ago. Out of people who lived in different houses, 33% moved from this county. Out of people who lived in different houses, 46% moved from different county within same state. Out of people who lived in different houses, 20% moved from different state. Out of people who lived in different houses, 5% moved from abroad.
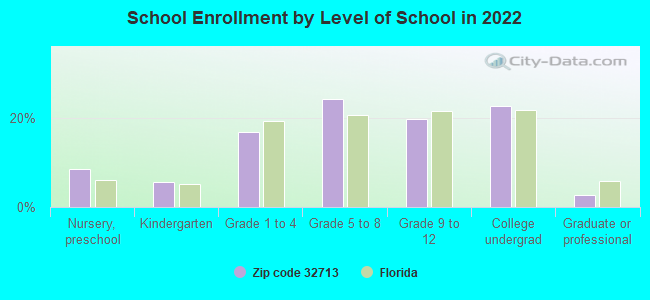
Private vs. public school enrollment:
Students in private schools in grades 1 to 8 (elementary and middle school): 234
Here:
12.3%
Florida:
15.8%
Students in private schools in grades 9 to 12 (high school): 41
Here:
4.5%
Florida:
12.9%
Students in private undergraduate colleges: 396
Here:
37.5%
Florida:
23.6%
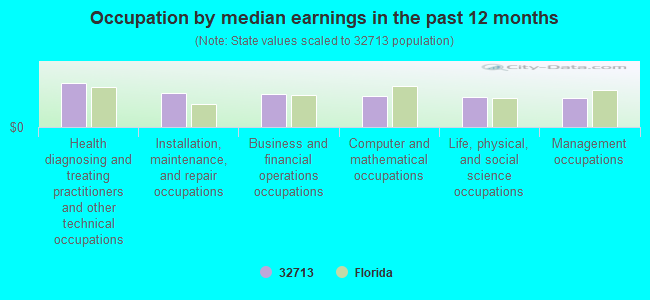
Occupation by median earnings in the past 12 months ($)
102,579Health diagnosing and treating practitioners and other technical occupations
80,020Installation, maintenance, and repair occupations
77,983Business and financial operations occupations
71,355Computer and mathematical occupations
68,965Life, physical, and social science occupations
67,492Management occupations
Companies with federal contracts located in this zip code:
ELECTRONIC COMPONENTS & FASTEN (335 GLEN COVE DR in DEBARY, FL; small business) : $164,643 in 16 contractsfrom 2005 to 2006
Contracts for Storage Tanks, Miscellaneous Electric Power and Distribution Equipment, Hand Tools, Power Driven, Nuts and Washers, and moreby Army Signed by year:2000: $0; 2001: $0; 2002: $0; 2003: $0; 2004: $0; 2005: $39,082; 2006: $125,561.
Biggest contracts:
$56,511 with Army for Storage Tanks. Signed on 2006-01-17. Completion date: 2006-03-15.
$32,960 with Army for Miscellaneous Electric Power and Distribution Equipment. Signed on 2005-01-21. Completion date: 2005-05-18.
$29,144 with Army for Hand Tools, Power Driven. Signed on 2005-12-16. Completion date: 2006-01-05.
$27,600 with Army for Nuts and Washers. Signed on 2006-01-18. Completion date: 2006-02-28.
SEMINOLE PRECAST, INC (331 BENSON JUNCTION RD in DEBARY, FL; small business)
$13,375 with U.S. Army Corps of Engineers - civil program financing only for Miscellaneous Construction Materials. Signed on 2003-07-07. Completion date: 2003-09-01.
BARANOWSKI AND ASSOCIATES INC (481 PINE MEADOW DRIVE NORT in DE BARY, FL; small business) : $4,680 in 4 contractsfrom 2002 to 2003
$3,000 with Navy for Maintenance, Repair and Rebuilding of Equipment -- Fire Control Equipment. Signed on 2002-01-22. Completion date: 2003-01-21.
$840 with Navy for Maintenance, Repair or Alteration of Real Property -- Office Buildings. Signed on 2003-03-26. Completion date: 2003-12-31.
$840, same as above.Signed on 2002-03-19. Completion date: 2000-12-31.
$0, same as above.Signed on 2002-03-19. Completion date: 2000-12-31.
Top industries in this zip code by the number of employees in 2005:
Health Care and Social Assistance: Nursing Care Facilities (100-249 employees: 2 establishments)
2002 - 2018 National Fire Incident Reporting System (NFIRS) incidents
According to the data from the years 2002 - 2018 the average number of fire incidents per year is 51. The highest number of reported fire incidents - 78 took place in 2011, and the least - 23 in 2018. The data has a dropping trend.
When looking into fire subcategories, the most reports belonged to: Outside Fires (50.6%), and Structure Fires (19.3%).
Fire incident types reported to NFIRS in Zip Code 32713


 Nearest zip codes: 32763, 32771, 32725, 32746, 32720, 32738.
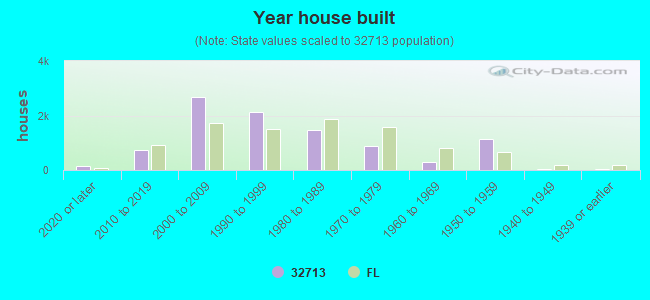


 According to the data from the years 2002 - 2018 the average number of fire incidents per year is 51. The highest number of reported fire incidents - 78 took place in 2011, and the least - 23 in 2018. The data has a dropping trend.
 When looking into fire subcategories, the most reports belonged to: Outside Fires (50.6%), and Structure Fires (19.3%).