Estimated zip code population in 2022: 46,906 Zip code population in 2010: 45,342 Zip code population in 2000: 43,347
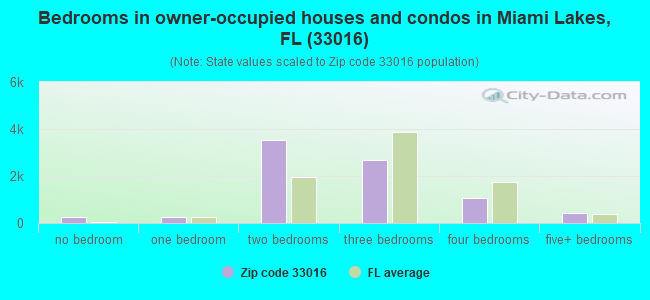
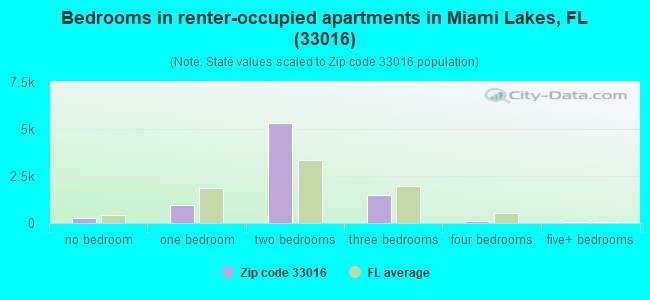
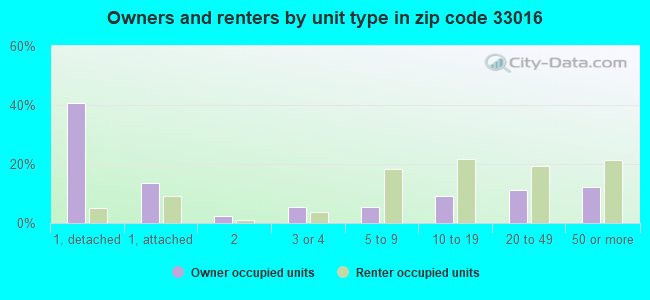
Houses and condos: 16,608 Renter-occupied apartments: 8,227
% of renters here:
50%
State:
33%
March 2022 cost of living index in zip code 33016: 104.4 (near average, U.S. average is 100)
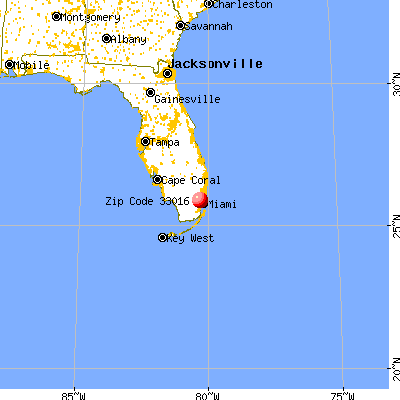
Land area: 4.4 sq. mi. Water area: 0.6 sq. mi.
Population density: 10,714 people per square mile
(high).
OSM Map
General Map
Google Map
MSN Map
OSM Map
General Map
Google Map
MSN Map
OSM Map
General Map
Google Map
MSN Map
OSM Map
General Map
Google Map
MSN Map
Please wait while loading the map...
Real estate property taxes paid for housing units in 2022:
This zip code:
0.5% ($1,779)
Florida:
0.7% ($2,529)
Median real estate property taxes paid for housing units with mortgages in 2022: $1,590 (0.5%) Median real estate property taxes paid for housing units with no mortgage in 2022: $1,945 (0.5%)
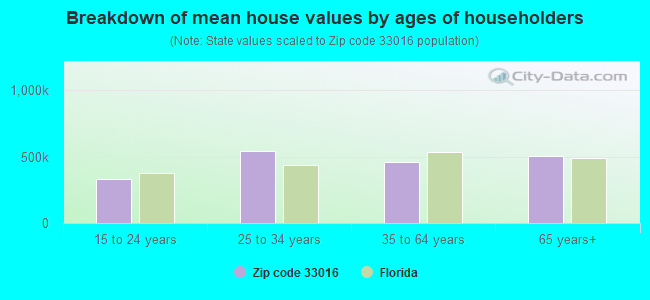
Estimated median house/condo value in 2022: $330,954
33016:
$330,954
Florida:
$354,100
According to our research of Florida and other state lists, there were 14 registered sex offenders living in 33016 zip code as of April 26, 2024. The ratio of all residents to sex offenders in zip code 33016 is 3,633 to 1. The ratio of registered sex offenders to all residents in this zip code is much lower than the state average.
Median resident age:
This zip code:
44.1 years
Florida median age:
42.7 years
Average household size:
This zip code:
2.8 people
Florida:
2.5 people
Averages for the 2020 tax year for zip code 33016, filed in 2021:
Average Adjusted Gross Income (AGI) in 2020: $47,099 (Individual Income Tax Returns)
Here:
$47,099
State:
$82,200
Salary/wage: $42,117 (reported on 77.9% of returns)
Here:
$42,117
State:
$58,347
(% of AGI for various income ranges: 1196.8% for AGIs below $25k, 3699.4% for AGIs $25k-50k, 6918.1% for AGIs $50k-75k, 10281.6% for AGIs $75k-100k, 18608.3% for AGIs $100k-200k, 80348.9% for AGIs over 200k)
Taxable interest for individuals: $4,009 (reported on 11.9% of returns)
This zip code:
$4,009
Florida:
$4,272
(% of AGI for various income ranges: 3.9% for AGIs below $25k, 8.6% for AGIs $25k-50k, 18.7% for AGIs $50k-75k, 30.4% for AGIs $75k-100k, 143.1% for AGIs $100k-200k, 4972.1% for AGIs over 200k)
Ordinary dividends: $4,541 (reported on 5.2% of returns)
Here:
$4,541
State:
$15,863
(% of AGI for various income ranges: 2.3% for AGIs below $25k, 4.9% for AGIs $25k-50k, 17.2% for AGIs $50k-75k, 56.0% for AGIs $75k-100k, 162.5% for AGIs $100k-200k, 1850.5% for AGIs over 200k)
Net capital gain/loss in AGI: +$18,481 (reported on 7.2% of returns)
Here:
+$18,481
State:
+$62,983
(% of AGI for various income ranges: 3.4% for AGIs $25k-50k, 40.7% for AGIs $50k-75k, 158.8% for AGIs $75k-100k, 608.3% for AGIs $100k-200k, 14006.8% for AGIs over 200k)
Profit/loss from business: +$5,095 (reported on 41.1% of returns)
Here:
+$5,095
State:
+$9,719
(% of AGI for various income ranges: 287.5% for AGIs below $25k, 138.4% for AGIs $25k-50k, 223.0% for AGIs $50k-75k, 417.1% for AGIs $75k-100k, 514.5% for AGIs $100k-200k, 3419.5% for AGIs over 200k)
Taxable individual retirement arrangement distribution: $14,931 (reported on 1.8% of returns)
33016:
$14,931
Florida:
$24,823
(% of AGI for various income ranges: 8.2% for AGIs below $25k, 12.2% for AGIs $25k-50k, 38.3% for AGIs $50k-75k, 119.5% for AGIs $75k-100k, 370.6% for AGIs $100k-200k, 640.5% for AGIs over 200k)
Total itemized deductions: $34,557 (reported on 6.1% of returns)
Here:
$34,557
State:
$45,393
(% of AGI for various income ranges: 29.4% for AGIs below $25k, 172.7% for AGIs $25k-50k, 433.7% for AGIs $50k-75k, 721.8% for AGIs $75k-100k, 1387.4% for AGIs $100k-200k, 8873.2% for AGIs over 200k)
Charity contributions: $7,932 (reported on 4.2% of returns)
Here:
$7,932
State:
$20,178
(% of AGI for various income ranges: 1.7% for AGIs below $25k, 15.5% for AGIs $25k-50k, 53.5% for AGIs $50k-75k, 96.2% for AGIs $75k-100k, 213.4% for AGIs $100k-200k, 2126.8% for AGIs over 200k)
Taxes paid: $9,399 (reported on 5.9% of returns)
33016:
$9,399
State:
$6,967
(% of AGI for various income ranges: 8.1% for AGIs below $25k, 67.7% for AGIs $25k-50k, 144.1% for AGIs $50k-75k, 206.7% for AGIs $75k-100k, 331.2% for AGIs $100k-200k, 1267.4% for AGIs over 200k)
Earned income credit: $2,073 (reported on 33.0% of returns)
Here:
$2,073
State:
$2,306
(% of AGI for various income ranges: 135.0% for AGIs below $25k, 76.7% for AGIs $25k-50k, 0.5% for AGIs $50k-75k)
Percentage of individuals using paid preparers for their 2020 taxes: 89.8%
Here:
90%
State:
92%
(% for various income ranges: 88.2% for AGIs below $25k, 91.5% for AGIs $25k-50k, 92.0% for AGIs $50k-75k, 91.7% for AGIs $75k-100k, 90.0% for AGIs $100k-200k, 86.6% for AGIs over 200k)
Averages for the 2012 tax year for zip code 33016, filed in 2013:
Average Adjusted Gross Income (AGI) in 2012: $39,652 (Individual Income Tax Returns)
Here:
$39,652
State:
$60,316
Salary/wage: $33,141 (reported on 83.1% of returns)
Here:
$33,141
State:
$45,277
(% of AGI for various income ranges: 77.7% for AGIs below $25k, 92.9% for AGIs $25k-50k, 88.9% for AGIs $50k-75k, 83.0% for AGIs $75k-100k, 77.6% for AGIs $100k-200k, 31.3% for AGIs over 200k)
Taxable interest for individuals: $2,401 (reported on 13.1% of returns)
This zip code:
$2,401
Florida:
$3,587
(% of AGI for various income ranges: 0.3% for AGIs below $25k, 0.3% for AGIs $25k-50k, 0.2% for AGIs $50k-75k, 0.9% for AGIs $75k-100k, 0.6% for AGIs $100k-200k, 1.8% for AGIs over 200k)
Ordinary dividends: $6,951 (reported on 4.4% of returns)
Here:
$6,951
State:
$12,831
(% of AGI for various income ranges: 0.3% for AGIs below $25k, 0.5% for AGIs $25k-50k, 0.3% for AGIs $50k-75k, 0.4% for AGIs $75k-100k, 0.9% for AGIs $100k-200k, 1.5% for AGIs over 200k)
Net capital gain/loss in AGI: +$42,124 (reported on 3.7% of returns)
Here:
+$42,124
State:
+$33,493
(% of AGI for various income ranges: 0.3% for AGIs $75k-100k, 1.2% for AGIs $100k-200k, 13.3% for AGIs over 200k)
Profit/loss from business: +$6,696 (reported on 30.3% of returns)
Here:
+$6,696
State:
+$10,012
(% of AGI for various income ranges: 16.6% for AGIs below $25k, 2.8% for AGIs $25k-50k, 2.6% for AGIs $50k-75k, 2.3% for AGIs $75k-100k, 3.1% for AGIs $100k-200k, 1.7% for AGIs over 200k)
Taxable individual retirement arrangement distribution: $17,148 (reported on 1.8% of returns)
33016:
$17,148
Florida:
$21,544
(% of AGI for various income ranges: 0.5% for AGIs below $25k, 0.6% for AGIs $25k-50k, 0.8% for AGIs $50k-75k, 1.0% for AGIs $75k-100k, 1.8% for AGIs $100k-200k, 0.8% for AGIs over 200k)
Self-employment retirement plans: $6,314 (reported on 0.3% of returns)
33016:
$6,314
Florida:
$20,611
Total itemized deductions: $19,846 (20% of AGI, reported on 20.4% of returns)
Here:
$19,846
State:
$25,533
Here:
19.7% of AGI
State:
18.0% of AGI
(% of AGI for various income ranges: 6.0% for AGIs below $25k, 13.7% for AGIs $25k-50k, 14.7% for AGIs $50k-75k, 14.2% for AGIs $75k-100k, 14.7% for AGIs $100k-200k, 5.8% for AGIs over 200k)
Charity contributions: $2,540 (reported on 14.8% of returns)
Here:
$2,540
State:
$5,698
(% of AGI for various income ranges: 0.3% for AGIs below $25k, 1.0% for AGIs $25k-50k, 1.2% for AGIs $50k-75k, 1.4% for AGIs $75k-100k, 1.6% for AGIs $100k-200k, 0.9% for AGIs over 200k)
Taxes paid: $3,910 (reported on 19.0% of returns)
33016:
$3,910
State:
$6,203
(% of AGI for various income ranges: 0.8% for AGIs below $25k, 1.8% for AGIs $25k-50k, 2.7% for AGIs $50k-75k, 3.1% for AGIs $75k-100k, 3.6% for AGIs $100k-200k, 1.3% for AGIs over 200k)
Earned income credit: $2,320 (reported on 39.0% of returns)
Here:
$2,320
State:
$2,372
(% of AGI for various income ranges: 10.2% for AGIs below $25k, 1.4% for AGIs $25k-50k)
Percentage of individuals using paid preparers for their 2012 taxes: 73.5%
Here:
74%
State:
54%
(% for various income ranges: 72.6% for AGIs below $25k, 74.3% for AGIs $25k-50k, 73.8% for AGIs $50k-75k, 75.0% for AGIs $75k-100k, 75.9% for AGIs $100k-200k, 86.5% for AGIs over 200k)
Averages for the 2004 tax year for zip code 33016, filed in 2005:
Average Adjusted Gross Income (AGI) in 2004: $33,704 (Individual Income Tax Returns)
Here:
$33,704
State:
$50,523
Salary/wage: $29,889 (reported on 85.5% of returns)
Here:
$29,889
State:
$39,563
(% of AGI for various income ranges: 75.5% for AGIs below $10k, 85.3% for AGIs $10k-25k, 93.0% for AGIs $25k-50k, 88.8% for AGIs $50k-75k, 82.8% for AGIs $75k-100k, 51.6% for AGIs over 100k)
Taxable interest for individuals: $1,741 (reported on 20.6% of returns)
This zip code:
$1,741
Florida:
$3,211
(% of AGI for various income ranges: 1.5% for AGIs below $10k, 0.5% for AGIs $10k-25k, 0.4% for AGIs $25k-50k, 0.7% for AGIs $50k-75k, 1.2% for AGIs $75k-100k, 2.0% for AGIs over 100k)
Taxable dividends: $2,784 (reported on 5.3% of returns)
Here:
$2,784
State:
$6,129
(% of AGI for various income ranges: 0.5% for AGIs below $10k, 0.1% for AGIs $10k-25k, 0.1% for AGIs $25k-50k, 0.3% for AGIs $50k-75k, 0.5% for AGIs $75k-100k, 0.9% for AGIs over 100k)
Net capital gain/loss: +$23,888 (reported on 5.5% of returns)
Here:
+$23,888
State:
+$27,205
(% of AGI for various income ranges: 0.0% for AGIs below $10k, 0.2% for AGIs $10k-25k, 0.3% for AGIs $25k-50k, 0.9% for AGIs $50k-75k, 2.2% for AGIs $75k-100k, 10.4% for AGIs over 100k)
Profit/loss from business: +$7,798 (reported on 27.1% of returns)
Here:
+$7,798
State:
+$10,634
(% of AGI for various income ranges: 43.0% for AGIs below $10k, 11.6% for AGIs $10k-25k, 3.2% for AGIs $25k-50k, 3.0% for AGIs $50k-75k, 3.4% for AGIs $75k-100k, 3.8% for AGIs over 100k)
IRA payment deduction: $2,965 (reported on 2.0% of returns)
33016:
$2,965
Florida:
$3,082
(% of AGI for various income ranges: 0.1% for AGIs below $10k, 0.1% for AGIs $10k-25k, 0.2% for AGIs $25k-50k, 0.2% for AGIs $50k-75k, 0.3% for AGIs $75k-100k, 0.2% for AGIs over 100k)
Self-employed pension: $13,414 (reported on 0.1% of returns)
Here:
$13,414
Florida:
$15,857
Total itemized deductions: $17,298 (29% of AGI, reported on 31.0% of returns)
Here:
$17,298
State:
$20,370
Here:
29.1% of AGI
State:
20.7% of AGI
(% of AGI for various income ranges: 8.0% for AGIs below $10k, 13.7% for AGIs $10k-25k, 23.3% for AGIs $25k-50k, 21.1% for AGIs $50k-75k, 20.0% for AGIs $75k-100k, 9.8% for AGIs over 100k)
Charity contributions deductions: $1,895 (3% of AGI, reported on 25.8% of returns)
Here:
$1,895
State:
$4,064
Here:
3.0% of AGI
State:
3.8% of AGI
(% of AGI for various income ranges: 0.4% for AGIs below $10k, 0.9% for AGIs $10k-25k, 1.9% for AGIs $25k-50k, 1.9% for AGIs $50k-75k, 1.9% for AGIs $75k-100k, 1.3% for AGIs over 100k)
Total tax: $5,466 (reported on 67.4% of returns)
33016:
$5,466
State:
$9,431
(% of AGI for various income ranges: 7.1% for AGIs below $10k, 3.5% for AGIs $10k-25k, 4.6% for AGIs $25k-50k, 7.9% for AGIs $50k-75k, 9.9% for AGIs $75k-100k, 21.4% for AGIs over 100k)
Earned income credit: $1,868 (reported on 36.4% of returns)
Here:
$1,868
State:
$1,808
Percentage of individuals using paid preparers for their 2004 taxes: 72.8%
Here:
73%
State:
60%
(% for various income ranges: 71.4% for AGIs below $10k, 74.0% for AGIs $10k-25k, 71.1% for AGIs $25k-50k, 73.3% for AGIs $50k-75k, 72.2% for AGIs $75k-100k, 79.5% for AGIs over 100k)
Likely homosexual households (counted as self-reported same-sex unmarried-partner households)
Lesbian couples: 0.1% of all households
Gay men: 0.0% of all households
Household received Food Stamps/SNAP in the past 12 months: 6,263 Household did not receive Food Stamps/SNAP in the past 12 months: 9,955
Women who had a birth in the past 12 months: 531 (205 now married, 306 unmarried) Women who did not have a birth in the past 12 months: 9,987 (4,191 now married, 5,797 unmarried)
Housing units in zip code 33016 with a mortgage: 4,883 (422 second mortgage, 25 home equity loan, 331 both second mortgage and home equity loan) Houses without a mortgage: 131
Median monthly owner costs for units with a mortgage: $1,429 Median monthly owner costs for units without a mortgage: $596
Residents with income below the poverty level in 2022:
This zip code:
15.1%
Whole state:
12.7%
Residents with income below 50% of the poverty level in 2022:
This zip code:
10.2%
Whole state:
6.6%
Median number of rooms in houses and condos:
Here:
4.9
State:
5.9
Median number of rooms in apartments:
Here:
4.1
State:
4.2
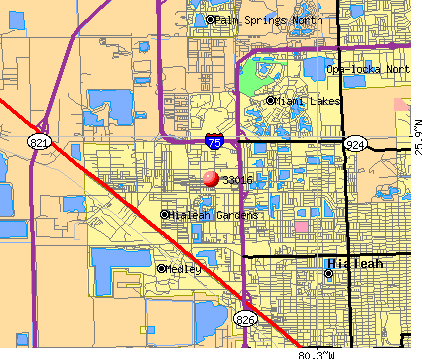
Notable locations in this zip code not listed on our city pages
Notable locations in zip code 33016: El Mercado (A), 826-I-75 Industrial Park (B), Wise Kids Day Care Center (C), Young Children In Action Day Care Center (D), The Waterford Convalescent Center (E), Tutor Time Child Care Learning Center (F), Palmetto Health Center (G), Nuevo Amanacer Day Care Center (H), Nathalie's Day Care Center (I), Little Pumpkin Day Care Center (J), Kids at Heart Day Care Center (K), Jesus Place Day Care Center (L), Hialeah Police Substation (M), Centro Mater West Day Care Center (N), Miami - Dade County Fire Rescue Station 64 (O), Hialeah Fire Department Station 7 (P), Miami - Dade County Fire Rescue Station 28 (Q). Display/hide their locations on the map
In group quarters: 337 (-1 institutionalized population)
Size of family households: 3,487 2-persons, 4,885 3-persons, 2,948 4-persons, 1,041 5-persons, 261 6-persons, 179 7-or-more-persons
Size of nonfamily households: 2,830 1-person, 714 2-persons, 79 3-persons
4,401 married couples with children.
3,221 single-parent households (712 men, 2,509 women).
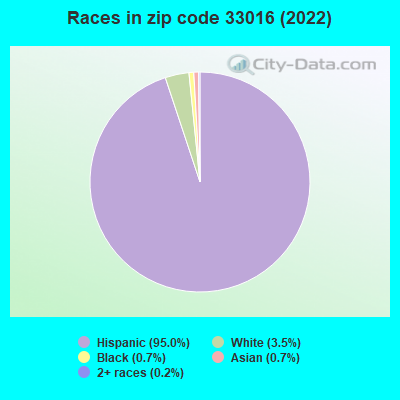
7.3% of residents of 33016 zip code speak English at home.
93.0% of residents speak Spanish at home (42% very well, 16% well, 22% not well, 20% not at all).
0.7% of residents speak other Indo-European language at home (81% very well, 13% well, 3% not well, 2% not at all).
0.1% of residents speak Asian or Pacific Island language at home (61% not well, 39% not at all).
0.2% of residents speak other language at home (88% very well, 12% well).
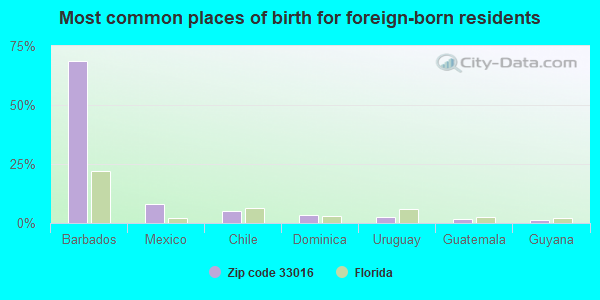
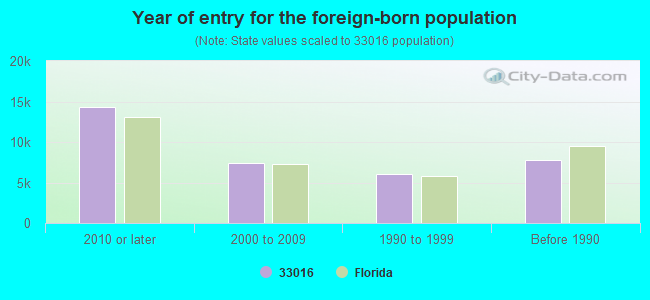
Foreign born population: 34,240 (73.0%) (63.1% of them are naturalized citizens)
Major facilities with environmental interests located in this zip code:
MAACO AUTO PAINTING & BODY WORK (10115 NW 79TH AVE in HIALEAH GARDENS, FL)
STATE MASTER (FDM) - CHAZ-FLR000059055, HAZARDOUS WASTE REGULATION PROGRAM Small Quantity Generators, between 100 kg and 1000 kg of hazardous waste/month (Resource Conservation and Recovery Act (tracking hazardous waste)) - notification Business SIC classification: TOP, BODY, AND UPHOLSTERY REPAIR SHOPS AND PAINT SHOPS Organizations: INTERACTIVE ENTERPRISES LLC (CONTACT/OPERATOR)
, RIFKIN INVESTMENTS (CONTACT/OWNER)
SARI EXPRESS FORWARDERS INC (9501 NW 80TH AVE in HIALEAH GARDENS, FL)
STATE MASTER (FDM) - CHAZ-FLD099069189, HAZARDOUS WASTE REGULATION PROGRAM Small Quantity Generators, between 100 kg and 1000 kg of hazardous waste/month (Resource Conservation and Recovery Act (tracking hazardous waste)) - notification Business SIC classification: ARRANGEMENT OF TRANSPORTATION OF FREIGHT AND CARGO Organizations: AMERICAN COMPOSITES INC, MARIO RUIZ, DIR OF QC (CONTACT/OWNER)
Alternative names: AMERICAN COMPOSITES INC
COASTLINE EQUIPMENT CO INC (12601 W OKEECHOBEE RD in HIALEAH GARDENS, FL)
STATE MASTER (FDM) - WAFR-FLA406465, INDUSTRIAL WASTEWATER PROGRAM Small Quantity Generators, between 100 kg and 1000 kg of hazardous waste/month (Resource Conservation and Recovery Act (tracking hazardous waste)) - notification Business SIC classification: INSTALLATION OR ERECTION OF BUILDING EQUIPMENT; HEAVY CONSTRUCTION EQUIPMENT RENTAL AND LEASING Organizations: BRIGGS CONSTRUCTION EQUIPMENT - MIAMI OFFICE (CONTACT/MANAGEMENT OFFICIAL)
, THERESA SILER, EPA DIR (CONTACT/OWNER)
Alternative names: BRIGGS CONSTRUCTION EQUIPMENT - MIAMI RECYLE SYSTEM
PAVEX CORPORATION (1.5MI W OF FL TPK/1MI N 170 ST in MIAMI, FL)
AIR SYNTHETIC MINOR (AIRS/AFS) (Integrated Compliance Information System) - ICIS-04-2000-0195, FORMAL ENFORCEMENT ACTION CRITERIA AND HAZARDOUS AIR POLLUTANT INVENTORY (Inventory of air pollution sources) Business SIC classification: ASPHALT PAVING MIXTURES AND BLOCKS
JOSE MARTI MIDDLE SCHOOL (5701 W. 24TH AVENUE in HIALEAH, FL)
(National Center for Education Statistics) - STATE ID-6421 Organizations: DADE COUNTY SCHOOL DISTRICT (SCHOOL DISTRICT)
BOB GRAHAM EDUCATIONAL CENTER (15901 NW 79TH AVENUE in MIAMI, FL)
(National Center for Education Statistics) - STATE ID-0091 Organizations: DADE COUNTY SCHOOL DISTRICT (SCHOOL DISTRICT)
MATER ACADEMY CHARTER HIGH SCHOOL (7901 NW 103RD STREET in HIALEAH GARDENS, FL)
(National Center for Education Statistics) - STATE ID-7160 Organizations: DADE COUNTY SCHOOL DISTRICT (SCHOOL DISTRICT)
MATER CENTER CHARTER SCHOOL (7700 NW 98 STREET in HIALEAH GARDENS, FL)
(National Center for Education Statistics) - STATE ID-0100 Organizations: DADE COUNTY SCHOOL DISTRICT (SCHOOL DISTRICT)
ADT 22 (2061 W. 62ND STREET in MIAMI, FL)
(Integrated Compliance Information System) - ICIS-HQ-2002-6000, FORMAL ENFORCEMENT ACTION
MARBLE LITE CORPORATION (9920 N.W. 79 AVE. in HIALEAH GARDENS, FL)
CRITERIA AND HAZARDOUS AIR POLLUTANT INVENTORY (Inventory of air pollution sources) (Resource Conservation and Recovery Act (tracking hazardous waste)) TRI REPORTER (Tracking of toxic chemicals releasing facilities) Business SIC classification: PLASTICS PLUMBING FIXTURES Business NAICS classification: PLASTICS PLUMBING FIXTURE MANUFACTURING. Organizations: PEREZ WESTOR PRES (CONTACT/OWNER)
Alternative names: MARBLE LITE PRODUCTS INC
AMERICAN BUMPER CORPORATION (7851 NW 64TH ST in HIALEAH, FL)
AIR MINOR (AIRS/AFS) TSD (Resource Conservation and Recovery Act (tracking hazardous waste)) Business SIC classification: ELECTROPLATING, PLATING, POLISHING, ANODIZING, AND COLORING Business NAICS classification: ALL OTHER AUTOMOTIVE REPAIR AND MAINTENANCE. Organizations: MERDARDO MILIAN, SEC & TREAS (CONTACT/OWNER)
6-STORY OFFICE BUILDING (2300 W 84 ST in HIALEAH, FL)
National Pollutant Discharge Elimination System NON-MAJOR (Tracking pollutant discharge elimination systems) - permit Organizations: LUIS ESPINOSA (CONTACT/OWNER)
POWER SWEEPING SERVICE INCORPORATED (9500 NORTHWEST 79TH AVENUE BAY #15 in HIALEAH GARDENS, FL)
(Resource Conservation and Recovery Act (tracking hazardous waste)) Organizations: JOSEPH CAPLAND, PRES & GEN (CONTACT/OWNER)
Housing units lacking complete plumbing facilities: 0.1% Housing units lacking complete kitchen facilities: 0.9%
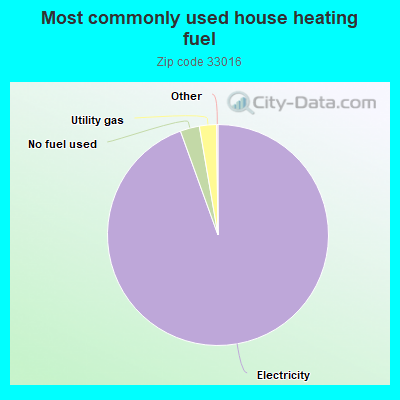
94.4%Electricity
2.8%No fuel used
2.5%Utility gas
Population in 1990: 32,053. Population change in the 1990s: +11,294 (+35.2%).
Place of birth for U.S.-born residents:
This state: 10,653
Northeast: 766
Midwest: 101
South: 364
West: 262
46% of the 33016 zip code residents lived in the same house 5 years ago. Out of people who lived in different houses, 87% lived in this county. Out of people who lived in different counties, 50% lived in Florida.
92% of the 33016 zip code residents lived in the same house 1 year ago. Out of people who lived in different houses, 74% moved from this county. Out of people who lived in different houses, 4% moved from different county within same state. Out of people who lived in different houses, 3% moved from different state. Out of people who lived in different houses, 15% moved from abroad.
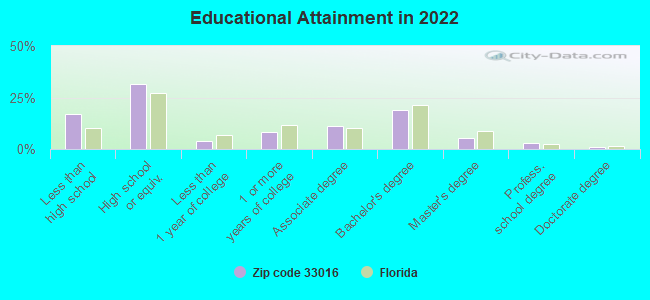
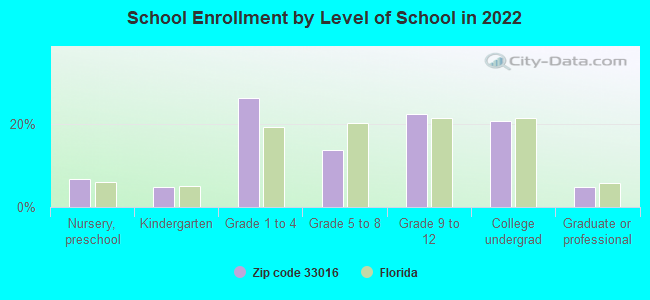
Private vs. public school enrollment:
Students in private schools in grades 1 to 8 (elementary and middle school): 1,116
Here:
26.7%
Florida:
15.8%
Students in private schools in grades 9 to 12 (high school): 315
Here:
13.6%
Florida:
12.9%
Students in private undergraduate colleges: 369
Here:
17.4%
Florida:
23.6%
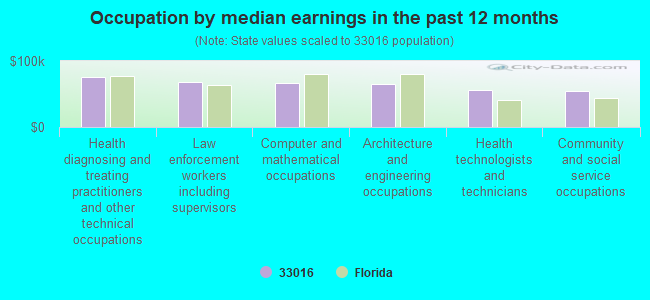
Occupation by median earnings in the past 12 months ($)
75,744Health diagnosing and treating practitioners and other technical occupations
68,680Law enforcement workers including supervisors
66,785Computer and mathematical occupations
65,147Architecture and engineering occupations
56,032Health technologists and technicians
54,033Community and social service occupations
Companies with biggest federal contracts located in this zip code:
BERNARD CAP COMPANY, INC (9800 NW 79TH AVE in HIALEAH GARDEN, FL; small business) : $13,560,469 in 189 contractsfrom 1999 to 2006
Contracts for Clothing, Special Purpose, Outerwear, Men's, Outerwear, Women's, Hospital Furniture, Equipment, Utensils, and Supplies, and moreby Defense Logistics Agency, U.S. Coast Guard, Air Force, Army, and others Signed by year:2000: $2,422,383; 2001: $1,240,518; 2002: $1,051,112; 2003: $77,840; 2004: $3,018,633; 2005: $1,608,808; 2006: $3,613,799.
Biggest contracts:
$2,166,300 with Defense Logistics Agency for Clothing, Special Purpose. Signed on 2006-06-29. Completion date: 2006-09-26.
$1,850,400, same as above.Signed on 2004-01-20. Completion date: 2004-11-27.
$545,490, same as above.Signed on 2005-08-23. Completion date: 2005-12-30.
$531,298 with Defense Logistics Agency for Outerwear, Men's. Signed on 2002-03-06. Completion date: 2003-03-23.
ALTERNATIVE BIOMEDICAL SERVICE (2326 WEST 78TH STREET in HIALEAH, TX; small business) : $174,114 in 7 contractsfrom 2001 to 2004
Contracts for Maintenance, Repair and Rebuilding of Equipment -- Medical, Dental, and Veterinary Equipment and Supplies by Army, Navy, Air Force Signed by year:2000: $0; 2001: $70,248; 2002: $37,917; 2003: $58,249; 2004: $7,700; 2005: $0; 2006: $0.
Biggest contracts:
$46,500 with Army for Maintenance, Repair and Rebuilding of Equipment -- Medical, Dental, and Veterinary Equipment and Supplies. Taking place in DC. Signed on 2003-04-24. Completion date: 2005-04-30.
$45,000, same as above.Signed on 2001-04-24. Completion date: 2002-04-30.
$37,917, same as above.Signed on 2002-06-03. Completion date: 2005-04-30.
$25,248 with Navy for Maintenance, Repair and Rebuilding of Equipment -- Medical, Dental, and Veterinary Equipment and Supplies. Signed on 2001-08-31. Completion date: 2005-09-30.
NOSA, INC. (6400 WEST 20TH AVE. in HIALEAH, FL)
$102,570 with Army for Recreational and Gymnastic Equipment. Signed on 2000-06-26. Completion date: 2000-08-26.
R S AVIATION INC (7901 W 25TH CT in HIALEAH, FL; small business) : $56,386 in 7 contractsfrom 2002 to 2005
Contracts for Metal Screening, Pipe, Tube and Rigid Tubing, Gas Turbines and Jet Engines, Non-Aircraft; and Components, Automated News Services, Data Services, or Other Information Services. Buying data, the electronic equivalent of books, periodicals, newspapers, etc. by Navy, Army Signed by year:2000: $0; 2001: $0; 2002: $55,774; 2003: $462; 2004: $0; 2005: $150; 2006: $0.
Biggest contracts:
$53,750 with Navy for Metal Screening. Signed on 2002-06-06. Completion date: 2002-07-10.
$875 with Army for Pipe, Tube and Rigid Tubing. Taking place in MO. Signed on 2002-02-14. Completion date: 2002-03-07.
$699 with Army for Pipe, Tube and Rigid Tubing. Signed on 2002-10-18. Completion date: 2002-11-13.
$462, same as above.Signed on 2003-01-13. Completion date: 2003-02-19.
PITNEY BOWES INC (14361 COMMERCE WAY in HIALEAH, FL)
$40,122 with Army for Lease or Rental of Equipment -- Special Industry Machinery. Signed on 1999-12-20. Completion date: 1999-12-30.
BEST GARAGE DOOR, INC (9780 N W 79 AVENUE in HIALEAH, FL; small business)
$17,900 with Air Force for Maintenance, Repair and Rebuilding of Equipment -- Construction and Building Materials. Signed on 2004-10-01. Completion date: 2005-09-30.
PARADISE CHRISTIAN SCHOOL & DE (6184 WEST 21 COURT in HIALEAH, FL; small business) : $15,873 in 22 contractsfrom 2003 to 2005
Contracts for Operation of Government-Owned Facilities -- Other Educational Buildings, Other Social Services, Education Services, Lease or Rental of Facilities -- Office Buildings by Army Signed by year:2000: $0; 2001: $0; 2002: $0; 2003: $50; 2004: $4,559; 2005: $11,264; 2006: $0.
Biggest contracts:
$2,867 with Army for Operation of Government-Owned Facilities -- Other Educational Buildings. Signed on 2005-09-30. Completion date: 2005-09-30.
$1,408 with Army for Other Social Services. Signed on 2005-06-24. Completion date: 2005-06-30.
$1,012, same as above.Signed on 2005-04-12. Completion date: 2005-03-31.
$968 with Army for Operation of Government-Owned Facilities -- Other Educational Buildings. Signed on 2005-09-14. Completion date: 2005-06-30.
DANTZLER INC (7975 NW 154TH STREET in MIAMI LAKES, FL; small business) : $13,550 in 2 contractsin 2005
$8,641 with Army for Lumber and Related Basic Wood Materials. Signed on 2005-09-07. Completion date: 2005-09-14.
$4,909 with Army for Millwork. Signed on 2005-04-19. Completion date: 2005-04-26.
STILES CONVEYORS AND TRANSMISS (2310 W 78TH ST in HIALEAH, FL; small business)
$10,600 with Army for Freight Elevators. Signed on 2004-10-01. Completion date: 2005-09-30.
SOUTH FLORIDA COUNCIL INC (15255 NW 82ND AVE in HIALEAH, FL)
$9,300 with Army for Other Education and Training Services. Signed on 2004-06-10. Completion date: 2004-06-27.
Top industries in this zip code by the number of employees in 2005:
Health Care and Social Assistance: General Medical and Surgical Hospitals (over 1000 employees: 1 establishment)
Administrative and Support and Waste Management and Remediation Services: Temporary Help Services (250-499: 1, 100-249: 3, 50-99: 2, 1-4: 3)
2003 - 2018 National Fire Incident Reporting System (NFIRS) incidents
According to the data from the years 2003 - 2018 the average number of fire incidents per year is 42. The highest number of reported fires - 79 took place in 2009, and the least - 0 in 2005. The data has a growing trend.
When looking into fire subcategories, the most reports belonged to: Structure Fires (42.2%), and Mobile Property/Vehicle Fires (29.3%).
Fire incident types reported to NFIRS in Zip Code 33016


 Nearest zip codes: 33014, 33012, 33015, 33018, 33054, 33166.
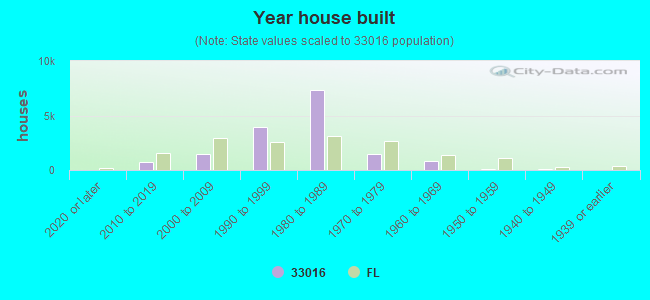


 According to the data from the years 2003 - 2018 the average number of fire incidents per year is 42. The highest number of reported fires - 79 took place in 2009, and the least - 0 in 2005. The data has a growing trend.
 When looking into fire subcategories, the most reports belonged to: Structure Fires (42.2%), and Mobile Property/Vehicle Fires (29.3%).