Estimated zip code population in 2022: 70,449 Zip code population in 2010: 63,544 Zip code population in 2000: 49,279
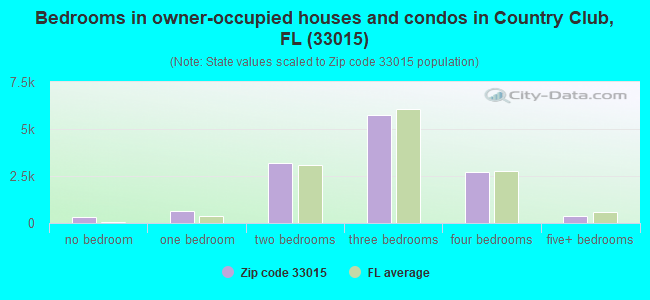
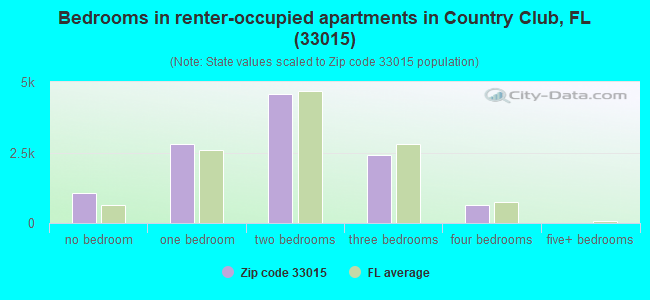
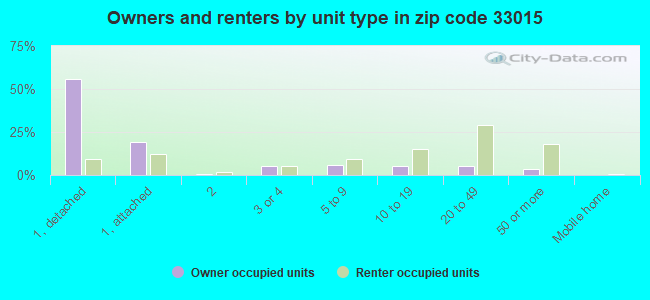
Houses and condos: 24,742 Renter-occupied apartments: 11,446
% of renters here:
47%
State:
33%
March 2022 cost of living index in zip code 33015: 104.7 (near average, U.S. average is 100)
Land area: 5.8 sq. mi. Water area: 0.6 sq. mi.
Population density: 12,095 people per square mile
(very high).
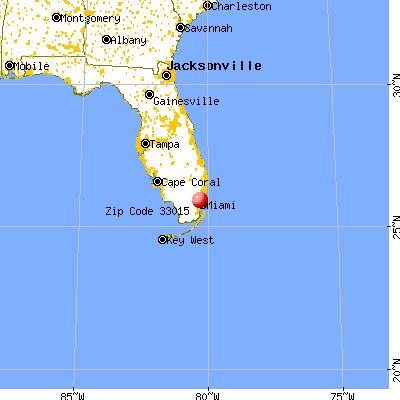
OSM Map
General Map
Google Map
MSN Map
OSM Map
General Map
Google Map
MSN Map
OSM Map
General Map
Google Map
MSN Map
OSM Map
General Map
Google Map
MSN Map
Please wait while loading the map...
Real estate property taxes paid for housing units in 2022:
This zip code:
0.7% ($2,917)
Florida:
0.7% ($2,529)
Median real estate property taxes paid for housing units with mortgages in 2022: $2,914 (0.7%) Median real estate property taxes paid for housing units with no mortgage in 2022: $2,918 (0.6%)
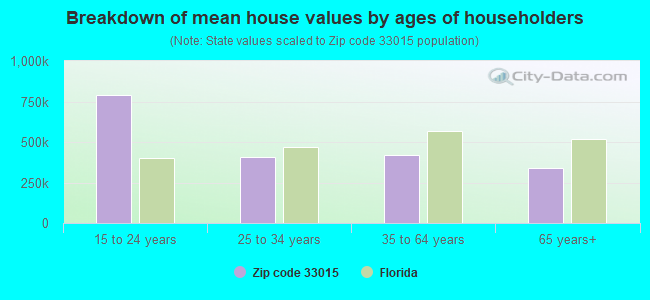
Estimated median house/condo value in 2022: $434,324
33015:
$434,324
Florida:
$354,100
According to our research of Florida and other state lists, there were 14 registered sex offenders living in 33015 zip code as of April 27, 2024. The ratio of all residents to sex offenders in zip code 33015 is 4,937 to 1. The ratio of registered sex offenders to all residents in this zip code is much lower than the state average.
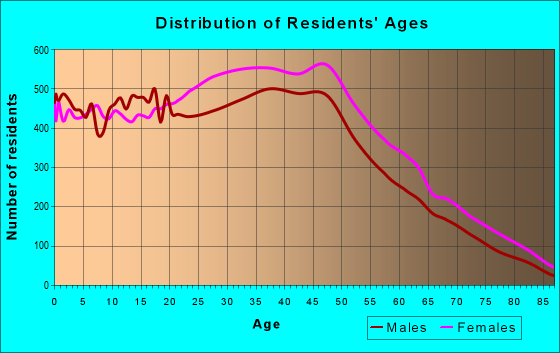
Median resident age:
This zip code:
40.8 years
Florida median age:
42.7 years
Average household size:
This zip code:
2.9 people
Florida:
2.5 people
Averages for the 2020 tax year for zip code 33015, filed in 2021:
Average Adjusted Gross Income (AGI) in 2020: $43,698 (Individual Income Tax Returns)
Here:
$43,698
State:
$82,200
Salary/wage: $43,673 (reported on 79.9% of returns)
Here:
$43,673
State:
$58,347
(% of AGI for various income ranges: 1155.3% for AGIs below $25k, 3740.0% for AGIs $25k-50k, 6944.9% for AGIs $50k-75k, 10053.2% for AGIs $75k-100k, 17612.1% for AGIs $100k-200k, 55174.7% for AGIs over 200k)
Taxable interest for individuals: $859 (reported on 11.9% of returns)
This zip code:
$859
Florida:
$4,272
(% of AGI for various income ranges: 4.3% for AGIs below $25k, 5.4% for AGIs $25k-50k, 18.1% for AGIs $50k-75k, 14.6% for AGIs $75k-100k, 43.4% for AGIs $100k-200k, 690.0% for AGIs over 200k)
Ordinary dividends: $1,940 (reported on 5.4% of returns)
Here:
$1,940
State:
$15,863
(% of AGI for various income ranges: 2.7% for AGIs below $25k, 5.8% for AGIs $25k-50k, 12.4% for AGIs $50k-75k, 31.2% for AGIs $75k-100k, 59.3% for AGIs $100k-200k, 650.0% for AGIs over 200k)
Net capital gain/loss in AGI: +$8,535 (reported on 7.4% of returns)
Here:
+$8,535
State:
+$62,983
(% of AGI for various income ranges: 0.4% for AGIs below $25k, 8.9% for AGIs $25k-50k, 26.9% for AGIs $50k-75k, 80.9% for AGIs $75k-100k, 324.5% for AGIs $100k-200k, 9005.3% for AGIs over 200k)
Profit/loss from business: +$4,163 (reported on 38.8% of returns)
Here:
+$4,163
State:
+$9,719
(% of AGI for various income ranges: 271.5% for AGIs below $25k, 111.0% for AGIs $25k-50k, 175.7% for AGIs $50k-75k, 165.4% for AGIs $75k-100k, 272.8% for AGIs $100k-200k, 1526.0% for AGIs over 200k)
Taxable individual retirement arrangement distribution: $14,433 (reported on 2.1% of returns)
33015:
$14,433
Florida:
$24,823
(% of AGI for various income ranges: 10.2% for AGIs below $25k, 19.5% for AGIs $25k-50k, 38.3% for AGIs $50k-75k, 104.8% for AGIs $75k-100k, 197.9% for AGIs $100k-200k, 936.0% for AGIs over 200k)
Total itemized deductions: $28,308 (reported on 7.0% of returns)
Here:
$28,308
State:
$45,393
(% of AGI for various income ranges: 34.2% for AGIs below $25k, 165.2% for AGIs $25k-50k, 450.1% for AGIs $50k-75k, 705.4% for AGIs $75k-100k, 1016.7% for AGIs $100k-200k, 5134.0% for AGIs over 200k)
Charity contributions: $5,869 (reported on 5.2% of returns)
Here:
$5,869
State:
$20,178
(% of AGI for various income ranges: 2.7% for AGIs below $25k, 18.7% for AGIs $25k-50k, 66.3% for AGIs $50k-75k, 131.8% for AGIs $75k-100k, 203.0% for AGIs $100k-200k, 744.7% for AGIs over 200k)
Taxes paid: $7,568 (reported on 6.7% of returns)
33015:
$7,568
State:
$6,967
(% of AGI for various income ranges: 8.6% for AGIs below $25k, 52.1% for AGIs $25k-50k, 123.9% for AGIs $50k-75k, 175.3% for AGIs $75k-100k, 254.8% for AGIs $100k-200k, 757.3% for AGIs over 200k)
Earned income credit: $2,177 (reported on 29.1% of returns)
Here:
$2,177
State:
$2,306
(% of AGI for various income ranges: 135.0% for AGIs below $25k, 76.1% for AGIs $25k-50k, 0.5% for AGIs $50k-75k)
Percentage of individuals using paid preparers for their 2020 taxes: 90.8%
Here:
91%
State:
92%
(% for various income ranges: 89.0% for AGIs below $25k, 92.7% for AGIs $25k-50k, 91.9% for AGIs $50k-75k, 92.2% for AGIs $75k-100k, 90.8% for AGIs $100k-200k, 91.1% for AGIs over 200k)
Averages for the 2012 tax year for zip code 33015, filed in 2013:
Average Adjusted Gross Income (AGI) in 2012: $36,045 (Individual Income Tax Returns)
Here:
$36,045
State:
$60,316
Salary/wage: $36,659 (reported on 84.3% of returns)
Here:
$36,659
State:
$45,277
(% of AGI for various income ranges: 76.3% for AGIs below $25k, 93.0% for AGIs $25k-50k, 91.9% for AGIs $50k-75k, 88.6% for AGIs $75k-100k, 84.3% for AGIs $100k-200k, 52.0% for AGIs over 200k)
Taxable interest for individuals: $676 (reported on 13.9% of returns)
This zip code:
$676
Florida:
$3,587
(% of AGI for various income ranges: 0.3% for AGIs below $25k, 0.2% for AGIs $25k-50k, 0.2% for AGIs $50k-75k, 0.2% for AGIs $75k-100k, 0.3% for AGIs $100k-200k, 0.7% for AGIs over 200k)
Ordinary dividends: $3,347 (reported on 4.8% of returns)
Here:
$3,347
State:
$12,831
(% of AGI for various income ranges: 0.8% for AGIs below $25k, 0.3% for AGIs $25k-50k, 0.3% for AGIs $50k-75k, 0.3% for AGIs $75k-100k, 0.5% for AGIs $100k-200k, 0.6% for AGIs over 200k)
Net capital gain/loss in AGI: +$3,797 (reported on 3.8% of returns)
Here:
+$3,797
State:
+$33,493
(% of AGI for various income ranges: 0.5% for AGIs $75k-100k, 0.7% for AGIs $100k-200k, 4.6% for AGIs over 200k)
Profit/loss from business: +$5,944 (reported on 27.9% of returns)
Here:
+$5,944
State:
+$10,012
(% of AGI for various income ranges: 17.6% for AGIs below $25k, 2.1% for AGIs $25k-50k, 1.2% for AGIs $50k-75k, 1.6% for AGIs $75k-100k, 1.8% for AGIs $100k-200k, 1.4% for AGIs over 200k)
Taxable individual retirement arrangement distribution: $12,031 (reported on 2.6% of returns)
33015:
$12,031
Florida:
$21,544
(% of AGI for various income ranges: 0.7% for AGIs below $25k, 0.5% for AGIs $25k-50k, 0.7% for AGIs $50k-75k, 1.1% for AGIs $75k-100k, 1.9% for AGIs $100k-200k)
Self-employment retirement plans: $3,475 (reported on 0.3% of returns)
33015:
$3,475
Florida:
$20,611
Total itemized deductions: $18,277 (29% of AGI, reported on 25.2% of returns)
Here:
$18,277
State:
$25,533
Here:
29.0% of AGI
State:
18.0% of AGI
(% of AGI for various income ranges: 6.6% for AGIs below $25k, 14.9% for AGIs $25k-50k, 15.5% for AGIs $50k-75k, 14.6% for AGIs $75k-100k, 13.0% for AGIs $100k-200k, 7.5% for AGIs over 200k)
Charity contributions: $2,680 (reported on 19.5% of returns)
Here:
$2,680
State:
$5,698
(% of AGI for various income ranges: 0.4% for AGIs below $25k, 1.5% for AGIs $25k-50k, 1.8% for AGIs $50k-75k, 1.7% for AGIs $75k-100k, 1.9% for AGIs $100k-200k, 1.5% for AGIs over 200k)
Taxes paid: $3,114 (reported on 24.0% of returns)
33015:
$3,114
State:
$6,203
(% of AGI for various income ranges: 0.9% for AGIs below $25k, 2.1% for AGIs $25k-50k, 2.5% for AGIs $50k-75k, 2.6% for AGIs $75k-100k, 2.5% for AGIs $100k-200k, 1.7% for AGIs over 200k)
Earned income credit: $2,361 (reported on 33.1% of returns)
Here:
$2,361
State:
$2,372
(% of AGI for various income ranges: 10.0% for AGIs below $25k, 1.3% for AGIs $25k-50k)
Percentage of individuals using paid preparers for their 2012 taxes: 70.4%
Here:
70%
State:
54%
(% for various income ranges: 69.9% for AGIs below $25k, 70.3% for AGIs $25k-50k, 71.0% for AGIs $50k-75k, 70.6% for AGIs $75k-100k, 73.5% for AGIs $100k-200k, 81.2% for AGIs over 200k)
Averages for the 2004 tax year for zip code 33015, filed in 2005:
Average Adjusted Gross Income (AGI) in 2004: $34,421 (Individual Income Tax Returns)
Here:
$34,421
State:
$50,523
Salary/wage: $34,121 (reported on 88.2% of returns)
Here:
$34,121
State:
$39,563
(% of AGI for various income ranges: 92.2% for AGIs below $10k, 84.4% for AGIs $10k-25k, 94.3% for AGIs $25k-50k, 91.9% for AGIs $50k-75k, 90.4% for AGIs $75k-100k, 70.0% for AGIs over 100k)
Taxable interest for individuals: $944 (reported on 23.2% of returns)
This zip code:
$944
Florida:
$3,211
(% of AGI for various income ranges: 1.9% for AGIs below $10k, 0.5% for AGIs $10k-25k, 0.3% for AGIs $25k-50k, 0.4% for AGIs $50k-75k, 0.5% for AGIs $75k-100k, 1.5% for AGIs over 100k)
Taxable dividends: $1,732 (reported on 6.9% of returns)
Here:
$1,732
State:
$6,129
(% of AGI for various income ranges: 0.5% for AGIs below $10k, 0.1% for AGIs $10k-25k, 0.2% for AGIs $25k-50k, 0.2% for AGIs $50k-75k, 0.3% for AGIs $75k-100k, 1.0% for AGIs over 100k)
Net capital gain/loss: +$10,627 (reported on 6.3% of returns)
Here:
+$10,627
State:
+$27,205
(% of AGI for various income ranges: 0.3% for AGIs below $10k, 0.1% for AGIs $10k-25k, 0.2% for AGIs $25k-50k, 0.7% for AGIs $50k-75k, 1.2% for AGIs $75k-100k, 8.7% for AGIs over 100k)
Profit/loss from business: +$6,783 (reported on 22.3% of returns)
Here:
+$6,783
State:
+$10,634
(% of AGI for various income ranges: 40.8% for AGIs below $10k, 12.0% for AGIs $10k-25k, 2.3% for AGIs $25k-50k, 1.6% for AGIs $50k-75k, 1.3% for AGIs $75k-100k, 2.2% for AGIs over 100k)
IRA payment deduction: $2,521 (reported on 1.8% of returns)
33015:
$2,521
Florida:
$3,082
(% of AGI for various income ranges: 0.1% for AGIs below $10k, 0.1% for AGIs $10k-25k, 0.2% for AGIs $25k-50k, 0.1% for AGIs $50k-75k, 0.1% for AGIs $75k-100k, 0.1% for AGIs over 100k)
Total itemized deductions: $17,333 (32% of AGI, reported on 36.7% of returns)
Here:
$17,333
State:
$20,370
Here:
31.9% of AGI
State:
20.7% of AGI
(% of AGI for various income ranges: 11.0% for AGIs below $10k, 14.0% for AGIs $10k-25k, 21.5% for AGIs $25k-50k, 23.1% for AGIs $50k-75k, 18.5% for AGIs $75k-100k, 12.3% for AGIs over 100k)
Charity contributions deductions: $2,287 (4% of AGI, reported on 30.8% of returns)
Here:
$2,287
State:
$4,064
Here:
4.0% of AGI
State:
3.8% of AGI
(% of AGI for various income ranges: 0.4% for AGIs below $10k, 0.9% for AGIs $10k-25k, 2.1% for AGIs $25k-50k, 2.5% for AGIs $50k-75k, 2.5% for AGIs $75k-100k, 2.3% for AGIs over 100k)
Total tax: $3,948 (reported on 71.0% of returns)
33015:
$3,948
State:
$9,431
(% of AGI for various income ranges: 7.0% for AGIs below $10k, 3.8% for AGIs $10k-25k, 5.1% for AGIs $25k-50k, 7.6% for AGIs $50k-75k, 9.8% for AGIs $75k-100k, 16.8% for AGIs over 100k)
Earned income credit: $1,860 (reported on 27.4% of returns)
Here:
$1,860
State:
$1,808
Percentage of individuals using paid preparers for their 2004 taxes: 67.3%
Here:
67%
State:
60%
(% for various income ranges: 63.7% for AGIs below $10k, 69.5% for AGIs $10k-25k, 66.7% for AGIs $25k-50k, 68.2% for AGIs $50k-75k, 64.5% for AGIs $75k-100k, 74.3% for AGIs over 100k)
Likely homosexual households (counted as self-reported same-sex unmarried-partner households)
Lesbian couples: 0.1% of all households
Gay men: 0.1% of all households
Household received Food Stamps/SNAP in the past 12 months: 5,204 Household did not receive Food Stamps/SNAP in the past 12 months: 19,114
Women who had a birth in the past 12 months: 636 (303 now married, 318 unmarried) Women who did not have a birth in the past 12 months: 17,548 (6,843 now married, 10,704 unmarried)
Housing units in zip code 33015 with a mortgage: 8,326 (573 second mortgage, 12 home equity loan, 388 both second mortgage and home equity loan) Houses without a mortgage: 50
Median monthly owner costs for units with a mortgage: $1,858 Median monthly owner costs for units without a mortgage: $681
Residents with income below the poverty level in 2022:
This zip code:
12.3%
Whole state:
12.7%
Residents with income below 50% of the poverty level in 2022:
This zip code:
7.0%
Whole state:
6.6%
Median number of rooms in houses and condos:
Here:
5.4
State:
5.9
Median number of rooms in apartments:
Here:
4.0
State:
4.2
Notable locations in this zip code not listed on our city pages
Notable locations in zip code 33015: Palm Springs Landfill (A), Miami Country Club (B), Miami Gardens Shopping Plaza (C), Golden Bear Golf Club at Hammock Creek (D), Sunrise Presbyterian Church Day Care Center (E), Rojas Day Care Center (F), New World Kids Academy (G), Lakes Preschool (H), Kiddie Corner Day Care Center (I), Janero Day Care Center (J), Heartland Health Care Center -Hialeah (K), Country Club Children's Care Center (L), Christian Creative Learning Center (M), Miami - Dade County Fire Rescue Station 44 (N). Display/hide their locations on the map
7,348 married couples with children.
5,603 single-parent households (1,370 men, 4,233 women).
13.1% of residents of 33015 zip code speak English at home.
83.3% of residents speak Spanish at home (50% very well, 21% well, 16% not well, 13% not at all).
1.9% of residents speak other Indo-European language at home (74% very well, 10% well, 13% not well, 3% not at all).
0.7% of residents speak Asian or Pacific Island language at home (39% very well, 39% well, 6% not well, 16% not at all).
1.1% of residents speak other language at home (99% very well, 1% well).
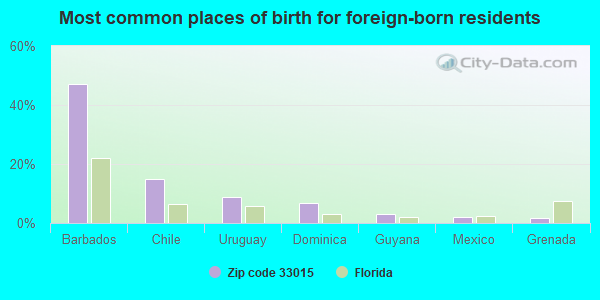
Foreign born population: 42,415 (60.2%) (61.2% of them are naturalized citizens)
This zip code:
60.2%
Whole state:
21.7%
47%Barbados
15%Chile
9%Uruguay
7%Dominica
3%Guyana
2%Mexico
2%Grenada
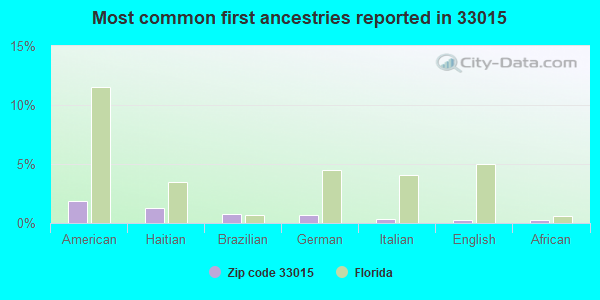
2%American
1%Haitian
1%Brazilian
1%German
0%Italian
0%English
0%African
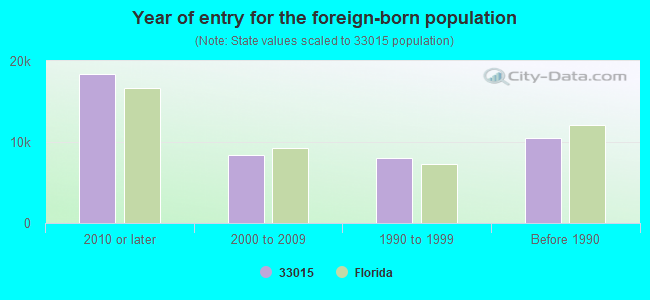
Year of entry for the foreign-born population
18,4242010 or later
8,3602000 to 2009
8,0251990 to 1999
10,521Before 1990
Major facilities with environmental interests located in this zip code:
PALM SPRINGS NORTH ELEMENTARY SCHOOL (17615 N.W. 82ND AVENUE in HIALEAH, FL)
(National Center for Education Statistics) - STATE ID-4281 Small Quantity Generators, between 100 kg and 1000 kg of hazardous waste/month (Resource Conservation and Recovery Act (tracking hazardous waste)) - notification Organizations: DAWN HORNS, PRINCIPAL (CONTACT/OWNER)
, DADE COUNTY SCHOOL DISTRICT (SCHOOL DISTRICT)
Alternative names: DADE CO PALM SPRINGS NORTH ELEM
AMERICAN SENIOR HIGH SCHOOL (18350 NW 67TH AVE in HIALEAH, FL)
(Geographic Names Information System) (National Center for Education Statistics) - STATE ID-7011 Organizations: DADE COUNTY SCHOOL DISTRICT (SCHOOL DISTRICT)
JOELLA GOOD ELEMENTARY SCHOOL (6350 N.W. 188TH TERRACE in MIAMI, FL)
(National Center for Education Statistics) - STATE ID-2181 Organizations: DADE COUNTY SCHOOL DISTRICT (SCHOOL DISTRICT)
LAWTON CHILES MIDDLE SCHOOL (8190 NW 197TH STREET in MIAMI, FL)
(National Center for Education Statistics) - STATE ID-6161 Organizations: DADE COUNTY SCHOOL DISTRICT (SCHOOL DISTRICT)
D'DAGO INC (5830 MIAMI GARDENS DRIVE in MIAMI, FL)
AIR MINOR (AIRS/AFS) Small Quantity Generators, between 100 kg and 1000 kg of hazardous waste/month (Resource Conservation and Recovery Act (tracking hazardous waste)) - notification Business SIC classification: DRYCLEANING PLANTS, EXCEPT RUG CLEANING Organizations: INTERNATIONAL ALBATROS HOLDINGS (CONTACT/OWNER)
Alternative names: INTERNATIONAL ALBATROS INC, INTERNATIONAL ALBATROS INC, UNICORN CLEANERS
LULI POOL SVC & SUPPLIES #3 (7600 NW 186TH ST in MIAMI, FL)
(Integrated Compliance Information System) - ICIS-04-1999-0177, FORMAL ENFORCEMENT ACTION Business SIC classification: PESTICIDES AND AGRICULTURAL CHEMICALS; FARM MACHINERY AND EQUIPMENT
LOWE'S OF NW MIAMI-DADE (17302 NW 57TH AVE. in HIALEAH, FL)
National Pollutant Discharge Elimination System NON-MAJOR (Tracking pollutant discharge elimination systems) - permit Organizations: J PURDUE (CONTACT/OWNER)
NORTH PALMS ESTATES (APPROX. NW 78TH AVE. AND NW 20 in MIAMI, FL)
National Pollutant Discharge Elimination System NON-MAJOR (Tracking pollutant discharge elimination systems) - permit Organizations: KENNETH MACFARLANE (CONTACT/OWNER)
MURPHY USA, HIALEAH, FL #1590 (NW 177TH STREET AND NW 57TH AV in HIALEAH, FL)
National Pollutant Discharge Elimination System NON-MAJOR (Tracking pollutant discharge elimination systems) - permit Organizations: MARRELL JERKINS (CONTACT/OWNER)
SEARS ESSENTIALS #2516/2907 (5750 NW 183RD ST in HIALEAH, FL)
(Resource Conservation and Recovery Act (tracking hazardous waste)) Organizations: SEARS ROEBUCK & CO (CONTACT/OWNER)
SPORT ACRES (S35 T51S R41E in MIAMI GARDENS, FL)
National Pollutant Discharge Elimination System NON-MAJOR (Tracking pollutant discharge elimination systems) - permit Organizations: PAUL ROMANOWSKI (CONTACT/OWNER)
JOE CLEANERS FRANCHISE CORP (16766 NW 67TH AVE in MIAMI, FL)
AIR MINOR (AIRS/AFS) Business SIC classification: DRYCLEANING PLANTS, EXCEPT RUG CLEANING
MAYORLAN INC (7750 NW 178TH STREET in MIAMI, FL)
AIR MINOR (AIRS/AFS) Business SIC classification: DRYCLEANING PLANTS, EXCEPT RUG CLEANING Alternative names: 60 MINUTES
Housing units lacking complete plumbing facilities: 0.3% Housing units lacking complete kitchen facilities: 0.9%
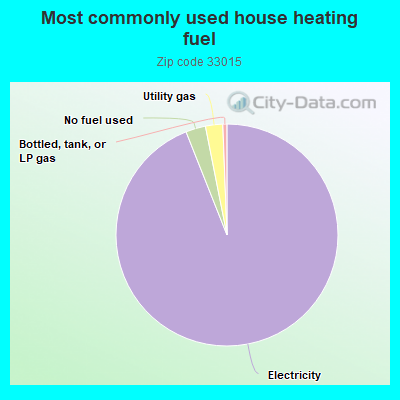
93.8%Electricity
2.9%No fuel used
2.5%Utility gas
0.6%Bottled, tank, or LP gas
Population in 1990: 31,171. Population change in the 1990s: +18,108 (+58.1%).
Place of birth for U.S.-born residents:
This state: 21,771
Northeast: 2,671
Midwest: 344
South: 955
West: 368
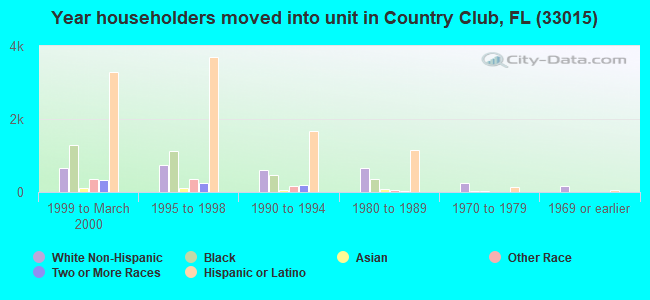
46% of the 33015 zip code residents lived in the same house 5 years ago. Out of people who lived in different houses, 79% lived in this county. Out of people who lived in different counties, 50% lived in Florida.
89% of the 33015 zip code residents lived in the same house 1 year ago. Out of people who lived in different houses, 70% moved from this county. Out of people who lived in different houses, 5% moved from different county within same state. Out of people who lived in different houses, 5% moved from different state. Out of people who lived in different houses, 14% moved from abroad.
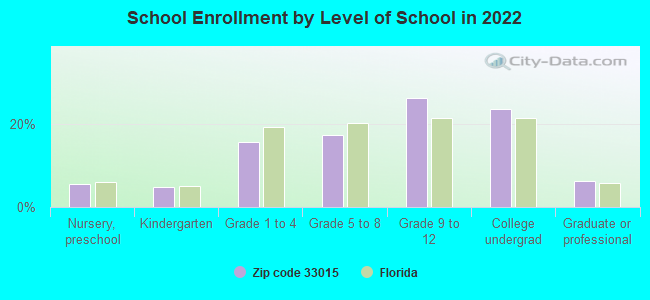
Private vs. public school enrollment:
Students in private schools in grades 1 to 8 (elementary and middle school): 536
Here:
8.8%
Florida:
15.8%
Students in private schools in grades 9 to 12 (high school): 538
Here:
11.1%
Florida:
12.9%
Students in private undergraduate colleges: 1,497
Here:
33.9%
Florida:
23.6%
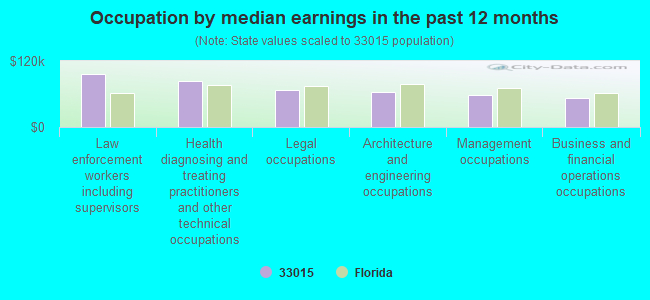
Occupation by median earnings in the past 12 months ($)
96,733Law enforcement workers including supervisors
82,992Health diagnosing and treating practitioners and other technical occupations
67,792Legal occupations
63,837Architecture and engineering occupations
57,491Management occupations
53,376Business and financial operations occupations
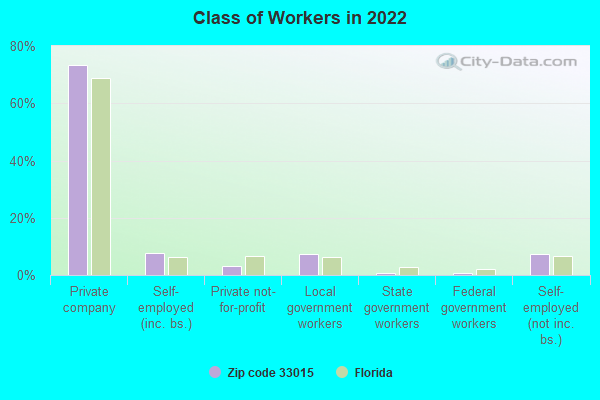
Companies with federal contracts located in this zip code:
JETSET AIRMOTIVE CO, INC (6065 NW 167 ST B-21 in HIALEAH, FL; small business)
$18,000 with Navy for Torque Converters and Speed Changers. Signed on 2005-03-02. Completion date: 2005-03-02.
ABRAHAM, LAWRENCE (6280 NW 186TH ST STE 211 in MIAMI, FL; small business) : $10,700 in 2 contractsfrom 2003 to 2004
$10,000 with Army for Policy Review/Development Services. Taking place in PA. Signed on 2003-09-25. Completion date: 2004-04-30.
$700, same as above.Signed on 2004-05-19. Completion date: 2004-04-30.
OPTIMUS AEROSPACE INC (19342 NW 67TH PL in HIALEAH, FL; small business)
$5,400 with Air Force for Airframe Structural Components. Signed on 2006-07-12. Completion date: 2006-07-14.
MCGAW, VIRGINIA (19400 NW 62ND PLACE in HIALEAH, FL; small business)
$4,191 with Army for Teletype and Facsimile Equipment. Signed on 2003-12-29. Completion date: 2004-03-03.
Top industries in this zip code by the number of employees in 2005:
2008 - 2018 National Fire Incident Reporting System (NFIRS) incidents
According to the data from the years 2008 - 2018 the average number of fire incidents per year is 78. The highest number of reported fires - 115 took place in 2008, and the least - 37 in 2015. The data has a dropping trend.
When looking into fire subcategories, the most reports belonged to: Structure Fires (45.1%), and Outside Fires (31.5%).
Fire incident types reported to NFIRS in Zip Code 33015


 Nearest zip codes: 33055, 33014, 33016, 33027, 33025, 33054.


 According to the data from the years 2008 - 2018 the average number of fire incidents per year is 78. The highest number of reported fires - 115 took place in 2008, and the least - 37 in 2015. The data has a dropping trend.
 When looking into fire subcategories, the most reports belonged to: Structure Fires (45.1%), and Outside Fires (31.5%).