Estimated zip code population in 2022: 74,734 Zip code population in 2010: 59,039 Zip code population in 2000: 46,392
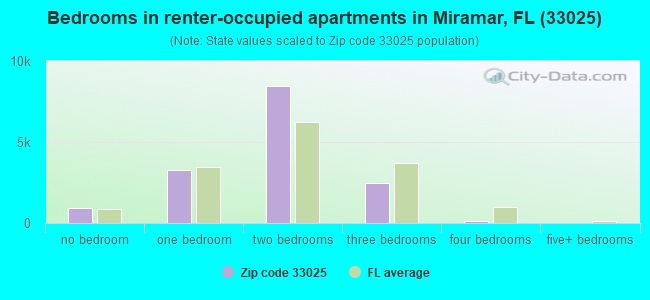
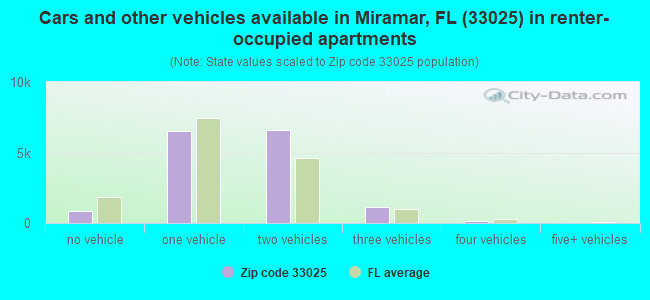
Houses and condos: 30,679 Renter-occupied apartments: 15,298
% of renters here:
53%
State:
33%
March 2022 cost of living index in zip code 33025: 109.4 (more than average, U.S. average is 100)
Land area: 10.8 sq. mi. Water area: 0.3 sq. mi.
Population density: 6,925 people per square mile
(high).
OSM Map
General Map
Google Map
MSN Map
OSM Map
General Map
Google Map
MSN Map
OSM Map
General Map
Google Map
MSN Map
OSM Map
General Map
Google Map
MSN Map
Please wait while loading the map...
Real estate property taxes paid for housing units in 2022:
This zip code:
0.8% ($3,046)
Florida:
0.7% ($2,529)
Median real estate property taxes paid for housing units with mortgages in 2022: $3,616 (0.9%) Median real estate property taxes paid for housing units with no mortgage in 2022: $2,800 (0.9%)
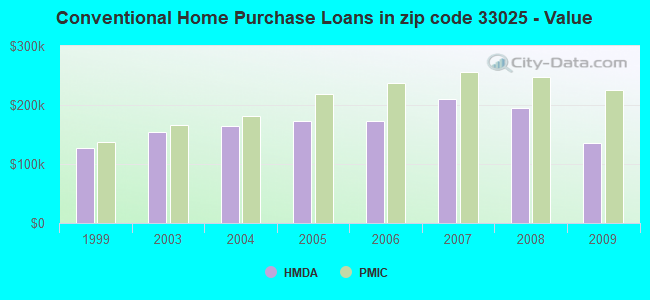
Estimated median house/condo value in 2022: $377,246
33025:
$377,246
Florida:
$354,100
According to our research of Florida and other state lists, there were 22 registered sex offenders living in 33025 zip code as of April 27, 2024. The ratio of all residents to sex offenders in zip code 33025 is 3,000 to 1. The ratio of registered sex offenders to all residents in this zip code is much lower than the state average.
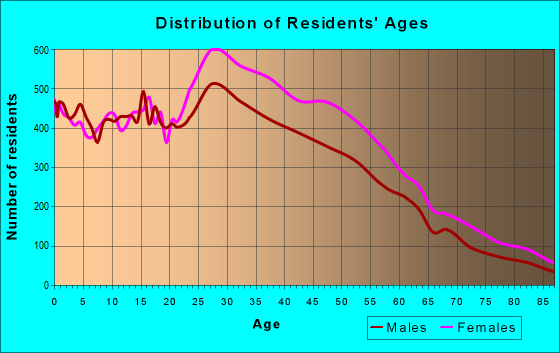
Median resident age:
This zip code:
37.1 years
Florida median age:
42.7 years
Average household size:
This zip code:
2.6 people
Florida:
2.5 people
Averages for the 2020 tax year for zip code 33025, filed in 2021:
Average Adjusted Gross Income (AGI) in 2020: $47,896 (Individual Income Tax Returns)
Here:
$47,896
State:
$82,200
Salary/wage: $47,734 (reported on 84.3% of returns)
Here:
$47,734
State:
$58,347
(% of AGI for various income ranges: 1295.8% for AGIs below $25k, 3917.3% for AGIs $25k-50k, 7107.1% for AGIs $50k-75k, 10350.0% for AGIs $75k-100k, 17807.2% for AGIs $100k-200k, 56076.5% for AGIs over 200k)
Taxable interest for individuals: $753 (reported on 12.4% of returns)
This zip code:
$753
Florida:
$4,272
(% of AGI for various income ranges: 3.8% for AGIs below $25k, 5.7% for AGIs $25k-50k, 12.1% for AGIs $50k-75k, 19.7% for AGIs $75k-100k, 37.2% for AGIs $100k-200k, 472.4% for AGIs over 200k)
Ordinary dividends: $2,254 (reported on 7.4% of returns)
Here:
$2,254
State:
$15,863
(% of AGI for various income ranges: 5.7% for AGIs below $25k, 7.9% for AGIs $25k-50k, 20.5% for AGIs $50k-75k, 34.4% for AGIs $75k-100k, 64.9% for AGIs $100k-200k, 1140.0% for AGIs over 200k)
Net capital gain/loss in AGI: +$7,431 (reported on 8.8% of returns)
Here:
+$7,431
State:
+$62,983
(% of AGI for various income ranges: 2.5% for AGIs below $25k, 5.6% for AGIs $25k-50k, 24.7% for AGIs $50k-75k, 74.6% for AGIs $75k-100k, 276.2% for AGIs $100k-200k, 9038.2% for AGIs over 200k)
Profit/loss from business: +$1,415 (reported on 33.4% of returns)
Here:
+$1,415
State:
+$9,719
(% of AGI for various income ranges: 143.0% for AGIs below $25k, 34.7% for AGIs $50k-75k, 25.3% for AGIs $75k-100k, 87.8% for AGIs $100k-200k, 1431.2% for AGIs over 200k)
Taxable individual retirement arrangement distribution: $15,087 (reported on 2.9% of returns)
33025:
$15,087
Florida:
$24,823
(% of AGI for various income ranges: 13.8% for AGIs below $25k, 24.0% for AGIs $25k-50k, 55.1% for AGIs $50k-75k, 101.3% for AGIs $75k-100k, 223.7% for AGIs $100k-200k, 2031.2% for AGIs over 200k)
Total itemized deductions: $28,025 (reported on 8.6% of returns)
Here:
$28,025
State:
$45,393
(% of AGI for various income ranges: 34.0% for AGIs below $25k, 157.5% for AGIs $25k-50k, 481.8% for AGIs $50k-75k, 820.1% for AGIs $75k-100k, 1256.1% for AGIs $100k-200k, 4012.9% for AGIs over 200k)
Charity contributions: $8,066 (reported on 7.1% of returns)
Here:
$8,066
State:
$20,178
(% of AGI for various income ranges: 3.5% for AGIs below $25k, 31.0% for AGIs $25k-50k, 106.5% for AGIs $50k-75k, 186.8% for AGIs $75k-100k, 345.0% for AGIs $100k-200k, 1387.1% for AGIs over 200k)
Taxes paid: $6,857 (reported on 8.3% of returns)
33025:
$6,857
State:
$6,967
(% of AGI for various income ranges: 7.2% for AGIs below $25k, 35.7% for AGIs $25k-50k, 119.4% for AGIs $50k-75k, 202.2% for AGIs $75k-100k, 288.2% for AGIs $100k-200k, 857.1% for AGIs over 200k)
Earned income credit: $2,314 (reported on 26.3% of returns)
Here:
$2,314
State:
$2,306
(% of AGI for various income ranges: 138.2% for AGIs below $25k, 79.1% for AGIs $25k-50k, 0.8% for AGIs $50k-75k)
Percentage of individuals using paid preparers for their 2020 taxes: 92.5%
Here:
92%
State:
92%
(% for various income ranges: 91.7% for AGIs below $25k, 93.8% for AGIs $25k-50k, 93.0% for AGIs $50k-75k, 92.5% for AGIs $75k-100k, 91.2% for AGIs $100k-200k, 89.1% for AGIs over 200k)
Averages for the 2012 tax year for zip code 33025, filed in 2013:
Average Adjusted Gross Income (AGI) in 2012: $38,144 (Individual Income Tax Returns)
Here:
$38,144
State:
$60,316
Salary/wage: $38,893 (reported on 86.7% of returns)
Here:
$38,893
State:
$45,277
(% of AGI for various income ranges: 81.8% for AGIs below $25k, 93.2% for AGIs $25k-50k, 91.4% for AGIs $50k-75k, 90.2% for AGIs $75k-100k, 87.5% for AGIs $100k-200k, 60.3% for AGIs over 200k)
Taxable interest for individuals: $950 (reported on 14.9% of returns)
This zip code:
$950
Florida:
$3,587
(% of AGI for various income ranges: 0.4% for AGIs below $25k, 0.4% for AGIs $25k-50k, 0.3% for AGIs $50k-75k, 0.3% for AGIs $75k-100k, 0.3% for AGIs $100k-200k, 0.7% for AGIs over 200k)
Ordinary dividends: $5,231 (reported on 6.9% of returns)
Here:
$5,231
State:
$12,831
(% of AGI for various income ranges: 1.8% for AGIs below $25k, 1.1% for AGIs $25k-50k, 0.6% for AGIs $50k-75k, 0.5% for AGIs $75k-100k, 0.5% for AGIs $100k-200k, 2.2% for AGIs over 200k)
Net capital gain/loss in AGI: +$1,350 (reported on 4.6% of returns)
Here:
+$1,350
State:
+$33,493
(% of AGI for various income ranges: 0.1% for AGIs $75k-100k, 0.3% for AGIs $100k-200k, 2.6% for AGIs over 200k)
Profit/loss from business: +$3,323 (reported on 22.5% of returns)
Here:
+$3,323
State:
+$10,012
(% of AGI for various income ranges: 10.7% for AGIs below $25k, 0.1% for AGIs $25k-50k, 0.3% for AGIs $50k-75k, 0.4% for AGIs $75k-100k, 0.3% for AGIs $100k-200k, 2.3% for AGIs over 200k)
Taxable individual retirement arrangement distribution: $12,792 (reported on 3.1% of returns)
33025:
$12,792
Florida:
$21,544
(% of AGI for various income ranges: 0.8% for AGIs below $25k, 0.7% for AGIs $25k-50k, 0.9% for AGIs $50k-75k, 1.0% for AGIs $75k-100k, 2.2% for AGIs $100k-200k)
Self-employment retirement plans: $9,867 (reported on 0.1% of returns)
33025:
$9,867
Florida:
$20,611
Total itemized deductions: $18,756 (29% of AGI, reported on 27.3% of returns)
Here:
$18,756
State:
$25,533
Here:
29.3% of AGI
State:
18.0% of AGI
(% of AGI for various income ranges: 7.6% for AGIs below $25k, 14.2% for AGIs $25k-50k, 15.9% for AGIs $50k-75k, 14.8% for AGIs $75k-100k, 13.7% for AGIs $100k-200k, 11.3% for AGIs over 200k)
Charity contributions: $3,696 (reported on 22.9% of returns)
Here:
$3,696
State:
$5,698
(% of AGI for various income ranges: 0.7% for AGIs below $25k, 2.1% for AGIs $25k-50k, 2.7% for AGIs $50k-75k, 2.8% for AGIs $75k-100k, 2.9% for AGIs $100k-200k, 1.9% for AGIs over 200k)
Taxes paid: $3,032 (reported on 26.2% of returns)
33025:
$3,032
State:
$6,203
(% of AGI for various income ranges: 0.9% for AGIs below $25k, 2.0% for AGIs $25k-50k, 2.4% for AGIs $50k-75k, 2.5% for AGIs $75k-100k, 2.5% for AGIs $100k-200k, 2.4% for AGIs over 200k)
Earned income credit: $2,402 (reported on 30.0% of returns)
Here:
$2,402
State:
$2,372
(% of AGI for various income ranges: 9.9% for AGIs below $25k, 1.3% for AGIs $25k-50k)
Percentage of individuals using paid preparers for their 2012 taxes: 67.5%
Here:
67%
State:
54%
(% for various income ranges: 67.6% for AGIs below $25k, 67.9% for AGIs $25k-50k, 67.0% for AGIs $50k-75k, 65.7% for AGIs $75k-100k, 66.5% for AGIs $100k-200k, 71.4% for AGIs over 200k)
Averages for the 2004 tax year for zip code 33025, filed in 2005:
Average Adjusted Gross Income (AGI) in 2004: $35,625 (Individual Income Tax Returns)
Here:
$35,625
State:
$50,523
Salary/wage: $35,652 (reported on 88.9% of returns)
Here:
$35,652
State:
$39,563
(% of AGI for various income ranges: 85.5% for AGIs below $10k, 85.6% for AGIs $10k-25k, 93.1% for AGIs $25k-50k, 92.1% for AGIs $50k-75k, 90.3% for AGIs $75k-100k, 79.1% for AGIs over 100k)
Taxable interest for individuals: $1,190 (reported on 24.8% of returns)
This zip code:
$1,190
Florida:
$3,211
(% of AGI for various income ranges: 2.6% for AGIs below $10k, 1.0% for AGIs $10k-25k, 0.6% for AGIs $25k-50k, 0.6% for AGIs $50k-75k, 0.8% for AGIs $75k-100k, 1.2% for AGIs over 100k)
Taxable dividends: $2,256 (reported on 9.8% of returns)
Here:
$2,256
State:
$6,129
(% of AGI for various income ranges: 1.8% for AGIs below $10k, 0.7% for AGIs $10k-25k, 0.5% for AGIs $25k-50k, 0.5% for AGIs $50k-75k, 0.4% for AGIs $75k-100k, 0.9% for AGIs over 100k)
Net capital gain/loss: +$4,919 (reported on 8.8% of returns)
Here:
+$4,919
State:
+$27,205
(% of AGI for various income ranges: -1.8% for AGIs below $10k, 0.0% for AGIs $10k-25k, 0.2% for AGIs $25k-50k, 0.5% for AGIs $50k-75k, 0.8% for AGIs $75k-100k, 6.0% for AGIs over 100k)
Profit/loss from business: +$5,775 (reported on 16.8% of returns)
Here:
+$5,775
State:
+$10,634
(% of AGI for various income ranges: 23.7% for AGIs below $10k, 8.1% for AGIs $10k-25k, 1.5% for AGIs $25k-50k, 0.9% for AGIs $50k-75k, 0.7% for AGIs $75k-100k, 1.7% for AGIs over 100k)
IRA payment deduction: $2,432 (reported on 1.7% of returns)
33025:
$2,432
Florida:
$3,082
(% of AGI for various income ranges: 0.2% for AGIs below $10k, 0.1% for AGIs $10k-25k, 0.1% for AGIs $25k-50k, 0.1% for AGIs $50k-75k, 0.1% for AGIs $75k-100k, 0.1% for AGIs over 100k)
Self-employed pension: $8,739 (reported on 0.1% of returns)
Here:
$8,739
Florida:
$15,857
Total itemized deductions: $18,137 (32% of AGI, reported on 35.9% of returns)
Here:
$18,137
State:
$20,370
Here:
32.5% of AGI
State:
20.7% of AGI
(% of AGI for various income ranges: 9.8% for AGIs below $10k, 18.5% for AGIs $10k-25k, 18.8% for AGIs $25k-50k, 19.9% for AGIs $50k-75k, 19.0% for AGIs $75k-100k, 15.4% for AGIs over 100k)
Charity contributions deductions: $3,078 (5% of AGI, reported on 31.3% of returns)
Here:
$3,078
State:
$4,064
Here:
5.3% of AGI
State:
3.8% of AGI
(% of AGI for various income ranges: 0.7% for AGIs below $10k, 1.2% for AGIs $10k-25k, 2.6% for AGIs $25k-50k, 3.2% for AGIs $50k-75k, 3.2% for AGIs $75k-100k, 3.2% for AGIs over 100k)
Total tax: $4,101 (reported on 70.0% of returns)
33025:
$4,101
State:
$9,431
(% of AGI for various income ranges: 4.8% for AGIs below $10k, 3.4% for AGIs $10k-25k, 5.5% for AGIs $25k-50k, 8.4% for AGIs $50k-75k, 10.1% for AGIs $75k-100k, 15.0% for AGIs over 100k)
Earned income credit: $1,878 (reported on 24.7% of returns)
Here:
$1,878
State:
$1,808
Percentage of individuals using paid preparers for their 2004 taxes: 64.8%
Here:
65%
State:
60%
(% for various income ranges: 60.9% for AGIs below $10k, 68.0% for AGIs $10k-25k, 64.2% for AGIs $25k-50k, 64.4% for AGIs $50k-75k, 63.5% for AGIs $75k-100k, 67.3% for AGIs over 100k)
Likely homosexual households (counted as self-reported same-sex unmarried-partner households)
Lesbian couples: 0.1% of all households
Gay men: 0.2% of all households
Household received Food Stamps/SNAP in the past 12 months: 4,262 Household did not receive Food Stamps/SNAP in the past 12 months: 24,718
Women who had a birth in the past 12 months: 743 (580 now married, 175 unmarried) Women who did not have a birth in the past 12 months: 18,998 (7,340 now married, 11,656 unmarried)
Housing units in zip code 33025 with a mortgage: 6,299 (451 second mortgage, 9 home equity loan, 324 both second mortgage and home equity loan) Houses without a mortgage: 96
Median monthly owner costs for units with a mortgage: $1,956 Median monthly owner costs for units without a mortgage: $567
Residents with income below the poverty level in 2022:
This zip code:
10.2%
Whole state:
12.7%
Residents with income below 50% of the poverty level in 2022:
This zip code:
3.6%
Whole state:
6.6%
Median number of rooms in houses and condos:
Here:
5.2
State:
5.9
Median number of rooms in apartments:
Here:
4.2
State:
4.2
Notable locations in this zip code not listed on our city pages
Notable locations in zip code 33025: Raintree Golf Club (A), Miramar Parkway Plaza (B), Hollybrook Golf and Tennis Club (C), Miramar Country Club (D), Saint Lucie West Country Club (E), Saint Johns County Golf Course (F), Meadow Woods Golf Club (G), Parkway Plaza (H), Jubilee Gala Reception Hall (I), Pembroke Pines Police Station (J), Pine Lakes City Hall (K), Miramar Park Chamber of Commerce (L), Memorial Manor (M), Fire Station Number 69 (N), Elaine Gordon Treatment Center (O), Alexander Nininger State Veterans Nursing Home (P), Pembroke Pines Fire and Rescue Station 69 (Q), Miramar Fire Rescue Station 70 (R), Miramar Police Department (S), Pines Youth Center (T). Display/hide their locations on the map
Shopping Centers: River Run Shopping Center (1), Palmetto by Pass Shopping Center (2), Marketplace Mall Shopping Center (3), University Market Place Shopping Center (4), University Mall (5). Display/hide their locations on the map
7,197 married couples with children.
4,721 single-parent households (836 men, 3,885 women).
54.2% of residents of 33025 zip code speak English at home.
33.4% of residents speak Spanish at home (64% very well, 18% well, 12% not well, 7% not at all).
8.3% of residents speak other Indo-European language at home (65% very well, 20% well, 11% not well, 4% not at all).
1.6% of residents speak Asian or Pacific Island language at home (73% very well, 24% well, 3% not well).
1.9% of residents speak other language at home (69% very well, 24% well, 8% not well).
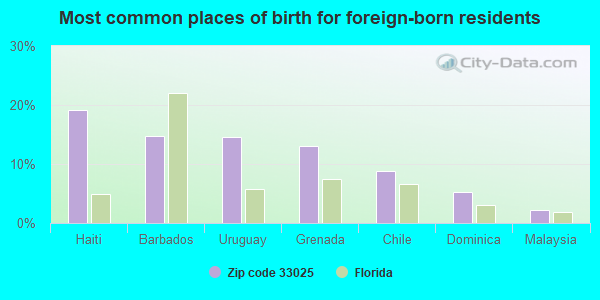
Foreign born population: 28,285 (37.8%) (60.3% of them are naturalized citizens)
This zip code:
37.8%
Whole state:
21.7%
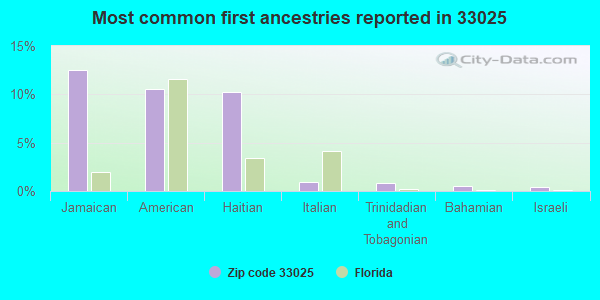
19%Haiti
15%Barbados
15%Uruguay
13%Grenada
9%Chile
5%Dominica
2%Malaysia
12%Jamaican
11%American
10%Haitian
1%Italian
1%Trinidadian and Tobagonian
1%Bahamian
0%Israeli
Year of entry for the foreign-born population
10,9262010 or later
5,2252000 to 2009
5,1771990 to 1999
8,946Before 1990
Major facilities with environmental interests located in this zip code:
PAS TECHNOLOGIES INC (10301 NORTH COMMERCE PARKWAY in MIRAMAR, FL)
AIR MINOR (AIRS/AFS) STATE MASTER (FDM) - CHAZ-FLR000064295, HAZARDOUS WASTE REGULATION PROGRAM Small Quantity Generators, between 100 kg and 1000 kg of hazardous waste/month (Resource Conservation and Recovery Act (tracking hazardous waste)) - notification TRI REPORTER (Tracking of toxic chemicals releasing facilities) Business SIC classification: ELECTROPLATING, PLATING, POLISHING, ANODIZING, AND COLORING; INDUSTRIAL AND COMMERCIAL MACHINERY AND EQUIPMENT Organizations: PRAXAIR SURFACE TECHNOLOGIES, PRAZAIR SURFACE TECHNOLOGIES (CONTACT/OWNER)
Alternative names: PRAXAIR SURFACE TECHNOLOGIES, PRAXAIR SURFACE TECHNOLOGIES INC
QUALEX INC (12006 MIRAMAR PARKWAY in MIRAMAR, FL)
STATE MASTER (FDM) - CHAZ-FLR000128603, HAZARDOUS WASTE REGULATION PROGRAM, WAFR-FLRNEE023, NPDES STORMWATER PROGRAM, NPDES STORMWATER PERMIT National Pollutant Discharge Elimination System NON-MAJOR (Tracking pollutant discharge elimination systems) - permit Business SIC classification: PHOTOGRAPHIC EQUIPMENT AND SUPPLIES; PHOTOFINISHING LABORATORIES Organizations: JUAN ABELLO (CONTACT/OWNER)
, FLAMINGO PARK OF COMMERCE (CONTACT/OWNER)
Alternative names: QUALEX OSP
QUEST DIAGNOSTICS INC (10200 COMMERCE PKWY in MIRAMAR, FL)
STATE MASTER (FDM) - CHAZ-FLD984249623, HAZARDOUS WASTE REGULATION PROGRAM HAZARDOUS WASTE BIENNIAL REPORTER (Resource Conservation and Recovery Act (tracking hazardous waste)) Large Quantity Generators, more that 1000 kg of hazardous waste/month (Resource Conservation and Recovery Act (tracking hazardous waste)) Business SIC and NAICS classification: MEDICAL LABORATORIES Organizations: D LYNN REDLIN (CONTACT/OWNER)
Alternative names: QUEST DIAGNOSTICS INC, MIRAMAR, SMITHKLINE BEECHAM CLINICAL LABS
ADVANCED AUTOMOTIVE, INC. (1810 S.W. 100TH TERRACE in MIRAMAR, FL)
AIR MINOR (AIRS/AFS) (Integrated Compliance Information System) - ICIS-04-2002-1509, FORMAL ENFORCEMENT ACTION Business SIC classification: GENERAL AUTOMOTIVE REPAIR SHOPS; NONCLASSIFIABLE ESTABLISHMENTS
NEW RENAISSANCE MIDDLE SCHOOL (10701 MIRAMAR BOULEVARD in MIRAMAR, FL)
(National Center for Education Statistics) - STATE ID-3911 Organizations: BROWARD COUNTY SCHOOL DISTRICT (SCHOOL DISTRICT)
PALM COVE ELEMENTARY SCHOOL (11601 WASHINGTON ST in PEMBROKE PINES, FL)
(National Center for Education Statistics) - STATE ID-3311 Organizations: BROWARD COUNTY SCHOOL DISTRICT (SCHOOL DISTRICT)
CITY OF PEMBROKE PINES CHARTER ELEMENTARY SCHOOL (10801 PEMBROKE ROAD in PEMBROKE PINES, FL)
(National Center for Education Statistics) - STATE ID-5051 Organizations: BROWARD COUNTY SCHOOL DISTRICT (SCHOOL DISTRICT)
SEA CASTLE ELEMENTARY SCHOOL (9600 MIRAMAR BLVD in MIRAMAR, FL)
(National Center for Education Statistics) - STATE ID-2871 Organizations: BROWARD COUNTY SCHOOL DISTRICT (SCHOOL DISTRICT)
SOUTH FLORIDA INTENSIVE HALFWAY HOUSE - PSYCHOTHER (8211 SOUTH PALM DRIVE in PEMBROKE PINES, FL)
(National Center for Education Statistics) - STATE ID-6141 Organizations: BROWARD COUNTY SCHOOL DISTRICT (SCHOOL DISTRICT)
SOUTH PINES ACADEMY (8200 SOUTH PALM DRIVE in PEMBROKE PINES, FL)
(National Center for Education Statistics) - STATE ID-6013 Organizations: BROWARD COUNTY SCHOOL DISTRICT (SCHOOL DISTRICT)
SHELL - STATION #136689 (9999 MIRAMAR PKWY in MIRAMAR, FL)
National Pollutant Discharge Elimination System NON-MAJOR (Tracking pollutant discharge elimination systems) - permit Small Quantity Generators, between 100 kg and 1000 kg of hazardous waste/month (Resource Conservation and Recovery Act (tracking hazardous waste)) - notification Organizations: MOTIVA ENTERPRISES LLC (CONTACT/OWNER)
, ANNETTE DOKKEN (CONTACT/OWNER)
Alternative names: SHELL OIL CO
MURANO (WEST OF UNIVERSITY DRIVE, SOUT in MIRAMAR, FL)
National Pollutant Discharge Elimination System NON-MAJOR (Tracking pollutant discharge elimination systems) - permit Organizations: ROBERT STIEGELE (CONTACT/OWNER)
MIRAMAR BLVD. AND UNIVERSITY D (INTERSECTION OF UNIVERSITY DRI in MIRAMAR, FL)
National Pollutant Discharge Elimination System NON-MAJOR (Tracking pollutant discharge elimination systems) - permit Organizations: RANDY RIEGER (CONTACT/OWNER)
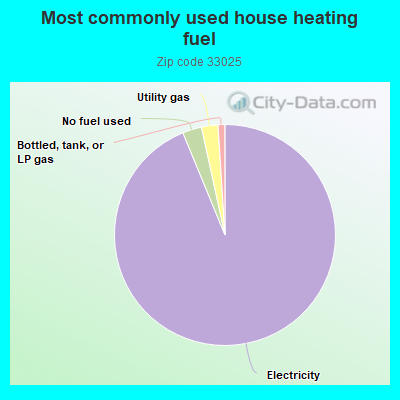
Housing units lacking complete plumbing facilities: 0.6% Housing units lacking complete kitchen facilities: 1.1%
93.5%Electricity
2.8%No fuel used
2.4%Utility gas
1.0%Bottled, tank, or LP gas
Population in 1990: 24,778. Population change in the 1990s: +21,614 (+87.2%).
Place of birth for U.S.-born residents:
This state: 34,455
Northeast: 5,800
Midwest: 1,309
South: 2,404
West: 439
40% of the 33025 zip code residents lived in the same house 5 years ago. Out of people who lived in different houses, 35% lived in this county. Out of people who lived in different counties, 50% lived in Florida.
89% of the 33025 zip code residents lived in the same house 1 year ago. Out of people who lived in different houses, 45% moved from this county. Out of people who lived in different houses, 35% moved from different county within same state. Out of people who lived in different houses, 9% moved from different state. Out of people who lived in different houses, 10% moved from abroad.
Private vs. public school enrollment:
Students in private schools in grades 1 to 8 (elementary and middle school): 397
Here:
6.6%
Florida:
15.8%
Students in private schools in grades 9 to 12 (high school): 148
Here:
5.8%
Florida:
12.9%
Students in private undergraduate colleges: 628
Here:
14.7%
Florida:
23.6%
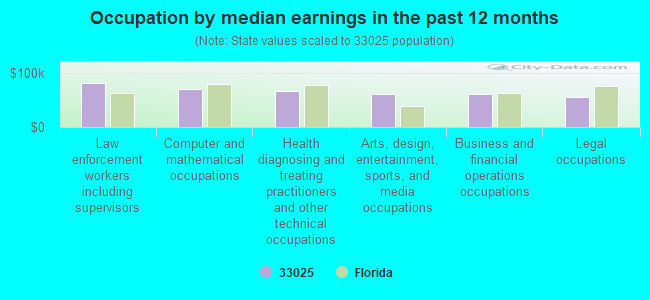
Occupation by median earnings in the past 12 months ($)
81,145Law enforcement workers including supervisors
70,258Computer and mathematical occupations
66,091Health diagnosing and treating practitioners and other technical occupations
61,363Arts, design, entertainment, sports, and media occupations
60,548Business and financial operations occupations
56,002Legal occupations
Companies with federal contracts located in this zip code:
ROLLS ROYCE COMMERICAL MARINE (11550 INTERCHANGE CIRCLE N in MIRAMAR, FL) : $4,604,390 in 73 contractsfrom 2001 to 2006
Contracts for Cable, Cord, and Wire Assemblies: Communications Equipment, Ship and Boat Propulsion Components, Bearings, Plain, Unmounted, Marine Hardware and Hull Items, and moreby Navy, Defense Logistics Agency, U.S. Coast Guard Signed by year:2000: $0; 2001: $67,343; 2002: $707,885; 2003: $662,952; 2004: $1,179,220; 2005: $1,278,982; 2006: $708,008.
Biggest contracts:
$372,564 with Navy for Cable, Cord, and Wire Assemblies: Communications Equipment. Taking place in KS. Signed on 2005-08-01. Completion date: 2005-12-01.
$300,619, same as above.Signed on 2004-07-27. Completion date: 2004-09-27.
$298,465 with Navy for Ship and Boat Propulsion Components. Taking place in KS. Signed on 2005-04-04. Completion date: 2006-04-04.
$240,496, same as above.Signed on 2004-02-25. Completion date: 2004-05-06.
SPIRIT AIRLINES INC (2800 EXECUTIVE WAY in MIRAMAR, FL) : $2,798,948 in 17 contractsfrom 2000 to 2005
Contracts for Air Charter for Things, Passenger Air Charter Service by Air Force Signed by year:2000: $310,532; 2001: -$259,202; 2002: $1,126,654; 2003: $1,022,291; 2004: $691,138; 2005: -$92,465; 2006: $0.
Biggest contracts:
$1,177,984 with Air Force for Air Charter for Things. Signed on 2002-10-01. Completion date: 2003-09-30.
$1,022,291 with Air Force for Passenger Air Charter Service. Signed on 2003-10-01. Completion date: 2004-09-30.
$864,151, same as above.Signed on 2004-10-01. Completion date: 2005-09-30.
$310,532 with Air Force for Passenger Air Charter Service. Taking place in MI. Signed on 2000-10-01. Completion date: 2001-09-30.
JAC FLORIDA,LLC (3002 NORTH COMMERCE PARKWA in MIRAMAR, FL; small business) : $518,173 in 21 contractsfrom 2000 to 2006
Contracts for Aircraft Hydraulic, Vacuum, and De-icing System Components, Packing and Gasket Materials, Bearings, Antifriction, Unmounted, Power and Hand Pumps, and moreby Defense Logistics Agency Signed by year:2000: $67,969; 2001: $0; 2002: $0; 2003: $0; 2004: $0; 2005: $313,261; 2006: $136,943.
Biggest contracts:
$125,901 with Defense Logistics Agency for Aircraft Hydraulic, Vacuum, and De-icing System Components. Signed on 2005-07-05. Completion date: 2005-11-12.
$83,140 with Defense Logistics Agency for Packing and Gasket Materials. Signed on 2005-07-26. Completion date: 2006-01-17.
$77,346 with Defense Logistics Agency for Aircraft Hydraulic, Vacuum, and De-icing System Components. Signed on 2005-05-20. Completion date: 2005-11-26.
$67,969 with Defense Logistics Agency for Bearings, Antifriction, Unmounted. Signed on 2000-09-12. Completion date: 2000-12-11.
BECKER AVIONICS INC (10376 USA TODAY WAY in MIRAMAR, FL)
$397,120 with Navy for Miscellaneous Communication Equipment. Signed on 2004-02-05. Completion date: 2004-09-30.
PRAXAIR SURFACE TECHNOLOGIES (10301 N COMMERCE PARKWAY in MIRAMAR, FL) : $356,900 in 4 contractsfrom 2001 to 2002
$137,200 with Navy for Miscellaneous Engine Accessories, Aircraft. Signed on 2002-12-10. Completion date: 2003-09-15.
$137,200, same as above.Signed on 2002-09-16. Completion date: 2003-09-15.
$41,250 with Navy for Bearings, Plain, Unmounted. Signed on 2002-10-30. Completion date: 2003-01-03.
$41,250 with Navy for Miscellaneous Engine Accessories, Aircraft. Signed on 2001-10-10. Completion date: 2001-12-31.
HONEYWELL INTERNATIONAL INC (3261 EXECUTIVE WAY in MIRAMAR, FL) : $95,210 in 9 contractsfrom 2001 to 2005
Contracts for Maintenance, Repair or Alteration of Real Property -- Heating and Cooling Plants, Other Utilities, Gas Services, Maintenance, Repair and Rebuilding of Equipment -- Refrigeration, Air Conditioning, and Air Circulating Equipment, and moreby Navy, Army Signed by year:2000: $0; 2001: $13,500; 2002: $0; 2003: $0; 2004: $57,542; 2005: $24,168; 2006: $0.
Biggest contracts:
$39,974 with Navy for Maintenance, Repair or Alteration of Real Property -- Heating and Cooling Plants. Signed on 2004-03-02. Completion date: 2004-05-02.
$16,033 with Navy for Other Utilities. Signed on 2005-08-11. Completion date: 2005-08-15.
$13,500 with Navy for Gas Services. Signed on 2004-08-02. Completion date: 2003-08-14.
$13,500 with Navy for Maintenance, Repair and Rebuilding of Equipment -- Refrigeration, Air Conditioning, and Air Circulating Equipment. Signed on 2001-10-01. Completion date: 2003-08-14.
PROFESSIONAL RESOURCES IN MANA (1820 SW 100TH AVE in HOLLYWOOD, FL; small business)
$35,300 with Navy for Other Education and Training Services. Signed on 2004-04-06. Completion date: 2004-09-30.
F G WILSON INCORPORATED (10431 N COMMERCE PKWY in HOLLYWOOD, FL; small business) : $1,990 in 2 contractsin 2003
$1,990 with Army for Generators and Generators Sets, Electrical. Signed on 2003-06-20. Completion date: 2003-07-10.
$0, same as above.Signed on 2003-06-20. Completion date: 2003-07-10.
Top industries in this zip code by the number of employees in 2005:
Health Care and Social Assistance: Home Health Care Services (500-999 employees: 1 establishment, 100-249 employees: 1 establishment, 20-49 employees: 1 establishment, 5-9 employees: 1 establishment, 1-4 employees: 1 establishment)
Administrative and Support and Waste Management and Remediation Services: Travel Agencies (250-499: 2, 100-249: 1, 1-4: 2)
Administrative and Support and Waste Management and Remediation Services: Telemarketing Bureaus (500-999: 1, 20-49: 1, 5-9: 1)
2002 - 2018 National Fire Incident Reporting System (NFIRS) incidents
According to the data from the years 2002 - 2018 the average number of fire incidents per year is 87. The highest number of reported fires - 118 took place in 2008, and the least - 32 in 2002. The data has a growing trend.
When looking into fire subcategories, the most reports belonged to: Structure Fires (37.8%), and Outside Fires (29.2%).
Fire incident types reported to NFIRS in Zip Code 33025


 Nearest zip codes: 33055, 33026, 33024, 33056, 33027, 33015.


 According to the data from the years 2002 - 2018 the average number of fire incidents per year is 87. The highest number of reported fires - 118 took place in 2008, and the least - 32 in 2002. The data has a growing trend.
 When looking into fire subcategories, the most reports belonged to: Structure Fires (37.8%), and Outside Fires (29.2%).