Estimated zip code population in 2022: 31,738 Zip code population in 2010: 28,498 Zip code population in 2000: 29,582
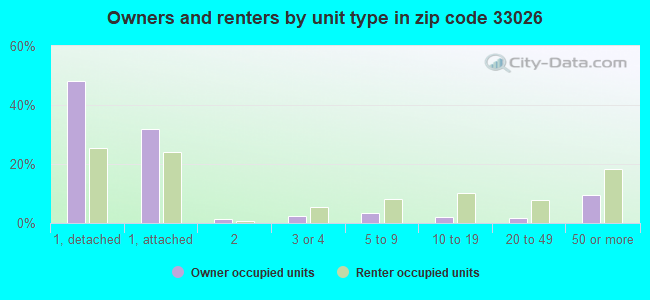
Houses and condos: 12,944 Renter-occupied apartments: 2,457
% of renters here:
19%
State:
33%
March 2022 cost of living index in zip code 33026: 109.0 (more than average, U.S. average is 100)
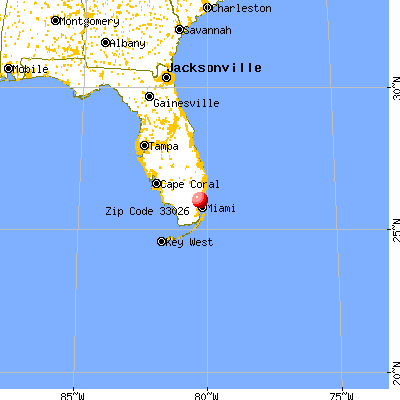
Land area: 4.5 sq. mi. Water area: 0.5 sq. mi.
Population density: 7,005 people per square mile
(high).
OSM Map
General Map
Google Map
MSN Map
OSM Map
General Map
Google Map
MSN Map
OSM Map
General Map
Google Map
MSN Map
OSM Map
General Map
Google Map
MSN Map
Please wait while loading the map...
Real estate property taxes paid for housing units in 2022:
This zip code:
0.8% ($3,561)
Florida:
0.7% ($2,529)
Median real estate property taxes paid for housing units with mortgages in 2022: $3,960 (0.9%) Median real estate property taxes paid for housing units with no mortgage in 2022: $2,946 (0.7%)
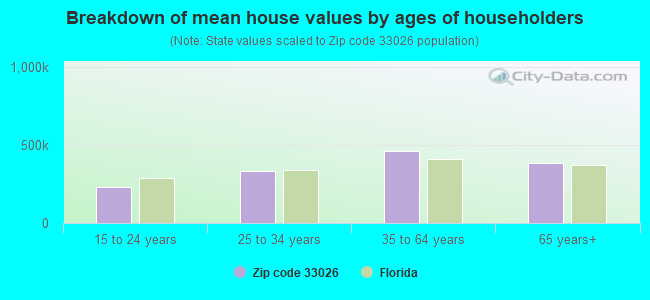
Estimated median house/condo value in 2022: $438,081
33026:
$438,081
Florida:
$354,100
Median resident age:
This zip code:
45.4 years
Florida median age:
42.7 years
Average household size:
This zip code:
2.5 people
Florida:
2.5 people
Averages for the 2020 tax year for zip code 33026, filed in 2021:
Average Adjusted Gross Income (AGI) in 2020: $73,664 (Individual Income Tax Returns)
Here:
$73,664
State:
$82,200
Salary/wage: $67,161 (reported on 80.4% of returns)
Here:
$67,161
State:
$58,347
(% of AGI for various income ranges: 1137.1% for AGIs below $25k, 3750.9% for AGIs $25k-50k, 6673.4% for AGIs $50k-75k, 9912.1% for AGIs $75k-100k, 17631.4% for AGIs $100k-200k, 62292.5% for AGIs over 200k)
Taxable interest for individuals: $1,725 (reported on 26.4% of returns)
This zip code:
$1,725
Florida:
$4,272
(% of AGI for various income ranges: 19.9% for AGIs below $25k, 17.9% for AGIs $25k-50k, 44.0% for AGIs $50k-75k, 58.2% for AGIs $75k-100k, 94.6% for AGIs $100k-200k, 953.8% for AGIs over 200k)
Ordinary dividends: $5,362 (reported on 20.4% of returns)
Here:
$5,362
State:
$15,863
(% of AGI for various income ranges: 27.4% for AGIs below $25k, 38.6% for AGIs $25k-50k, 76.5% for AGIs $50k-75k, 129.4% for AGIs $75k-100k, 314.6% for AGIs $100k-200k, 2305.3% for AGIs over 200k)
Net capital gain/loss in AGI: +$16,108 (reported on 19.7% of returns)
Here:
+$16,108
State:
+$62,983
(% of AGI for various income ranges: 11.6% for AGIs below $25k, 41.5% for AGIs $25k-50k, 91.8% for AGIs $50k-75k, 176.7% for AGIs $75k-100k, 523.7% for AGIs $100k-200k, 11397.5% for AGIs over 200k)
Profit/loss from business: +$6,553 (reported on 25.1% of returns)
Here:
+$6,553
State:
+$9,719
(% of AGI for various income ranges: 212.5% for AGIs below $25k, 76.9% for AGIs $25k-50k, 48.8% for AGIs $50k-75k, 170.7% for AGIs $75k-100k, 246.1% for AGIs $100k-200k, 3086.2% for AGIs over 200k)
Taxable individual retirement arrangement distribution: $18,041 (reported on 7.8% of returns)
33026:
$18,041
Florida:
$24,823
(% of AGI for various income ranges: 49.9% for AGIs below $25k, 89.5% for AGIs $25k-50k, 125.9% for AGIs $50k-75k, 262.6% for AGIs $75k-100k, 423.1% for AGIs $100k-200k, 1935.6% for AGIs over 200k)
Self-employed (Keogh) retirement plans: $20,725 (reported on 0.3% of returns)
33026:
$20,725
Florida:
$29,694
(% of AGI for various income ranges: 51.8% for AGIs $100k-200k)
Total itemized deductions: $29,028 (reported on 11.2% of returns)
Here:
$29,028
State:
$45,393
(% of AGI for various income ranges: 61.3% for AGIs below $25k, 213.3% for AGIs $25k-50k, 479.9% for AGIs $50k-75k, 784.9% for AGIs $75k-100k, 1072.4% for AGIs $100k-200k, 2800.0% for AGIs over 200k)
Charity contributions: $6,935 (reported on 9.2% of returns)
Here:
$6,935
State:
$20,178
(% of AGI for various income ranges: 3.6% for AGIs below $25k, 28.4% for AGIs $25k-50k, 75.3% for AGIs $50k-75k, 115.9% for AGIs $75k-100k, 221.5% for AGIs $100k-200k, 920.3% for AGIs over 200k)
Taxes paid: $7,209 (reported on 11.0% of returns)
33026:
$7,209
State:
$6,967
(% of AGI for various income ranges: 11.1% for AGIs below $25k, 59.2% for AGIs $25k-50k, 127.2% for AGIs $50k-75k, 194.2% for AGIs $75k-100k, 263.6% for AGIs $100k-200k, 591.2% for AGIs over 200k)
Earned income credit: $2,012 (reported on 14.4% of returns)
Here:
$2,012
State:
$2,306
(% of AGI for various income ranges: 92.1% for AGIs below $25k, 53.3% for AGIs $25k-50k)
Percentage of individuals using paid preparers for their 2020 taxes: 91.3%
Here:
91%
State:
92%
(% for various income ranges: 90.1% for AGIs below $25k, 92.4% for AGIs $25k-50k, 91.6% for AGIs $50k-75k, 90.6% for AGIs $75k-100k, 92.5% for AGIs $100k-200k, 91.0% for AGIs over 200k)
Averages for the 2012 tax year for zip code 33026, filed in 2013:
Average Adjusted Gross Income (AGI) in 2012: $60,477 (Individual Income Tax Returns)
Here:
$60,477
State:
$60,316
Salary/wage: $54,961 (reported on 83.1% of returns)
Here:
$54,961
State:
$45,277
(% of AGI for various income ranges: 72.9% for AGIs below $25k, 83.9% for AGIs $25k-50k, 81.5% for AGIs $50k-75k, 80.9% for AGIs $75k-100k, 80.5% for AGIs $100k-200k, 58.0% for AGIs over 200k)
Taxable interest for individuals: $1,478 (reported on 32.7% of returns)
This zip code:
$1,478
Florida:
$3,587
(% of AGI for various income ranges: 1.5% for AGIs below $25k, 0.9% for AGIs $25k-50k, 0.7% for AGIs $50k-75k, 0.6% for AGIs $75k-100k, 0.6% for AGIs $100k-200k, 0.9% for AGIs over 200k)
Ordinary dividends: $4,795 (reported on 21.1% of returns)
Here:
$4,795
State:
$12,831
(% of AGI for various income ranges: 3.0% for AGIs below $25k, 1.6% for AGIs $25k-50k, 1.4% for AGIs $50k-75k, 1.3% for AGIs $75k-100k, 1.4% for AGIs $100k-200k, 2.0% for AGIs over 200k)
Net capital gain/loss in AGI: +$7,590 (reported on 16.8% of returns)
Here:
+$7,590
State:
+$33,493
(% of AGI for various income ranges: 0.2% for AGIs $50k-75k, 1.1% for AGIs $75k-100k, 1.1% for AGIs $100k-200k, 7.3% for AGIs over 200k)
Profit/loss from business: +$8,334 (reported on 19.1% of returns)
Here:
+$8,334
State:
+$10,012
(% of AGI for various income ranges: 10.9% for AGIs below $25k, 2.3% for AGIs $25k-50k, 1.6% for AGIs $50k-75k, 1.6% for AGIs $75k-100k, 1.7% for AGIs $100k-200k, 2.7% for AGIs over 200k)
Taxable individual retirement arrangement distribution: $14,205 (reported on 8.7% of returns)
33026:
$14,205
Florida:
$21,544
(% of AGI for various income ranges: 3.3% for AGIs below $25k, 2.0% for AGIs $25k-50k, 2.2% for AGIs $50k-75k, 1.8% for AGIs $75k-100k, 2.3% for AGIs $100k-200k, 1.4% for AGIs over 200k)
Self-employment retirement plans: $22,660 (reported on 0.3% of returns)
33026:
$22,660
Florida:
$20,611
Total itemized deductions: $20,690 (20% of AGI, reported on 34.9% of returns)
Here:
$20,690
State:
$25,533
Here:
20.1% of AGI
State:
18.0% of AGI
(% of AGI for various income ranges: 10.3% for AGIs below $25k, 13.7% for AGIs $25k-50k, 14.8% for AGIs $50k-75k, 13.0% for AGIs $75k-100k, 12.1% for AGIs $100k-200k, 8.6% for AGIs over 200k)
Charity contributions: $3,115 (reported on 29.6% of returns)
Here:
$3,115
State:
$5,698
(% of AGI for various income ranges: 0.8% for AGIs below $25k, 1.4% for AGIs $25k-50k, 1.7% for AGIs $50k-75k, 1.6% for AGIs $75k-100k, 1.7% for AGIs $100k-200k, 1.4% for AGIs over 200k)
Taxes paid: $4,481 (reported on 34.3% of returns)
33026:
$4,481
State:
$6,203
(% of AGI for various income ranges: 1.6% for AGIs below $25k, 2.5% for AGIs $25k-50k, 2.9% for AGIs $50k-75k, 2.7% for AGIs $75k-100k, 2.7% for AGIs $100k-200k, 2.4% for AGIs over 200k)
Earned income credit: $2,092 (reported on 15.6% of returns)
Here:
$2,092
State:
$2,372
(% of AGI for various income ranges: 5.9% for AGIs below $25k, 0.8% for AGIs $25k-50k)
Percentage of individuals using paid preparers for their 2012 taxes: 64.4%
Here:
64%
State:
54%
(% for various income ranges: 61.7% for AGIs below $25k, 64.1% for AGIs $25k-50k, 65.6% for AGIs $50k-75k, 68.1% for AGIs $75k-100k, 65.8% for AGIs $100k-200k, 76.0% for AGIs over 200k)
Averages for the 2004 tax year for zip code 33026, filed in 2005:
Average Adjusted Gross Income (AGI) in 2004: $51,564 (Individual Income Tax Returns)
Here:
$51,564
State:
$50,523
Salary/wage: $48,488 (reported on 84.1% of returns)
Here:
$48,488
State:
$39,563
(% of AGI for various income ranges: 108.2% for AGIs below $10k, 72.6% for AGIs $10k-25k, 83.7% for AGIs $25k-50k, 85.2% for AGIs $50k-75k, 85.2% for AGIs $75k-100k, 72.4% for AGIs over 100k)
Taxable interest for individuals: $1,794 (reported on 48.1% of returns)
This zip code:
$1,794
Florida:
$3,211
(% of AGI for various income ranges: 9.9% for AGIs below $10k, 3.8% for AGIs $10k-25k, 1.6% for AGIs $25k-50k, 1.3% for AGIs $50k-75k, 1.0% for AGIs $75k-100k, 1.6% for AGIs over 100k)
Taxable dividends: $2,654 (reported on 28.6% of returns)
Here:
$2,654
State:
$6,129
(% of AGI for various income ranges: 9.0% for AGIs below $10k, 2.4% for AGIs $10k-25k, 1.3% for AGIs $25k-50k, 0.8% for AGIs $50k-75k, 1.0% for AGIs $75k-100k, 1.7% for AGIs over 100k)
Net capital gain/loss: +$5,508 (reported on 24.4% of returns)
Here:
+$5,508
State:
+$27,205
(% of AGI for various income ranges: -4.9% for AGIs below $10k, -0.5% for AGIs $10k-25k, 0.3% for AGIs $25k-50k, 0.8% for AGIs $50k-75k, 1.4% for AGIs $75k-100k, 5.4% for AGIs over 100k)
Profit/loss from business: +$8,765 (reported on 16.1% of returns)
Here:
+$8,765
State:
+$10,634
(% of AGI for various income ranges: 16.4% for AGIs below $10k, 7.6% for AGIs $10k-25k, 3.2% for AGIs $25k-50k, 2.3% for AGIs $50k-75k, 1.7% for AGIs $75k-100k, 2.0% for AGIs over 100k)
IRA payment deduction: $3,101 (reported on 3.4% of returns)
33026:
$3,101
Florida:
$3,082
(% of AGI for various income ranges: 0.3% for AGIs below $10k, 0.3% for AGIs $10k-25k, 0.3% for AGIs $25k-50k, 0.2% for AGIs $50k-75k, 0.2% for AGIs $75k-100k, 0.1% for AGIs over 100k)
Self-employed pension: $12,100 (reported on 0.4% of returns)
Here:
$12,100
Florida:
$15,857
Total itemized deductions: $17,727 (23% of AGI, reported on 45.8% of returns)
Here:
$17,727
State:
$20,370
Here:
22.9% of AGI
State:
20.7% of AGI
(% of AGI for various income ranges: 19.9% for AGIs below $10k, 16.5% for AGIs $10k-25k, 20.2% for AGIs $25k-50k, 19.2% for AGIs $50k-75k, 18.3% for AGIs $75k-100k, 11.2% for AGIs over 100k)
Charity contributions deductions: $2,564 (3% of AGI, reported on 41.0% of returns)
Here:
$2,564
State:
$4,064
Here:
3.2% of AGI
State:
3.8% of AGI
(% of AGI for various income ranges: 1.0% for AGIs below $10k, 1.3% for AGIs $10k-25k, 2.2% for AGIs $25k-50k, 2.2% for AGIs $50k-75k, 2.3% for AGIs $75k-100k, 1.9% for AGIs over 100k)
Total tax: $8,161 (reported on 77.6% of returns)
33026:
$8,161
State:
$9,431
(% of AGI for various income ranges: 4.4% for AGIs below $10k, 4.2% for AGIs $10k-25k, 6.5% for AGIs $25k-50k, 9.1% for AGIs $50k-75k, 10.3% for AGIs $75k-100k, 18.2% for AGIs over 100k)
Earned income credit: $1,611 (reported on 10.7% of returns)
Here:
$1,611
State:
$1,808
Percentage of individuals using paid preparers for their 2004 taxes: 63.6%
Here:
64%
State:
60%
(% for various income ranges: 59.7% for AGIs below $10k, 63.0% for AGIs $10k-25k, 64.4% for AGIs $25k-50k, 64.6% for AGIs $50k-75k, 64.2% for AGIs $75k-100k, 67.9% for AGIs over 100k)
Likely homosexual households (counted as self-reported same-sex unmarried-partner households)
Lesbian couples: 0.2% of all households
Gay men: 0.1% of all households
Household received Food Stamps/SNAP in the past 12 months: 1,057 Household did not receive Food Stamps/SNAP in the past 12 months: 11,770
Women who had a birth in the past 12 months: 279 (87 now married, 179 unmarried) Women who did not have a birth in the past 12 months: 6,482 (3,109 now married, 3,374 unmarried)
Housing units in zip code 33026 with a mortgage: 6,261 (655 second mortgage, 6 home equity loan, 555 both second mortgage and home equity loan) Houses without a mortgage: 131
Median monthly owner costs for units with a mortgage: $2,138 Median monthly owner costs for units without a mortgage: $693
Residents with income below the poverty level in 2022:
This zip code:
8.5%
Whole state:
12.7%
Residents with income below 50% of the poverty level in 2022:
This zip code:
3.6%
Whole state:
6.6%
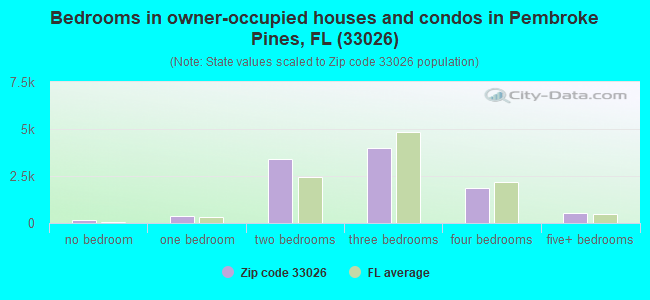
Median number of rooms in houses and condos:
Here:
5.4
State:
5.9
Median number of rooms in apartments:
Here:
4.2
State:
4.2
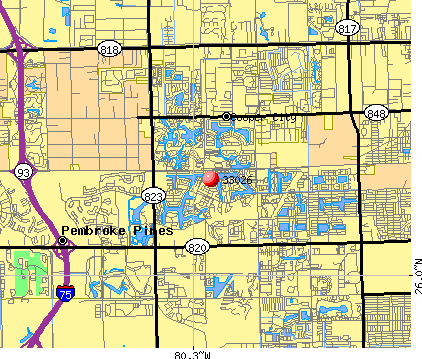
Notable locations in this zip code not listed on our city pages
Notable locations in zip code 33026: Pembroke Lakes Golf Course (A), Shoppes of Cooper City (B), Broward County Sheriffs Office Department of Fire Rescue and Emergency Services Station 28 (C), Cooper City Police Department (D). Display/hide their locations on the map
4,610 married couples with children.
1,206 single-parent households (486 men, 720 women).
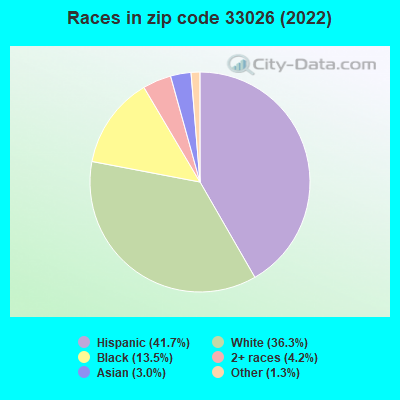
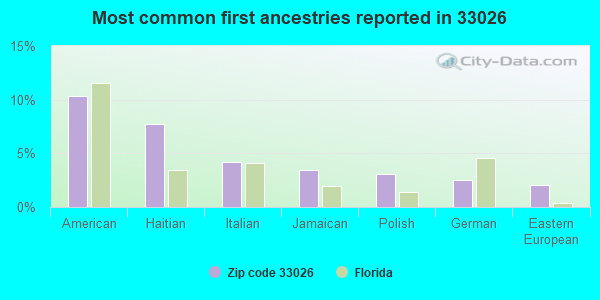
53.6% of residents of 33026 zip code speak English at home.
34.2% of residents speak Spanish at home (64% very well, 19% well, 11% not well, 6% not at all).
8.9% of residents speak other Indo-European language at home (81% very well, 16% well, 1% not well, 2% not at all).
1.8% of residents speak Asian or Pacific Island language at home (50% very well, 22% well, 16% not well, 12% not at all).
1.4% of residents speak other language at home (92% very well, 8% well).
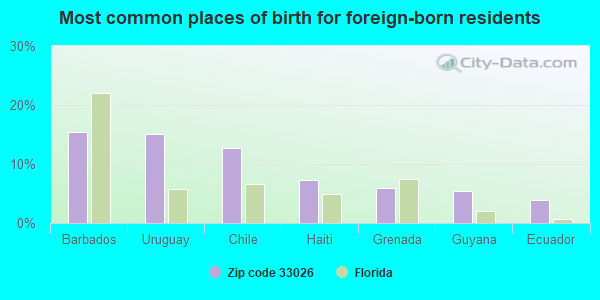
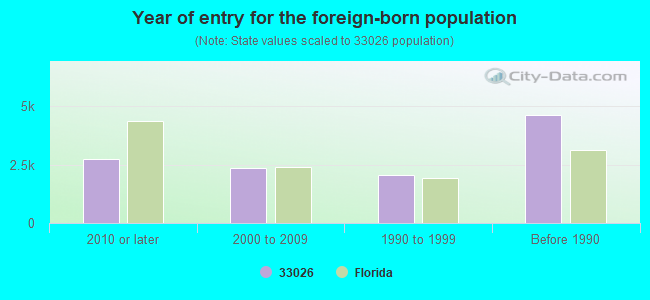
Foreign born population: 11,225 (35.4%) (75.0% of them are naturalized citizens)
Major facilities with environmental interests located in this zip code:
PINES LAKES ELEMENTARY SCHOOL (10300 JOHNSON ST in PEMBROKE PINES, FL)
(Geographic Names Information System) (National Center for Education Statistics) - STATE ID-2861 Organizations: BROWARD COUNTY SCHOOL DISTRICT (SCHOOL DISTRICT)
MOBIL OIL CORP SS #608 (#11194 (12351 TAFT STREET in PEMBROKE PINES, FL)
National Pollutant Discharge Elimination System NON-MAJOR (Tracking pollutant discharge elimination systems) - permit Small Quantity Generators, between 100 kg and 1000 kg of hazardous waste/month (Resource Conservation and Recovery Act (tracking hazardous waste)) - notification Organizations: DAN HORTON (CONTACT/OWNER)
, DAVID SHEEHAN (CONTACT/OWNER)
Alternative names: MOBIL OIL CORP SS# 608
RINKERS MATERIALS/PEMBROKE PIN (17301 PINES BOULEVARD in PEMBROKE PINES, FL)
National Pollutant Discharge Elimination System NON-MAJOR (Tracking pollutant discharge elimination systems) - permit Business SIC classification: READY-MIXED CONCRETE Organizations: J. BENYON (CONTACT/OWNER)
JEFFERSON AT PINE LAKE (NORTHEAST CORNER OF WASHINGTON in PEMBROKE PINES, FL)
National Pollutant Discharge Elimination System NON-MAJOR (Tracking pollutant discharge elimination systems) - permit Organizations: FRANCISCO GARCIA (CONTACT/OWNER)
PEMBROKE LAKES SQUARE (NE CORNER OF PINES BLVD & HIAT in PEMBROKE PINES, FL)
National Pollutant Discharge Elimination System NON-MAJOR (Tracking pollutant discharge elimination systems) - permit Organizations: J SUDDETH (CONTACT/OWNER)
PENSKE AUTO CENTER (15915 PINES BLVD SECTION B in PEMBROKE PINES, FL)
(Resource Conservation and Recovery Act (tracking hazardous waste)) Organizations: PENSKE AUTO CENTERS INC (CONTACT/OWNER)
ACADEMIC VILLAGE (17189 SHERIDAN ST in PEMBROKE PINES, FL)
National Pollutant Discharge Elimination System NON-MAJOR (Tracking pollutant discharge elimination systems) - permit Alternative names: THE HASKELL CO
AIR MINOR (AIRS/AFS) Business SIC classification: DRYCLEANING PLANTS, EXCEPT RUG CLEANING
JEFFERSON PINES APARTMENTS (WASHINGTON ST & HIATUS RD in PEMBROKE PINES, FL)
National Pollutant Discharge Elimination System NON-MAJOR (Tracking pollutant discharge elimination systems) - permit Alternative names: JPI
POOL CENTERS U.S.A. #3 (2511 N. HIATUS RD. in COPPER CITY, FL)
COMPLIANCE ACTIVITY (Tracking inspections of insecticide, fungicide, and rodenticide, and toxic substances)
QTSA INC (9990 NW 6TH COURT in PEMBROKE PINES, FL)
AIR MINOR (AIRS/AFS) Business SIC classification: DRYCLEANING PLANTS, EXCEPT RUG CLEANING
CONTINENTAL CONCRETE - PEMBROK (19681 DUN RAVEN PASS (SW 69TH in PEMBROKE PINES, FL)
National Pollutant Discharge Elimination System NON-MAJOR (Tracking pollutant discharge elimination systems) - permit Business SIC classification: READY-MIXED CONCRETE
Housing units lacking complete plumbing facilities: 0.5% Housing units lacking complete kitchen facilities: 1.3%
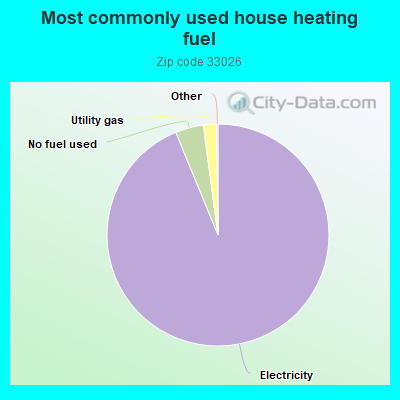
93.8%Electricity
4.1%No fuel used
1.9%Utility gas
Population in 1990: 21,473. Population change in the 1990s: +8,109 (+37.8%).
Place of birth for U.S.-born residents:
This state: 11,520
Northeast: 4,669
Midwest: 1,441
South: 1,187
West: 734
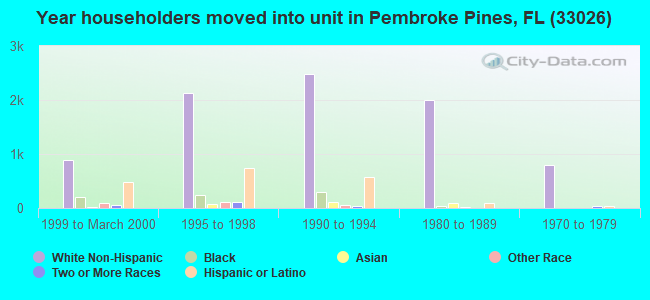
62% of the 33026 zip code residents lived in the same house 5 years ago. Out of people who lived in different houses, 50% lived in this county. Out of people who lived in different counties, 50% lived in Florida.
91% of the 33026 zip code residents lived in the same house 1 year ago. Out of people who lived in different houses, 45% moved from this county. Out of people who lived in different houses, 30% moved from different county within same state. Out of people who lived in different houses, 17% moved from different state. Out of people who lived in different houses, 10% moved from abroad.
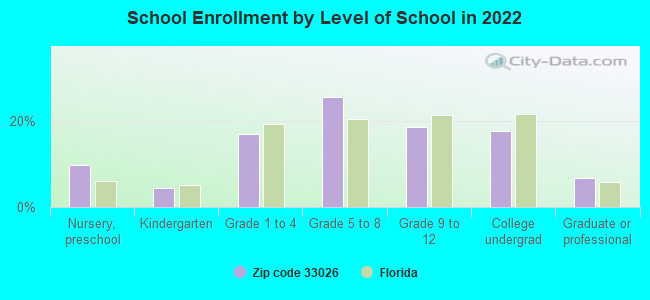
Private vs. public school enrollment:
Students in private schools in grades 1 to 8 (elementary and middle school): 159
Here:
5.6%
Florida:
15.8%
Students in private schools in grades 9 to 12 (high school): 104
Here:
8.3%
Florida:
12.9%
Students in private undergraduate colleges: 456
Here:
37.8%
Florida:
23.6%
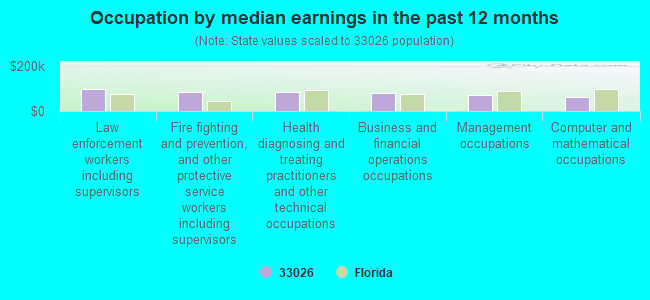
Occupation by median earnings in the past 12 months ($)
99,698Law enforcement workers including supervisors
84,898Fire fighting and prevention, and other protective service workers including supervisors
84,554Health diagnosing and treating practitioners and other technical occupations
79,104Business and financial operations occupations
72,325Management occupations
63,670Computer and mathematical occupations
Companies with federal contracts located in this zip code:
BUSINESS OPERATION SUPPORT SER (11985 N W 12TH STREET in PEMBROKE PINES, FL; small business) : $62,400 in 2 contractsin 2000
$62,400 with Army for Other Education and Training Services. Signed on 2000-10-01. Completion date: 2001-09-30.
$0, same as above.Signed on 2000-10-01. Completion date: 2001-09-30.
BELL RUTH W / GERARD R INC (2540 BASS WAY in HOLLYWOOD, FL; small business) : $22,651 in 5 contractsfrom 2002 to 2005
Contracts for Office Information System Equipment, Printing, Duplicating, and Bookbinding Equipment, Miscellaneous Office Machines, Miscellaneous Printed Matter, and moreby Army Signed by year:2000: $0; 2001: $0; 2002: $13,194; 2003: $2,961; 2004: $2,770; 2005: $3,726; 2006: $0.
Biggest contracts:
$6,796 with Army for Office Information System Equipment. Signed on 2002-03-08. Completion date: 2002-03-22.
$6,398 with Army for Printing, Duplicating, and Bookbinding Equipment. Signed on 2002-03-27. Completion date: 2002-05-15.
$3,726 with Army for Miscellaneous Office Machines. Signed on 2005-09-14. Completion date: 2005-10-14.
$2,961 with Army for Miscellaneous Printed Matter. Signed on 2003-09-30. Completion date: 2003-11-28.
Top industries in this zip code by the number of employees in 2005:
2002 - 2018 National Fire Incident Reporting System (NFIRS) incidents
According to the data from the years 2002 - 2018 the average number of fire incidents per year is 35. The highest number of reported fires - 53 took place in 2003, and the least - 15 in 2015. The data has a dropping trend.
When looking into fire subcategories, the most reports belonged to: Outside Fires (35.7%), and Structure Fires (31.7%).
Fire incident types reported to NFIRS in Zip Code 33026


 Nearest zip codes: 33025, 33330, 33028, 33328, 33024, 33027.


 According to the data from the years 2002 - 2018 the average number of fire incidents per year is 35. The highest number of reported fires - 53 took place in 2003, and the least - 15 in 2015. The data has a dropping trend.
 When looking into fire subcategories, the most reports belonged to: Outside Fires (35.7%), and Structure Fires (31.7%).