Estimated zip code population in 2022: 75,475 Zip code population in 2010: 63,916 Zip code population in 2000: 58,895
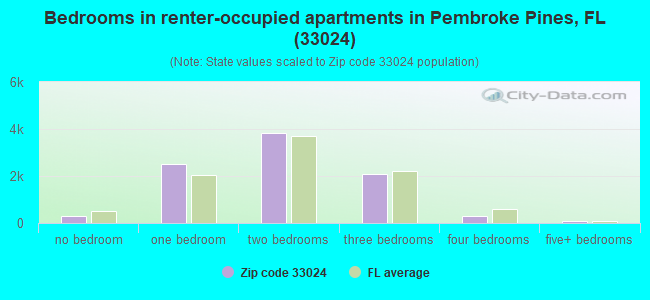
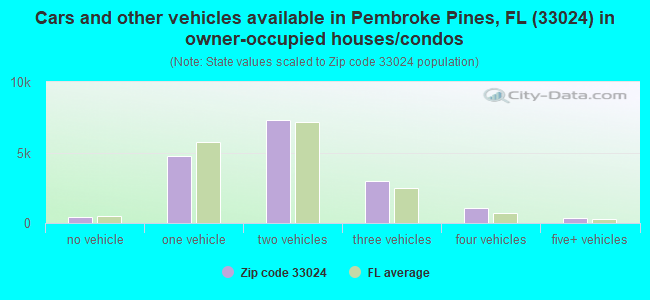
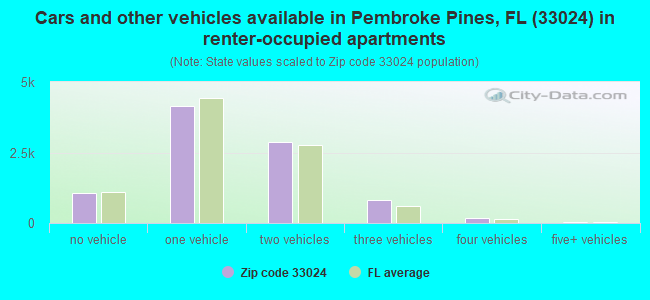
Houses and condos: 27,135 Renter-occupied apartments: 9,107
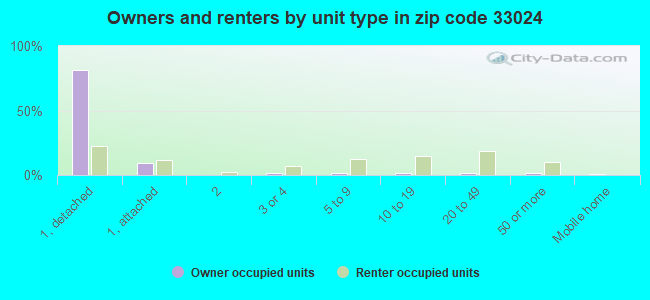
% of renters here:
35%
State:
33%
March 2022 cost of living index in zip code 33024: 108.8 (more than average, U.S. average is 100)
Land area: 10.7 sq. mi. Water area: 0.3 sq. mi.
Population density: 7,026 people per square mile
(high).
OSM Map
General Map
Google Map
MSN Map
OSM Map
General Map
Google Map
MSN Map
OSM Map
General Map
Google Map
MSN Map
OSM Map
General Map
Google Map
MSN Map
Please wait while loading the map...
Real estate property taxes paid for housing units in 2022:
This zip code:
0.7% ($2,845)
Florida:
0.7% ($2,529)
Median real estate property taxes paid for housing units with mortgages in 2022: $3,166 (0.8%) Median real estate property taxes paid for housing units with no mortgage in 2022: $2,304 (0.6%)
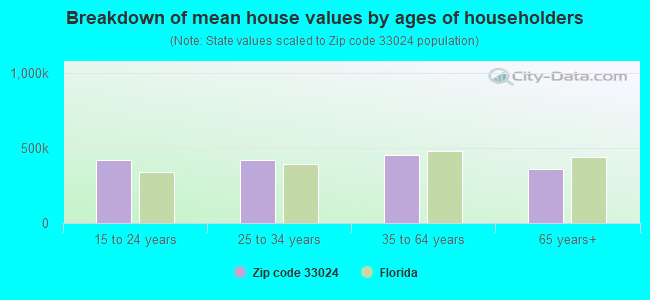
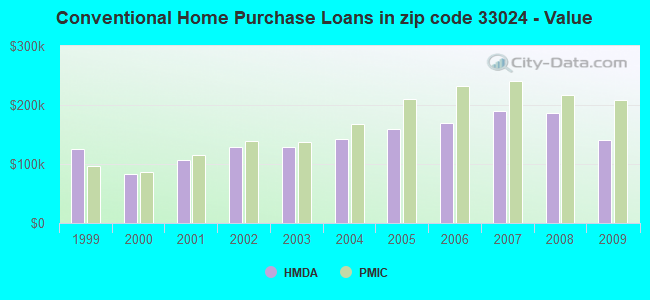
Estimated median house/condo value in 2022: $409,845
33024:
$409,845
Florida:
$354,100
According to our research of Florida and other state lists, there were 25 registered sex offenders living in 33024 zip code as of April 27, 2024. The ratio of all residents to sex offenders in zip code 33024 is 2,963 to 1. The ratio of registered sex offenders to all residents in this zip code is much lower than the state average.
Median resident age:
This zip code:
37.1 years
Florida median age:
42.7 years
Average household size:
This zip code:
2.9 people
Florida:
2.5 people
Averages for the 2020 tax year for zip code 33024, filed in 2021:
Average Adjusted Gross Income (AGI) in 2020: $51,968 (Individual Income Tax Returns)
Here:
$51,968
State:
$82,200
Salary/wage: $48,811 (reported on 80.8% of returns)
Here:
$48,811
State:
$58,347
(% of AGI for various income ranges: 1238.4% for AGIs below $25k, 3709.8% for AGIs $25k-50k, 6858.4% for AGIs $50k-75k, 9980.9% for AGIs $75k-100k, 15024.5% for AGIs $100k-200k, 67826.9% for AGIs over 200k)
Taxable interest for individuals: $1,249 (reported on 15.2% of returns)
This zip code:
$1,249
Florida:
$4,272
(% of AGI for various income ranges: 7.2% for AGIs below $25k, 8.3% for AGIs $25k-50k, 18.5% for AGIs $50k-75k, 38.5% for AGIs $75k-100k, 69.7% for AGIs $100k-200k, 821.6% for AGIs over 200k)
Ordinary dividends: $4,271 (reported on 9.7% of returns)
Here:
$4,271
State:
$15,863
(% of AGI for various income ranges: 9.1% for AGIs below $25k, 14.7% for AGIs $25k-50k, 31.6% for AGIs $50k-75k, 66.2% for AGIs $75k-100k, 160.0% for AGIs $100k-200k, 2285.3% for AGIs over 200k)
Net capital gain/loss in AGI: +$12,428 (reported on 9.7% of returns)
Here:
+$12,428
State:
+$62,983
(% of AGI for various income ranges: 4.7% for AGIs below $25k, 17.2% for AGIs $25k-50k, 42.2% for AGIs $50k-75k, 95.4% for AGIs $75k-100k, 376.8% for AGIs $100k-200k, 10154.4% for AGIs over 200k)
Profit/loss from business: +$3,850 (reported on 30.1% of returns)
Here:
+$3,850
State:
+$9,719
(% of AGI for various income ranges: 203.2% for AGIs below $25k, 49.7% for AGIs $25k-50k, 120.1% for AGIs $50k-75k, 135.3% for AGIs $75k-100k, 123.6% for AGIs $100k-200k, 2097.2% for AGIs over 200k)
Taxable individual retirement arrangement distribution: $15,051 (reported on 3.5% of returns)
33024:
$15,051
Florida:
$24,823
(% of AGI for various income ranges: 21.5% for AGIs below $25k, 34.8% for AGIs $25k-50k, 63.3% for AGIs $50k-75k, 153.4% for AGIs $75k-100k, 317.9% for AGIs $100k-200k, 583.1% for AGIs over 200k)
Self-employed (Keogh) retirement plans: $24,750 (reported on 0.1% of returns)
33024:
$24,750
Florida:
$29,694
(% of AGI for various income ranges: 20.8% for AGIs $100k-200k)
Total itemized deductions: $28,747 (reported on 8.5% of returns)
Here:
$28,747
State:
$45,393
(% of AGI for various income ranges: 32.3% for AGIs below $25k, 185.7% for AGIs $25k-50k, 438.2% for AGIs $50k-75k, 752.8% for AGIs $75k-100k, 983.4% for AGIs $100k-200k, 5595.3% for AGIs over 200k)
Charity contributions: $7,096 (reported on 6.6% of returns)
Here:
$7,096
State:
$20,178
(% of AGI for various income ranges: 2.5% for AGIs below $25k, 25.5% for AGIs $25k-50k, 80.8% for AGIs $50k-75k, 146.3% for AGIs $75k-100k, 224.5% for AGIs $100k-200k, 1271.9% for AGIs over 200k)
Taxes paid: $7,142 (reported on 8.2% of returns)
33024:
$7,142
State:
$6,967
(% of AGI for various income ranges: 7.6% for AGIs below $25k, 45.8% for AGIs $25k-50k, 115.7% for AGIs $50k-75k, 196.6% for AGIs $75k-100k, 239.5% for AGIs $100k-200k, 1031.9% for AGIs over 200k)
Earned income credit: $2,246 (reported on 24.8% of returns)
Here:
$2,246
State:
$2,306
(% of AGI for various income ranges: 130.5% for AGIs below $25k, 74.1% for AGIs $25k-50k, 1.0% for AGIs $50k-75k)
Percentage of individuals using paid preparers for their 2020 taxes: 91.7%
Here:
92%
State:
92%
(% for various income ranges: 90.4% for AGIs below $25k, 93.0% for AGIs $25k-50k, 92.0% for AGIs $50k-75k, 92.2% for AGIs $75k-100k, 92.2% for AGIs $100k-200k, 91.4% for AGIs over 200k)
Averages for the 2012 tax year for zip code 33024, filed in 2013:
Average Adjusted Gross Income (AGI) in 2012: $41,784 (Individual Income Tax Returns)
Here:
$41,784
State:
$60,316
Salary/wage: $39,388 (reported on 84.3% of returns)
Here:
$39,388
State:
$45,277
(% of AGI for various income ranges: 78.4% for AGIs below $25k, 86.8% for AGIs $25k-50k, 88.0% for AGIs $50k-75k, 85.7% for AGIs $75k-100k, 72.2% for AGIs $100k-200k, 57.0% for AGIs over 200k)
Taxable interest for individuals: $880 (reported on 18.5% of returns)
This zip code:
$880
Florida:
$3,587
(% of AGI for various income ranges: 0.7% for AGIs below $25k, 0.4% for AGIs $25k-50k, 0.3% for AGIs $50k-75k, 0.3% for AGIs $75k-100k, 0.3% for AGIs $100k-200k, 0.5% for AGIs over 200k)
Ordinary dividends: $5,039 (reported on 9.6% of returns)
Here:
$5,039
State:
$12,831
(% of AGI for various income ranges: 1.1% for AGIs below $25k, 1.3% for AGIs $25k-50k, 0.8% for AGIs $50k-75k, 0.6% for AGIs $75k-100k, 1.5% for AGIs $100k-200k, 1.6% for AGIs over 200k)
Net capital gain/loss in AGI: +$5,364 (reported on 6.6% of returns)
Here:
+$5,364
State:
+$33,493
(% of AGI for various income ranges: 0.2% for AGIs $50k-75k, 0.3% for AGIs $75k-100k, 0.5% for AGIs $100k-200k, 6.7% for AGIs over 200k)
Profit/loss from business: +$5,379 (reported on 21.0% of returns)
Here:
+$5,379
State:
+$10,012
(% of AGI for various income ranges: 12.2% for AGIs below $25k, 1.5% for AGIs $25k-50k, 1.1% for AGIs $50k-75k, 0.7% for AGIs $75k-100k, 0.7% for AGIs $100k-200k, 2.0% for AGIs over 200k)
Taxable individual retirement arrangement distribution: $12,000 (reported on 4.3% of returns)
33024:
$12,000
Florida:
$21,544
(% of AGI for various income ranges: 1.2% for AGIs below $25k, 0.9% for AGIs $25k-50k, 1.2% for AGIs $50k-75k, 1.4% for AGIs $75k-100k, 1.4% for AGIs $100k-200k, 1.4% for AGIs over 200k)
Self-employment retirement plans: $14,040 (reported on 0.1% of returns)
33024:
$14,040
Florida:
$20,611
Total itemized deductions: $18,836 (25% of AGI, reported on 25.5% of returns)
Here:
$18,836
State:
$25,533
Here:
24.8% of AGI
State:
18.0% of AGI
(% of AGI for various income ranges: 6.3% for AGIs below $25k, 12.3% for AGIs $25k-50k, 14.5% for AGIs $50k-75k, 13.6% for AGIs $75k-100k, 11.3% for AGIs $100k-200k, 9.4% for AGIs over 200k)
Charity contributions: $2,826 (reported on 20.4% of returns)
Here:
$2,826
State:
$5,698
(% of AGI for various income ranges: 0.5% for AGIs below $25k, 1.4% for AGIs $25k-50k, 1.9% for AGIs $50k-75k, 1.7% for AGIs $75k-100k, 1.4% for AGIs $100k-200k, 1.2% for AGIs over 200k)
Taxes paid: $3,668 (reported on 24.7% of returns)
33024:
$3,668
State:
$6,203
(% of AGI for various income ranges: 0.9% for AGIs below $25k, 1.9% for AGIs $25k-50k, 2.5% for AGIs $50k-75k, 2.5% for AGIs $75k-100k, 2.6% for AGIs $100k-200k, 2.4% for AGIs over 200k)
Earned income credit: $2,340 (reported on 27.9% of returns)
Here:
$2,340
State:
$2,372
(% of AGI for various income ranges: 9.0% for AGIs below $25k, 1.2% for AGIs $25k-50k)
Percentage of individuals using paid preparers for their 2012 taxes: 66.0%
Here:
66%
State:
54%
(% for various income ranges: 64.7% for AGIs below $25k, 65.4% for AGIs $25k-50k, 67.3% for AGIs $50k-75k, 65.3% for AGIs $75k-100k, 73.6% for AGIs $100k-200k, 78.0% for AGIs over 200k)
Averages for the 2004 tax year for zip code 33024, filed in 2005:
Average Adjusted Gross Income (AGI) in 2004: $37,156 (Individual Income Tax Returns)
Here:
$37,156
State:
$50,523
Salary/wage: $35,175 (reported on 86.1% of returns)
Here:
$35,175
State:
$39,563
(% of AGI for various income ranges: 97.4% for AGIs below $10k, 82.5% for AGIs $10k-25k, 84.3% for AGIs $25k-50k, 88.5% for AGIs $50k-75k, 87.4% for AGIs $75k-100k, 63.5% for AGIs over 100k)
Taxable interest for individuals: $1,386 (reported on 30.0% of returns)
This zip code:
$1,386
Florida:
$3,211
(% of AGI for various income ranges: 3.1% for AGIs below $10k, 1.2% for AGIs $10k-25k, 0.6% for AGIs $25k-50k, 0.6% for AGIs $50k-75k, 0.7% for AGIs $75k-100k, 2.4% for AGIs over 100k)
Taxable dividends: $1,739 (reported on 12.3% of returns)
Here:
$1,739
State:
$6,129
(% of AGI for various income ranges: 2.2% for AGIs below $10k, 0.7% for AGIs $10k-25k, 0.4% for AGIs $25k-50k, 0.4% for AGIs $50k-75k, 0.4% for AGIs $75k-100k, 0.8% for AGIs over 100k)
Net capital gain/loss: +$5,120 (reported on 9.7% of returns)
Here:
+$5,120
State:
+$27,205
(% of AGI for various income ranges: -1.4% for AGIs below $10k, -0.1% for AGIs $10k-25k, 0.3% for AGIs $25k-50k, 0.6% for AGIs $50k-75k, 0.8% for AGIs $75k-100k, 5.2% for AGIs over 100k)
Profit/loss from business: +$6,700 (reported on 16.2% of returns)
Here:
+$6,700
State:
+$10,634
(% of AGI for various income ranges: 20.9% for AGIs below $10k, 8.6% for AGIs $10k-25k, 1.7% for AGIs $25k-50k, 1.3% for AGIs $50k-75k, 1.5% for AGIs $75k-100k, 1.8% for AGIs over 100k)
IRA payment deduction: $2,734 (reported on 2.1% of returns)
33024:
$2,734
Florida:
$3,082
(% of AGI for various income ranges: 0.2% for AGIs below $10k, 0.2% for AGIs $10k-25k, 0.2% for AGIs $25k-50k, 0.2% for AGIs $50k-75k, 0.1% for AGIs $75k-100k, 0.1% for AGIs over 100k)
Self-employed pension: $9,536 (reported on 0.1% of returns)
Here:
$9,536
Florida:
$15,857
Total itemized deductions: $16,493 (29% of AGI, reported on 34.2% of returns)
Here:
$16,493
State:
$20,370
Here:
29.0% of AGI
State:
20.7% of AGI
(% of AGI for various income ranges: 11.8% for AGIs below $10k, 12.3% for AGIs $10k-25k, 17.2% for AGIs $25k-50k, 17.1% for AGIs $50k-75k, 15.5% for AGIs $75k-100k, 12.1% for AGIs over 100k)
Charity contributions deductions: $2,200 (4% of AGI, reported on 28.8% of returns)
Here:
$2,200
State:
$4,064
Here:
3.5% of AGI
State:
3.8% of AGI
(% of AGI for various income ranges: 0.6% for AGIs below $10k, 1.0% for AGIs $10k-25k, 1.7% for AGIs $25k-50k, 2.0% for AGIs $50k-75k, 2.1% for AGIs $75k-100k, 1.7% for AGIs over 100k)
Total tax: $4,809 (reported on 72.6% of returns)
33024:
$4,809
State:
$9,431
(% of AGI for various income ranges: 4.5% for AGIs below $10k, 3.9% for AGIs $10k-25k, 6.3% for AGIs $25k-50k, 8.5% for AGIs $50k-75k, 10.4% for AGIs $75k-100k, 18.1% for AGIs over 100k)
Earned income credit: $1,844 (reported on 21.7% of returns)
Here:
$1,844
State:
$1,808
Percentage of individuals using paid preparers for their 2004 taxes: 64.6%
Here:
65%
State:
60%
(% for various income ranges: 59.3% for AGIs below $10k, 66.1% for AGIs $10k-25k, 66.2% for AGIs $25k-50k, 63.1% for AGIs $50k-75k, 65.7% for AGIs $75k-100k, 70.2% for AGIs over 100k)
Likely homosexual households (counted as self-reported same-sex unmarried-partner households)
Lesbian couples: 0.3% of all households
Gay men: 0.2% of all households
Household received Food Stamps/SNAP in the past 12 months: 4,353 Household did not receive Food Stamps/SNAP in the past 12 months: 21,614
Women who had a birth in the past 12 months: 623 (372 now married, 245 unmarried) Women who did not have a birth in the past 12 months: 17,371 (7,680 now married, 9,693 unmarried)
Housing units in zip code 33024 with a mortgage: 11,593 (1,193 second mortgage, 10 home equity loan, 922 both second mortgage and home equity loan) Houses without a mortgage: 418
Median monthly owner costs for units with a mortgage: $1,898 Median monthly owner costs for units without a mortgage: $609
Residents with income below the poverty level in 2022:
This zip code:
11.1%
Whole state:
12.7%
Residents with income below 50% of the poverty level in 2022:
This zip code:
5.7%
Whole state:
6.6%
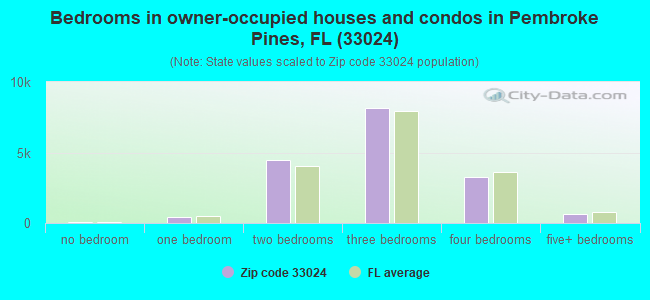
Median number of rooms in houses and condos:
Here:
5.4
State:
5.9
Median number of rooms in apartments:
Here:
3.9
State:
4.2
Notable locations in this zip code not listed on our city pages
Notable locations in zip code 33024: Pines Bank Plaza (A), Pembroke Pines Plaza West (B), Sterling Plaza (C), San Carlos Plaza (D), Palm Johnson Shopping Plaza (E), Fletcher Park Arts and Cultural Center (F), Pembroke Pines Library (G), Hollywood Library (H), Hollywood Fire Rescue and Beach Safety Department Station 45 (I), Seminole Tribe Fire Department Station 108 (J), Seminole Police Department (K), Dorothy Scott Osceola Library (L). Display/hide their locations on the map
Shopping Centers: Pembroke Commons Shopping Center (1), Palm Johnson Plaza Shopping Center (2), University Mall Shopping Center (3), University Village Shopping Center (4), Pembroke Village Shopping Center (5), Taft-Hollywood Shopping Center (6). Display/hide their locations on the map
Churches in zip code 33024 include: Saint Bernadettes Church (A), Taft Street Chapel (B), Angelical Covenant Church (C), Trinity Church (D), Holy Sacrament Church (E), Pembroke Road Baptist Church (F). Display/hide their locations on the map
8,690 married couples with children.
7,639 single-parent households (1,508 men, 6,131 women).
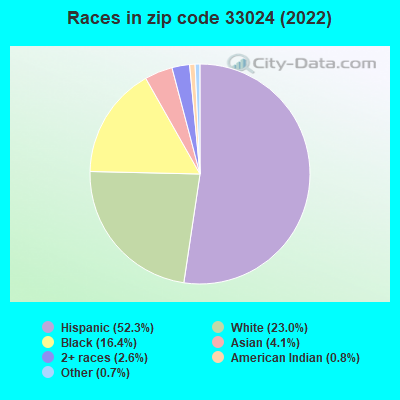
45.6% of residents of 33024 zip code speak English at home.
44.8% of residents speak Spanish at home (53% very well, 22% well, 16% not well, 9% not at all).
6.1% of residents speak other Indo-European language at home (70% very well, 22% well, 7% not well, 1% not at all).
2.3% of residents speak Asian or Pacific Island language at home (32% very well, 42% well, 22% not well, 4% not at all).
1.2% of residents speak other language at home (82% very well, 16% well, 2% not well).
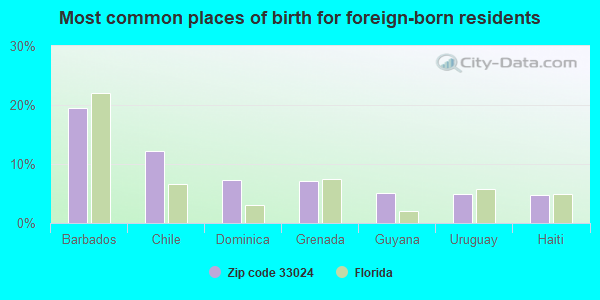
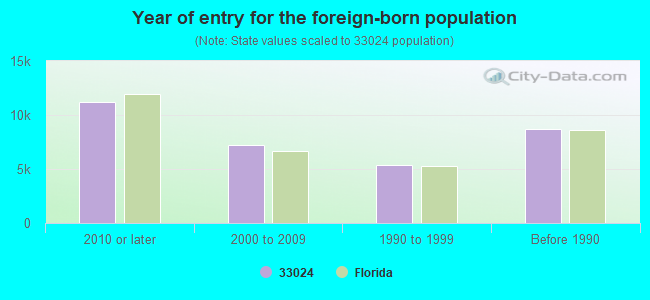
Foreign born population: 29,585 (39.2%) (66.1% of them are naturalized citizens)
Major facilities with environmental interests located in this zip code:
APOLLO MIDDLE SCHOOL (6800 ARTHUR STREET in HOLLYWOOD, FL)
(Geographic Names Information System) (National Center for Education Statistics) - STATE ID-1791 (Resource Conservation and Recovery Act (tracking hazardous waste)) Organizations: MARK COMMISKEY, CHEM MGR (CONTACT/OWNER)
, BROWARD COUNTY SCHOOL DISTRICT (SCHOOL DISTRICT)
Alternative names: BROWARD CO APOLLO MIDDLE SCHOOL
LOWE'S OF PEMBROKE PINES (8321 PINES BLVD. in PEMBROKE PINES, FL)
National Pollutant Discharge Elimination System NON-MAJOR (Tracking pollutant discharge elimination systems) - permit National Pollutant Discharge Elimination System NON-MAJOR (Tracking pollutant discharge elimination systems) - permit Organizations: MICHAEL MCMURRAY (CONTACT/OWNER)
, DON WINN (CONTACT/OWNER)
Alternative names: LOWE'S OF PEMBROKE PINES, FL
SHERIDAN PARK ELEMENTARY SCHOOL (2310 N 70TH TER in HOLLYWOOD, FL)
(Geographic Names Information System) (National Center for Education Statistics) - STATE ID-1321 Organizations: BROWARD COUNTY SCHOOL DISTRICT (SCHOOL DISTRICT)
NORTH PERRY AIRPORT (7750 PINES BLVD in PEMBROKE PINES, FL)
National Pollutant Discharge Elimination System NON-MAJOR (Tracking pollutant discharge elimination systems) - permit National Pollutant Discharge Elimination System NON-MAJOR (Tracking pollutant discharge elimination systems) - permit Business SIC classification: AIR TRANSPORTATION, SCHEDULED; AIRPORTS, FLYING FIELDS, AND AIRPORT TERMINAL SERVICES Organizations: ROBERT ALLEY (CONTACT/OWNER)
, DIANA LEWIS (CONTACT/OWNER)
Alternative names: THE CERTIFIED GROUP INC
HOLLYWOOD PARK ELEMENTARY SCHOOL (901 N 69TH WAY in HOLLYWOOD, FL)
(Geographic Names Information System) (National Center for Education Statistics) - STATE ID-1761 Organizations: BROWARD COUNTY SCHOOL DISTRICT (SCHOOL DISTRICT)
SPRING CLEANERS INC (9920 PINES BLVD in PEMBROKE PINES, FL)
AIR MINOR (AIRS/AFS) Small Quantity Generators, between 100 kg and 1000 kg of hazardous waste/month (Resource Conservation and Recovery Act (tracking hazardous waste)) - notification (Resource Conservation and Recovery Act (tracking hazardous waste)) Business SIC classification: DRYCLEANING PLANTS, EXCEPT RUG CLEANING Organizations: WINSTON FOSTER, PRESIDENT (CONTACT/OWNER)
, CRAIG DRANG, PRES (CONTACT/OWNER)
Alternative names: DRY CLEAN USA
AHMED ENTERPRISES INC (9917 PINES BOULEVARD in PEMBROKE PINES, FL)
AIR MINOR (AIRS/AFS) Small Quantity Generators, between 100 kg and 1000 kg of hazardous waste/month (Resource Conservation and Recovery Act (tracking hazardous waste)) - notification Business SIC classification: DRYCLEANING PLANTS, EXCEPT RUG CLEANING Organizations: VADIM TKACH, PRES (CONTACT/OWNER)
Alternative names: MAGIC TOUCH CLEANERS
PASADENA LAKES ELEMENTARY SCHOOL (8801 PASADENA BLVD in PEMBROKE PINES, FL)
(National Center for Education Statistics) - STATE ID-2071 Organizations: BROWARD COUNTY SCHOOL DISTRICT (SCHOOL DISTRICT)
GROUP I AUTOMOTIVE (8665 PINES BOULEVARD in PEMBROKE PINES, FL)
(Integrated Compliance Information System) - ICIS-04-2003-1501, FORMAL ENFORCEMENT ACTION Business SIC classification: MOTOR VEHICLE DEALERS (NEW AND USED); GENERAL AUTOMOTIVE REPAIR SHOPS
NEW LOOK ENTERPRISES INC (9075 TAFT STREET in PEMBROKE PINES, FL)
AIR MINOR (AIRS/AFS) (Resource Conservation and Recovery Act (tracking hazardous waste)) Business SIC classification: DRYCLEANING PLANTS, EXCEPT RUG CLEANING Organizations: ZULFIQAR LAKHA (CONTACT/OWNER)
Alternative names: 1HR CLEANERS
RICHARD'S HARDWARE (7041 TAFT STREET in HOLLYWOOD, FL)
(Integrated Compliance Information System) - ICIS-04-2003-3032, FORMAL ENFORCEMENT ACTION
SPIC-N-SPAN CLEANERS (6707 TAFT STREET in HOLLYWOOD, FL)
AIR MINOR (AIRS/AFS) (Resource Conservation and Recovery Act (tracking hazardous waste)) Business SIC classification: DRYCLEANING PLANTS, EXCEPT RUG CLEANING Organizations: OTTO PARETS (CONTACT/OWNER)
Alternative names: SPIC N SPIC CLEANERS
7-ELEVEN STORE #22825 (6385 SHERIDAN STREET in HOLLYWOOD, FL)
National Pollutant Discharge Elimination System NON-MAJOR (Tracking pollutant discharge elimination systems) - permit Organizations: WILLO SMITH (CONTACT/OWNER)
Housing units lacking complete plumbing facilities: 0.8% Housing units lacking complete kitchen facilities: 0.8%
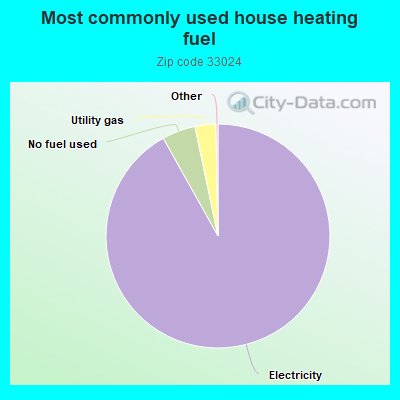
91.8%Electricity
4.8%No fuel used
3.0%Utility gas
Population in 1990: 54,411. Population change in the 1990s: +4,484 (+8.2%).
Place of birth for U.S.-born residents:
This state: 29,287
Northeast: 9,383
Midwest: 1,912
South: 1,908
West: 506
58% of the 33024 zip code residents lived in the same house 5 years ago. Out of people who lived in different houses, 57% lived in this county. Out of people who lived in different counties, 50% lived in Florida.
88% of the 33024 zip code residents lived in the same house 1 year ago. Out of people who lived in different houses, 46% moved from this county. Out of people who lived in different houses, 24% moved from different county within same state. Out of people who lived in different houses, 19% moved from different state. Out of people who lived in different houses, 11% moved from abroad.
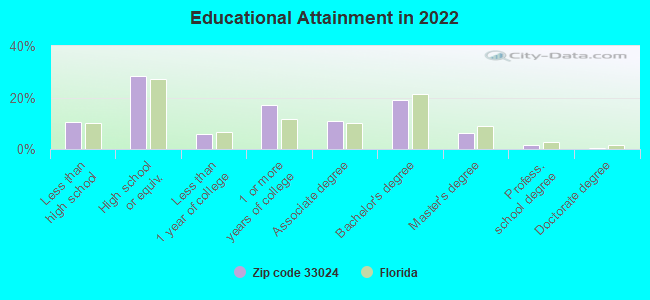
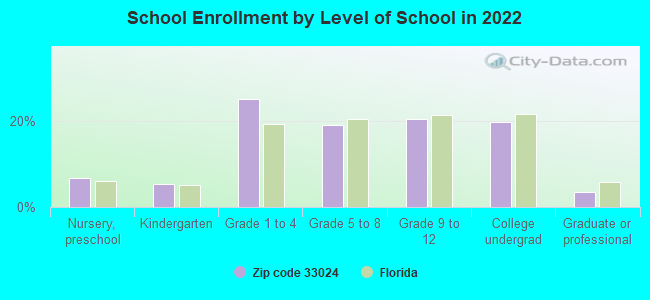
Private vs. public school enrollment:
Students in private schools in grades 1 to 8 (elementary and middle school): 1,119
Here:
13.0%
Florida:
15.8%
Students in private schools in grades 9 to 12 (high school): 555
Here:
13.8%
Florida:
12.9%
Students in private undergraduate colleges: 1,464
Here:
37.3%
Florida:
23.6%
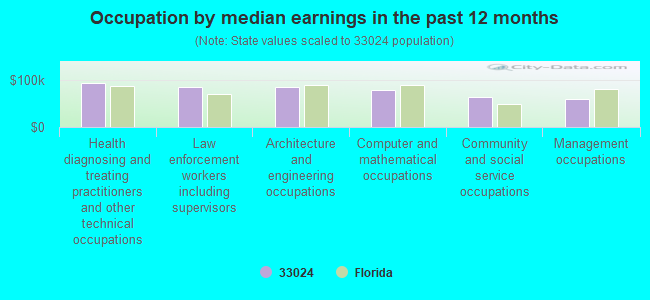
Occupation by median earnings in the past 12 months ($)
94,371Health diagnosing and treating practitioners and other technical occupations
85,498Law enforcement workers including supervisors
85,382Architecture and engineering occupations
80,235Computer and mathematical occupations
64,839Community and social service occupations
59,008Management occupations
Companies with federal contracts located in this zip code:
INTERNATIONAL LOGISTICS GROUP (6365 TAFT STREET, SUITE 10 in HOLLYWOOD, FL; small business) : $3,325,565 in 63 contractsfrom 2000 to 2005
Contracts for Maintenance, Repair or Alteration of Real Property -- Office Buildings, Maintenance, Repair or Alteration of Real Property -- Other Non-Building Facilities, Maintenance, Repair or Alteration of Real Property -- Other Administrative Facilities and Service Buildings, Maintenance, Repair or Alteration of Real Property -- GOGO Environmental Laboratories, and moreby Air Force, National Park Service, Department of Veterans Affairs, U.S. Army Corps of Engineers - civil program financing only, and others Signed by year:2000: $730,658; 2001: $1,117,418; 2002: $1,343,496; 2003: $124,910; 2004: $14,256; 2005: -$5,173; 2006: $0.
Biggest contracts:
$429,914 with Air Force for Maintenance, Repair or Alteration of Real Property -- Office Buildings. Taking place in GA. Signed on 2000-09-20. Completion date: 2001-03-27.
$218,000 with National Park Service for Maintenance, Repair or Alteration of Real Property -- Other Non-Building Facilities. Signed on 2001-07-15. Completion date: 2002-06-15.
$172,431 with Air Force for Maintenance, Repair or Alteration of Real Property -- Other Administrative Facilities and Service Buildings. Taking place in NC. Signed on 2002-09-03. Completion date: 2003-03-05.
$144,791, same as above.Signed on 2002-09-28. Completion date: 2003-03-11.
PALM TREE AVIATION, INC (7850 NW 6TH ST UNIT 204 in PEMBROKE PINES, FL; small business) : $111,084 in 7 contractsfrom 2003 to 2005
Contracts for Airframe Structural Components, Brackets by Air Force Signed by year:2000: $0; 2001: $0; 2002: $0; 2003: $90,000; 2004: $4,750; 2005: $16,334; 2006: $0.
Biggest contracts:
$45,000 with Air Force for Airframe Structural Components. Signed on 2003-09-18. Completion date: 2003-10-03.
$45,000, same as above.Signed on 2003-09-03. Completion date: 2003-09-19.
$15,880, same as above.Signed on 2005-02-01. Completion date: 2005-02-15.
$4,750, same as above.Signed on 2004-10-18. Completion date: 2004-11-01.
TANGLEWOOD ENTERPRISES ASSOCIA (9860 PINES BLVD in PEMBROKE PINES, FL; small business) : $94,359 in 38 contractsfrom 2003 to 2005
Contracts for Other Social Services, Education Services, Operation of Government-Owned Facilities -- Other Educational Buildings, Recreation Site Maintenance Services (non-construction) by Army Signed by year:2000: $0; 2001: $0; 2002: $0; 2003: $9,610; 2004: $51,416; 2005: $33,333; 2006: $0.
Biggest contracts:
$5,594 with Army for Other Social Services. Signed on 2004-09-07. Completion date: 2004-08-27.
$5,577, same as above.Signed on 2005-01-06. Completion date: 2005-02-25.
$4,785, same as above.Signed on 2004-11-22. Completion date: 2004-11-05.
$4,606, same as above.Signed on 2004-06-25. Completion date: 2004-06-11.
ALL BUSINESS SYSTEMS INC (6363 TAFT ST in HOLLYWOOD, FL; small business) : $90,558 in 2 contractsin 2001
$56,322 with Navy for Electrical Hardware and Supplies. Signed on 2001-08-27. Completion date: 2001-09-14.
$34,236 with Navy for Miscellaneous Alarm, Signal and Security Detection Systems. Signed on 2001-10-18. Completion date: 2001-11-18.
Top industries in this zip code by the number of employees in 2005:
2002 - 2018 National Fire Incident Reporting System (NFIRS) incidents
According to the data from the years 2002 - 2018 the average number of fire incidents per year is 109. The highest number of reported fires - 183 took place in 2010, and the least - 72 in 2005. The data has a growing trend.
When looking into fire subcategories, the most reports belonged to: Structure Fires (34.1%), and Outside Fires (32.6%).
Fire incident types reported to NFIRS in Zip Code 33024


 Nearest zip codes: 33314, 33023, 33328, 33026, 33025, 33021.


 According to the data from the years 2002 - 2018 the average number of fire incidents per year is 109. The highest number of reported fires - 183 took place in 2010, and the least - 72 in 2005. The data has a growing trend.
 When looking into fire subcategories, the most reports belonged to: Structure Fires (34.1%), and Outside Fires (32.6%).