Estimated zip code population in 2022: 29,795 Zip code population in 2010: 21,885 Zip code population in 2000: 23,859
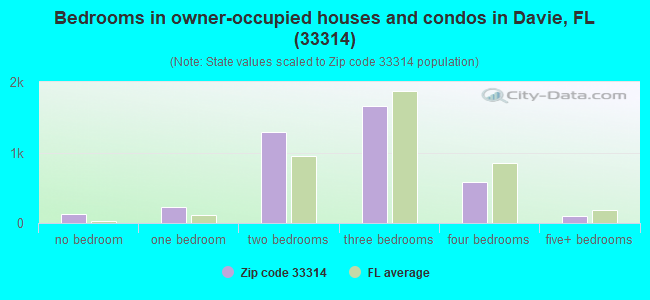
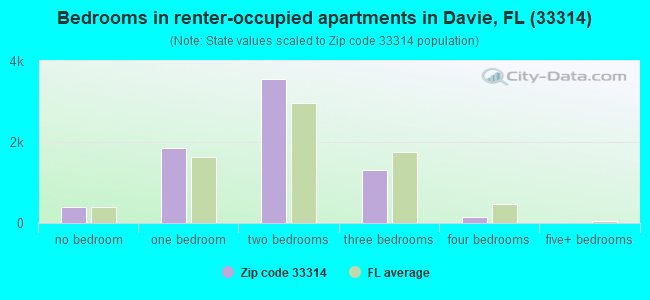
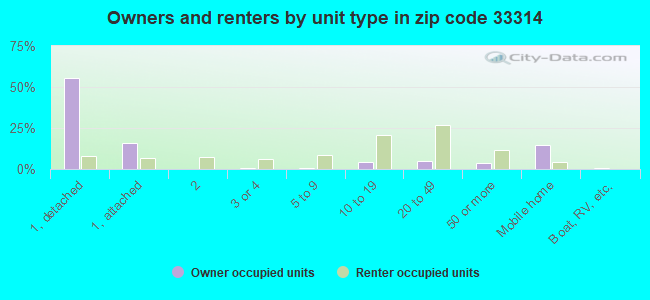
Houses and condos: 12,316 Renter-occupied apartments: 7,253
% of renters here:
65%
State:
33%
March 2022 cost of living index in zip code 33314: 109.7 (more than average, U.S. average is 100)
Land area: 8.3 sq. mi. Water area: 0.4 sq. mi.
Population density: 3,585 people per square mile
(average).
OSM Map
General Map
Google Map
MSN Map
OSM Map
General Map
Google Map
MSN Map
OSM Map
General Map
Google Map
MSN Map
OSM Map
General Map
Google Map
MSN Map
Please wait while loading the map...
Real estate property taxes paid for housing units in 2022:
This zip code:
0.8% ($2,612)
Florida:
0.7% ($2,529)
Median real estate property taxes paid for housing units with mortgages in 2022: $3,151 (0.7%) Median real estate property taxes paid for housing units with no mortgage in 2022: $1,811 (0.8%)
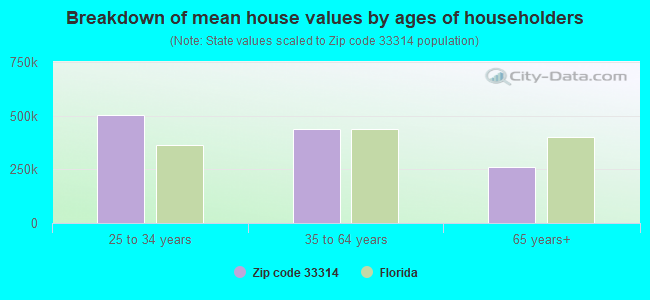
Estimated median house/condo value in 2022: $345,859
33314:
$345,859
Florida:
$354,100
According to our research of Florida and other state lists, there were 12 registered sex offenders living in 33314 zip code as of April 27, 2024. The ratio of all residents to sex offenders in zip code 33314 is 2,009 to 1. The ratio of registered sex offenders to all residents in this zip code is much lower than the state average.
Median resident age:
This zip code:
32.3 years
Florida median age:
42.7 years
Average household size:
This zip code:
2.5 people
Florida:
2.5 people
Averages for the 2020 tax year for zip code 33314, filed in 2021:
Average Adjusted Gross Income (AGI) in 2020: $51,522 (Individual Income Tax Returns)
Here:
$51,522
State:
$82,200
Salary/wage: $48,028 (reported on 82.3% of returns)
Here:
$48,028
State:
$58,347
(% of AGI for various income ranges: 1222.4% for AGIs below $25k, 3724.0% for AGIs $25k-50k, 7050.7% for AGIs $50k-75k, 9829.3% for AGIs $75k-100k, 18305.2% for AGIs $100k-200k, 93913.0% for AGIs over 200k)
Taxable interest for individuals: $2,322 (reported on 13.5% of returns)
This zip code:
$2,322
Florida:
$4,272
(% of AGI for various income ranges: 5.5% for AGIs below $25k, 6.4% for AGIs $25k-50k, 16.5% for AGIs $50k-75k, 41.6% for AGIs $75k-100k, 98.9% for AGIs $100k-200k, 2716.0% for AGIs over 200k)
Ordinary dividends: $4,671 (reported on 9.7% of returns)
Here:
$4,671
State:
$15,863
(% of AGI for various income ranges: 7.7% for AGIs below $25k, 19.8% for AGIs $25k-50k, 33.7% for AGIs $50k-75k, 95.7% for AGIs $75k-100k, 204.9% for AGIs $100k-200k, 2881.0% for AGIs over 200k)
Net capital gain/loss in AGI: +$16,746 (reported on 10.7% of returns)
Here:
+$16,746
State:
+$62,983
(% of AGI for various income ranges: 4.6% for AGIs below $25k, 16.9% for AGIs $25k-50k, 71.2% for AGIs $50k-75k, 90.9% for AGIs $75k-100k, 507.7% for AGIs $100k-200k, 19025.0% for AGIs over 200k)
Profit/loss from business: +$5,171 (reported on 30.4% of returns)
Here:
+$5,171
State:
+$9,719
(% of AGI for various income ranges: 233.9% for AGIs below $25k, 109.2% for AGIs $25k-50k, 122.5% for AGIs $50k-75k, 183.0% for AGIs $75k-100k, 240.8% for AGIs $100k-200k, 3573.0% for AGIs over 200k)
Taxable individual retirement arrangement distribution: $15,424 (reported on 2.8% of returns)
33314:
$15,424
Florida:
$24,823
(% of AGI for various income ranges: 13.9% for AGIs below $25k, 24.0% for AGIs $25k-50k, 53.0% for AGIs $50k-75k, 76.5% for AGIs $75k-100k, 307.9% for AGIs $100k-200k, 1374.0% for AGIs over 200k)
Total itemized deductions: $30,779 (reported on 5.3% of returns)
Here:
$30,779
State:
$45,393
(% of AGI for various income ranges: 16.8% for AGIs below $25k, 104.7% for AGIs $25k-50k, 278.4% for AGIs $50k-75k, 462.0% for AGIs $75k-100k, 920.3% for AGIs $100k-200k, 5527.0% for AGIs over 200k)
Charity contributions: $7,191 (reported on 4.2% of returns)
Here:
$7,191
State:
$20,178
(% of AGI for various income ranges: 18.6% for AGIs $25k-50k, 45.2% for AGIs $50k-75k, 82.9% for AGIs $75k-100k, 168.4% for AGIs $100k-200k, 1294.0% for AGIs over 200k)
Taxes paid: $6,793 (reported on 5.1% of returns)
33314:
$6,793
State:
$6,967
(% of AGI for various income ranges: 3.1% for AGIs below $25k, 20.8% for AGIs $25k-50k, 66.2% for AGIs $50k-75k, 107.8% for AGIs $75k-100k, 204.9% for AGIs $100k-200k, 1067.0% for AGIs over 200k)
Earned income credit: $2,239 (reported on 25.8% of returns)
Here:
$2,239
State:
$2,306
(% of AGI for various income ranges: 129.7% for AGIs below $25k, 72.6% for AGIs $25k-50k)
Percentage of individuals using paid preparers for their 2020 taxes: 91.4%
Here:
91%
State:
92%
(% for various income ranges: 89.5% for AGIs below $25k, 93.0% for AGIs $25k-50k, 93.3% for AGIs $50k-75k, 91.4% for AGIs $75k-100k, 91.3% for AGIs $100k-200k, 93.8% for AGIs over 200k)
Averages for the 2012 tax year for zip code 33314, filed in 2013:
Average Adjusted Gross Income (AGI) in 2012: $39,411 (Individual Income Tax Returns)
Here:
$39,411
State:
$60,316
Salary/wage: $34,780 (reported on 85.8% of returns)
Here:
$34,780
State:
$45,277
(% of AGI for various income ranges: 81.0% for AGIs below $25k, 89.4% for AGIs $25k-50k, 86.8% for AGIs $50k-75k, 85.6% for AGIs $75k-100k, 80.5% for AGIs $100k-200k, 33.2% for AGIs over 200k)
Taxable interest for individuals: $2,114 (reported on 14.5% of returns)
This zip code:
$2,114
Florida:
$3,587
(% of AGI for various income ranges: 0.7% for AGIs below $25k, 0.4% for AGIs $25k-50k, 0.3% for AGIs $50k-75k, 0.2% for AGIs $75k-100k, 0.5% for AGIs $100k-200k, 2.4% for AGIs over 200k)
Ordinary dividends: $6,112 (reported on 9.0% of returns)
Here:
$6,112
State:
$12,831
(% of AGI for various income ranges: 1.1% for AGIs below $25k, 0.7% for AGIs $25k-50k, 0.9% for AGIs $50k-75k, 0.9% for AGIs $75k-100k, 1.2% for AGIs $100k-200k, 3.5% for AGIs over 200k)
Net capital gain/loss in AGI: +$6,211 (reported on 6.7% of returns)
Here:
+$6,211
State:
+$33,493
(% of AGI for various income ranges: 0.3% for AGIs $50k-75k, 0.3% for AGIs $75k-100k, 1.3% for AGIs $100k-200k, 4.4% for AGIs over 200k)
Profit/loss from business: +$6,605 (reported on 20.4% of returns)
Here:
+$6,605
State:
+$10,012
(% of AGI for various income ranges: 11.8% for AGIs below $25k, 2.4% for AGIs $25k-50k, 1.6% for AGIs $50k-75k, 0.9% for AGIs $75k-100k, 2.1% for AGIs $100k-200k, 1.1% for AGIs over 200k)
Taxable individual retirement arrangement distribution: $11,813 (reported on 3.5% of returns)
33314:
$11,813
Florida:
$21,544
(% of AGI for various income ranges: 0.8% for AGIs below $25k, 1.0% for AGIs $25k-50k, 1.3% for AGIs $50k-75k, 1.5% for AGIs $75k-100k, 2.1% for AGIs $100k-200k)
Total itemized deductions: $18,768 (24% of AGI, reported on 18.3% of returns)
Here:
$18,768
State:
$25,533
Here:
23.6% of AGI
State:
18.0% of AGI
(% of AGI for various income ranges: 5.4% for AGIs below $25k, 9.6% for AGIs $25k-50k, 11.8% for AGIs $50k-75k, 10.4% for AGIs $75k-100k, 11.6% for AGIs $100k-200k, 4.5% for AGIs over 200k)
Charity contributions: $3,167 (reported on 14.2% of returns)
Here:
$3,167
State:
$5,698
(% of AGI for various income ranges: 0.4% for AGIs below $25k, 1.1% for AGIs $25k-50k, 1.5% for AGIs $50k-75k, 1.2% for AGIs $75k-100k, 1.7% for AGIs $100k-200k, 1.2% for AGIs over 200k)
Taxes paid: $3,607 (reported on 17.3% of returns)
33314:
$3,607
State:
$6,203
(% of AGI for various income ranges: 0.7% for AGIs below $25k, 1.3% for AGIs $25k-50k, 2.0% for AGIs $50k-75k, 1.8% for AGIs $75k-100k, 2.6% for AGIs $100k-200k, 1.5% for AGIs over 200k)
Earned income credit: $2,378 (reported on 29.4% of returns)
Here:
$2,378
State:
$2,372
(% of AGI for various income ranges: 9.0% for AGIs below $25k, 1.1% for AGIs $25k-50k)
Percentage of individuals using paid preparers for their 2012 taxes: 61.1%
Here:
61%
State:
54%
(% for various income ranges: 60.4% for AGIs below $25k, 60.0% for AGIs $25k-50k, 61.3% for AGIs $50k-75k, 60.0% for AGIs $75k-100k, 71.4% for AGIs $100k-200k, 81.8% for AGIs over 200k)
Averages for the 2004 tax year for zip code 33314, filed in 2005:
Average Adjusted Gross Income (AGI) in 2004: $32,685 (Individual Income Tax Returns)
Here:
$32,685
State:
$50,523
Salary/wage: $30,762 (reported on 88.9% of returns)
Here:
$30,762
State:
$39,563
(% of AGI for various income ranges: 114.5% for AGIs below $10k, 86.7% for AGIs $10k-25k, 92.1% for AGIs $25k-50k, 88.2% for AGIs $50k-75k, 86.5% for AGIs $75k-100k, 59.0% for AGIs over 100k)
Taxable interest for individuals: $1,757 (reported on 23.5% of returns)
This zip code:
$1,757
Florida:
$3,211
(% of AGI for various income ranges: 3.7% for AGIs below $10k, 0.7% for AGIs $10k-25k, 0.5% for AGIs $25k-50k, 0.7% for AGIs $50k-75k, 1.0% for AGIs $75k-100k, 3.1% for AGIs over 100k)
Taxable dividends: $2,554 (reported on 10.6% of returns)
Here:
$2,554
State:
$6,129
(% of AGI for various income ranges: 2.1% for AGIs below $10k, 0.4% for AGIs $10k-25k, 0.3% for AGIs $25k-50k, 0.5% for AGIs $50k-75k, 0.5% for AGIs $75k-100k, 2.4% for AGIs over 100k)
Net capital gain/loss: +$10,805 (reported on 8.8% of returns)
Here:
+$10,805
State:
+$27,205
(% of AGI for various income ranges: -1.0% for AGIs below $10k, 0.1% for AGIs $10k-25k, 0.4% for AGIs $25k-50k, 0.4% for AGIs $50k-75k, 1.5% for AGIs $75k-100k, 12.4% for AGIs over 100k)
Profit/loss from business: +$6,374 (reported on 15.3% of returns)
Here:
+$6,374
State:
+$10,634
(% of AGI for various income ranges: 14.8% for AGIs below $10k, 6.8% for AGIs $10k-25k, 1.6% for AGIs $25k-50k, 1.8% for AGIs $50k-75k, 1.3% for AGIs $75k-100k, 2.4% for AGIs over 100k)
IRA payment deduction: $2,622 (reported on 2.2% of returns)
33314:
$2,622
Florida:
$3,082
(% of AGI for various income ranges: 0.4% for AGIs below $10k, 0.2% for AGIs $10k-25k, 0.2% for AGIs $25k-50k, 0.2% for AGIs $50k-75k, 0.1% for AGIs $75k-100k, 0.1% for AGIs over 100k)
Total itemized deductions: $15,735 (25% of AGI, reported on 23.0% of returns)
Here:
$15,735
State:
$20,370
Here:
25.2% of AGI
State:
20.7% of AGI
(% of AGI for various income ranges: 11.1% for AGIs below $10k, 7.0% for AGIs $10k-25k, 11.6% for AGIs $25k-50k, 13.5% for AGIs $50k-75k, 12.8% for AGIs $75k-100k, 10.4% for AGIs over 100k)
Charity contributions deductions: $2,414 (4% of AGI, reported on 19.1% of returns)
Here:
$2,414
State:
$4,064
Here:
3.7% of AGI
State:
3.8% of AGI
(% of AGI for various income ranges: 0.5% for AGIs below $10k, 0.5% for AGIs $10k-25k, 1.2% for AGIs $25k-50k, 1.6% for AGIs $50k-75k, 1.4% for AGIs $75k-100k, 2.3% for AGIs over 100k)
Total tax: $4,522 (reported on 69.9% of returns)
33314:
$4,522
State:
$9,431
(% of AGI for various income ranges: 4.6% for AGIs below $10k, 3.9% for AGIs $10k-25k, 6.7% for AGIs $25k-50k, 9.3% for AGIs $50k-75k, 11.0% for AGIs $75k-100k, 19.1% for AGIs over 100k)
Earned income credit: $1,792 (reported on 24.6% of returns)
Here:
$1,792
State:
$1,808
Percentage of individuals using paid preparers for their 2004 taxes: 60.0%
Here:
60%
State:
60%
(% for various income ranges: 56.8% for AGIs below $10k, 61.5% for AGIs $10k-25k, 57.8% for AGIs $25k-50k, 62.7% for AGIs $50k-75k, 63.2% for AGIs $75k-100k, 72.7% for AGIs over 100k)
Likely homosexual households (counted as self-reported same-sex unmarried-partner households)
Lesbian couples: 0.1% of all households
Gay men: 0.3% of all households
Household received Food Stamps/SNAP in the past 12 months: 1,899 Household did not receive Food Stamps/SNAP in the past 12 months: 9,358
Women who had a birth in the past 12 months: 376 (271 now married, 108 unmarried) Women who did not have a birth in the past 12 months: 8,241 (2,011 now married, 6,225 unmarried)
Housing units in zip code 33314 with a mortgage: 2,341 (166 second mortgage, 154 both second mortgage and home equity loan) Median monthly owner costs for units with a mortgage: $1,989 Median monthly owner costs for units without a mortgage: $634
Residents with income below the poverty level in 2022:
This zip code:
19.3%
Whole state:
12.7%
Residents with income below 50% of the poverty level in 2022:
This zip code:
8.3%
Whole state:
6.6%
Median number of rooms in houses and condos:
Here:
5.1
State:
5.9
Median number of rooms in apartments:
Here:
3.9
State:
4.2
Notable locations in this zip code not listed on our city pages
Notable locations in zip code 33314: Nova Plaza (A), Stirling Road Library (B), Davie Fire Rescue Station 38 (C), Davie Fire Rescue Station 104 (D), Palma Nova Community Center (E), Ah Tha Thi Ki Museum of Seminole History and Culture (F). Display/hide their locations on the map
Churches in zip code 33314 include: River Grove Church of Christ (A), Saint Philips Eastern Orthodox Parish (B), Dania Heights Church (C). Display/hide their locations on the map
3,143 married couples with children.
2,178 single-parent households (671 men, 1,507 women).
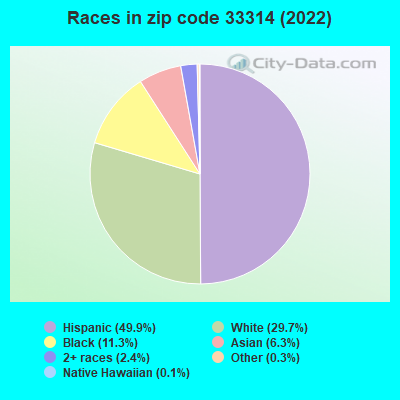
43.8% of residents of 33314 zip code speak English at home.
43.5% of residents speak Spanish at home (55% very well, 18% well, 17% not well, 10% not at all).
6.9% of residents speak other Indo-European language at home (56% very well, 37% well, 7% not well).
3.8% of residents speak Asian or Pacific Island language at home (53% very well, 30% well, 15% not well, 2% not at all).
2.0% of residents speak other language at home (95% very well, 5% well).
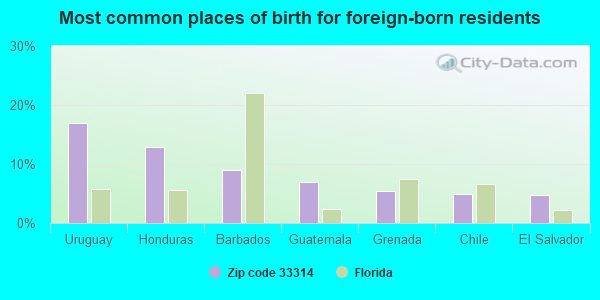
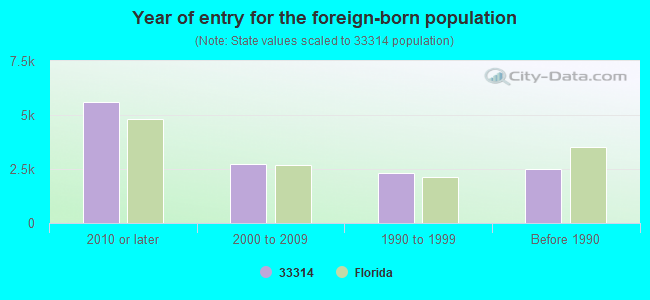
Foreign born population: 11,531 (38.7%) (47.7% of them are naturalized citizens)
Major facilities with environmental interests located in this zip code:
ANDRX PHARMACEUTICALS (4001 SOUTH WEST 47TH AVENUE SUITE 201 in FORT LAUDERDALE, FL)
AIR SYNTHETIC MINOR (AIRS/AFS) STATE MASTER (FDM) - CHAZ-FL0000382499, HAZARDOUS WASTE REGULATION PROGRAM CRITERIA AND HAZARDOUS AIR POLLUTANT INVENTORY (Inventory of air pollution sources) National Pollutant Discharge Elimination System NON-MAJOR (Tracking pollutant discharge elimination systems) - permit HAZARDOUS WASTE BIENNIAL REPORTER (Resource Conservation and Recovery Act (tracking hazardous waste)) Large Quantity Generators, more that 1000 kg of hazardous waste/month (Resource Conservation and Recovery Act (tracking hazardous waste)) - notification Business SIC classification: PHARMACEUTICAL PREPARATIONS Organizations: ANDRX PHARMACEUTICALS INC, ANDRX PHARMACEUTICALS, INC. (CONTACT/OPERATOR)
, ANDRX CORPORATION (CONTACT/OWNER)
, ROBERT GOLDFARB (CONTACT/OWNER)
, ANDRX PHARMACEUTICALS INC (CONTACT/OWNER)
Alternative names: ANDA SR PHARMACEUTICALS INC, ANDA SR PHARMACEUTICALS INC, ANDRX PHARMACEUTICALS INC
DAVIE - REDDY PLANT # 341 (5050 SW 51ST STREET in DAVIE, FL)
(Integrated Compliance Information System) - ICIS-04-2005-9151, ENFORCEMENT/COMPLIANCE ACTIVITY FORMAL ENFORCEMENT ACTION (Integrated Compliance Information System) - ICIS-04-2005-9151, ENFORCEMENT/COMPLIANCE ACTIVITY COMPLIANCE ACTIVITY (Tracking inspections of insecticide, fungicide, and rodenticide, and toxic substances) National Pollutant Discharge Elimination System NON-MAJOR (Tracking pollutant discharge elimination systems) - permit TRI REPORTER (Tracking of toxic chemicals releasing facilities) Business SIC classification: MANUFACTURED ICE Organizations: JAMES MCNUTT (CONTACT/OWNER)
Alternative names: REDDY ICE, REDDY ICE--DAVIE PLANT, REDDY ICE PLANT
DAVIE CONCRETE (3570 SW 49TH WAY in DAVIE, FL)
STATE MASTER (FDM) - WAFR-FLG110348, INDUSTRIAL WASTEWATER PROGRAM National Pollutant Discharge Elimination System NON-MAJOR (Tracking pollutant discharge elimination systems) - permit Business SIC classification: READY-MIXED CONCRETE Organizations: MUNSON DESIGN AND CONSULTING, INC., DAVIE CONCRETE CORPORATION, TOWN OF DAVIE/DEVELOPMENT SERVICES DEPT., RESOURCE MANAGEMENT ASSOCIATES, INC. (CONTACT/ AGENT)
, MUNSON DESIGN AND CONSULTING, INC. (CONTACT/AGENT)
, DAVIE CONCRETE CORPORATION (CONTACT/APPLICANT)
, MUNSON DESIGN AND CONSULTING, INC. (ENGINEER)
Alternative names: DAVIE CONCRETE - DAVIE PLANT
ANDRX PHARMACEUTICALS (4955 ORANGE DRIVE in FORT LAUDERDALE, FL)
AIR SYNTHETIC MINOR (AIRS/AFS) CRITERIA AND HAZARDOUS AIR POLLUTANT INVENTORY (Inventory of air pollution sources) National Pollutant Discharge Elimination System NON-MAJOR (Tracking pollutant discharge elimination systems) - permit HAZARDOUS WASTE BIENNIAL REPORTER (Resource Conservation and Recovery Act (tracking hazardous waste)) Large Quantity Generators, more that 1000 kg of hazardous waste/month (Resource Conservation and Recovery Act (tracking hazardous waste)) Business SIC classification: PHARMACEUTICAL PREPARATIONS Organizations: ANDRX PHARMACEUTICALS INC (CONTACT/OWNER)
, ROBERT GOLDFARB (CONTACT/OWNER)
Alternative names: ANDRX PHARMACEUTICALS INC, HANSON PIPE & PRODUCTS
HESCO SALES (3400 BURRIS RD in FORT LAUDERDALE, FL)
STATE MASTER (FDM) - CHAZ-FL0000703702, HAZARDOUS WASTE REGULATION PROGRAM (Resource Conservation and Recovery Act (tracking hazardous waste)) Business SIC classification: FABRICATED METAL PRODUCTS Business NAICS classification: ALL OTHER MISCELLANEOUS FABRICATED METAL PRODUCT MANUFACTURING. Organizations: CHARLES TRAFICANT, VP (CONTACT/OWNER)
Alternative names: TESCO HI LIFT
PARK SERVICE GARAGE INC (5510 S STATE RD 7 in FT LAUDERDALE, FL)
AIR MINOR (AIRS/AFS) (Integrated Compliance Information System) - ICIS-04-1999-0385, FORMAL ENFORCEMENT ACTION Business SIC classification: GENERAL AUTOMOTIVE REPAIR SHOPS
DAVIE ELEMENTARY SCHOOL (7025 SW 39TH ST in DAVIE, FL)
(Geographic Names Information System) (National Center for Education Statistics) - STATE ID-2801 Organizations: BROWARD COUNTY SCHOOL DISTRICT (SCHOOL DISTRICT)
MCKENZIE TANK LINES INC (4400 SW 36TH STREET in DAVIE, FL)
National Pollutant Discharge Elimination System NON-MAJOR (Tracking pollutant discharge elimination systems) - permit (Resource Conservation and Recovery Act (tracking hazardous waste)) Business SIC classification: TRUCKING, EXCEPT LOCAL Business NAICS classification: ALL OTHER AUTOMOTIVE REPAIR AND MAINTENANCE. Organizations: JOSEPH WIER (CONTACT/OWNER)
NOVA DWIGHT D. EISENHOWER ELEMENTARY SCHOOL (6501 S.W. 39TH STREET in DAVIE, FL)
(National Center for Education Statistics) - STATE ID-1271 Organizations: BROWARD COUNTY SCHOOL DISTRICT (SCHOOL DISTRICT)
DAVIE LANDFILL (SW 142ND AVE in DAVIE, FL)
SUPERFUND NPL (Superfund database) (Integrated Compliance Information System) - ICIS-04-1996-0214, FORMAL ENFORCEMENT ACTION Alternative names: BROWARD CO SOLID WASTE DSPL FACILITY, BROWARD COUNTY SOLID WASTE DSPL FACILITY
NOVA BLANCHE FORMAN ELEMENTARY SCHOOL (3521 SW DAVIE ROAD in DAVIE, FL)
(National Center for Education Statistics) - STATE ID-1282 Organizations: BROWARD COUNTY SCHOOL DISTRICT (SCHOOL DISTRICT)
AIGTC INC (3931 SW 47TH AVE BAY 102 in DAVIE, FL)
AIR MINOR (AIRS/AFS) (Resource Conservation and Recovery Act (tracking hazardous waste)) Business SIC classification: DRYCLEANING PLANTS, EXCEPT RUG CLEANING Organizations: EDUARDO STIGOL (CONTACT/OWNER)
Alternative names: CIT COPANIA INTERNACIONAL INC, CIT COPANIA INTERNACIONAL INC, PROFESSIONAL CLEANERS INC, PROFESSIONAL CLEANERS INC
SEAMASTER YACHTS (4600 S. W. 44TH AVE in FORT LAUDERDALE, FL)
(Integrated Compliance Information System) - ICIS-04-1998-0225, FORMAL ENFORCEMENT ACTION Business SIC classification: BOAT BUILDING AND REPAIRING
Housing units lacking complete plumbing facilities: 0.2% Housing units lacking complete kitchen facilities: 0.6%
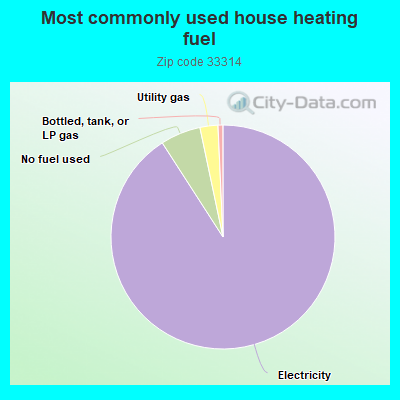
90.8%Electricity
5.8%No fuel used
2.6%Utility gas
0.7%Bottled, tank, or LP gas
Population in 1990: 19,621. Population change in the 1990s: +4,238 (+21.6%).
Place of birth for U.S.-born residents:
This state: 10,262
Northeast: 4,068
Midwest: 1,079
South: 960
West: 600
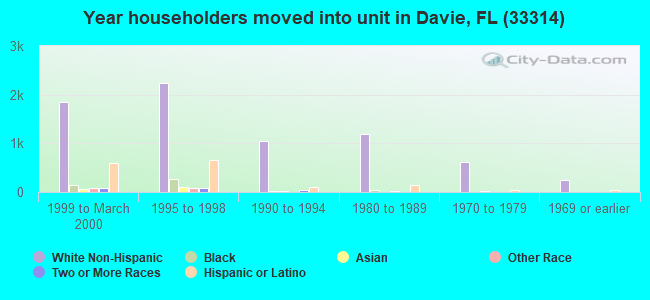
47% of the 33314 zip code residents lived in the same house 5 years ago. Out of people who lived in different houses, 62% lived in this county. Out of people who lived in different counties, 50% lived in Florida.
84% of the 33314 zip code residents lived in the same house 1 year ago. Out of people who lived in different houses, 62% moved from this county. Out of people who lived in different houses, 12% moved from different county within same state. Out of people who lived in different houses, 13% moved from different state. Out of people who lived in different houses, 6% moved from abroad.
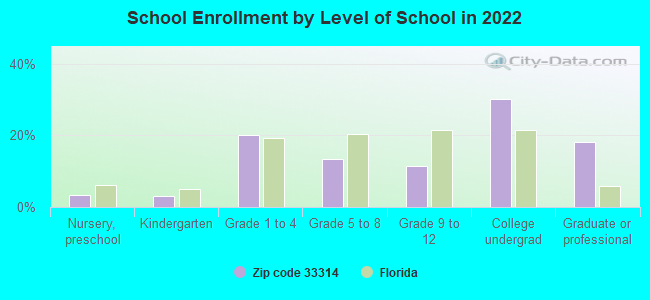
Private vs. public school enrollment:
Students in private schools in grades 1 to 8 (elementary and middle school): 277
Here:
9.6%
Florida:
15.8%
Students in private schools in grades 9 to 12 (high school): 158
Here:
15.9%
Florida:
12.9%
Students in private undergraduate colleges: 1,771
Here:
65.1%
Florida:
23.6%
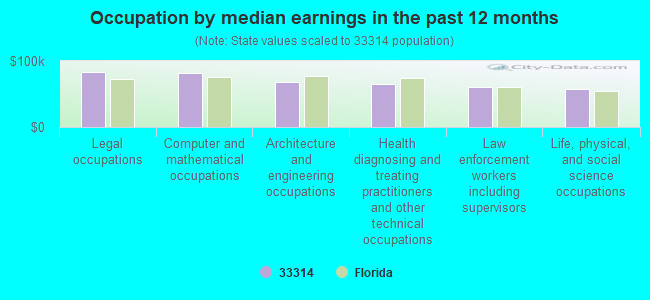
Occupation by median earnings in the past 12 months ($)
83,529Legal occupations
82,031Computer and mathematical occupations
67,879Architecture and engineering occupations
64,402Health diagnosing and treating practitioners and other technical occupations
59,863Law enforcement workers including supervisors
57,671Life, physical, and social science occupations
Companies with biggest federal contracts located in this zip code:
A I G AVIATION INC (6521 ORANGE DRIVE in DAVIE, FL) : $1,925,503 in 4 contractsfrom 2003 to 2005
$935,000 with U.S. Army Corps of Engineers - civil program financing only for Construction of Structures and Facilities -- Dredging. Taking place in NY. Signed on 2003-07-03. Completion date: 2001-04-19.
$762,695 with Army for Construction of Structures and Facilities -- Dredging. Taking place in NY. Signed on 2004-02-04. Completion date: 2004-12-31.
$260,870 with U.S. Army Corps of Engineers - civil program financing only for Construction of Structures and Facilities -- Dredging. Taking place in NY. Signed on 2003-07-01. Completion date: 2001-04-19.
-$33,062, same as above.Signed on 2005-09-19. Completion date: 2004-12-31.
COMPUTER PROJECTION SYSTEMS (SUITE 503 in FORT LAUDERDAL, FL; small business) : $562,553 in 11 contractsfrom 1999 to 2001
Contracts for Photographic Projection Equipment, ADP Components, Video Recording and Reproducing Equipment by Navy Signed by year:2000: $327,318; 2001: $28,692; 2002: $0; 2003: $0; 2004: $0; 2005: $0; 2006: $0.
Biggest contracts:
$118,402 with Navy for Photographic Projection Equipment. Signed on 1999-11-01. Completion date: 1999-11-15.
$88,141, same as above.Signed on 1999-11-23. Completion date: 1999-12-23.
$57,500, same as above.Signed on 2000-07-06. Completion date: 2000-08-05.
$47,040, same as above.Signed on 2000-09-29. Completion date: 2000-10-30.
BROWN BROTHERS USA INC (4350 OAKES ROAD, SUITE 528 in DAVIE, FL; small business) : $386,193 in 3 contractsin 2000
$230,448 with Navy for Ship and Boat Propulsion Components. Signed on 2000-10-20. Completion date: 2001-01-08.
$130,695 with Navy for Bearings, Plain, Unmounted. Signed on 2000-10-18. Completion date: 2001-02-16.
$25,050 with Navy for Ship and Boat Propulsion Components. Signed on 2000-12-11. Completion date: 2001-04-18.
PALMA NOVA (3020 SW 61ST AVENUE in DAVIE, FL; small business) : $240,632 in 5 contractsfrom 2005 to 2006
Contracts for Lease or Rental of Facilities -- Parking Facilities Conservation, Lease or Rental of Facilities -- Other Non-Building Facilities by Federal Emergency Management Agency Signed by year:2000: $0; 2001: $0; 2002: $0; 2003: $0; 2004: $0; 2005: $221,900; 2006: $18,732.
Biggest contracts:
$221,900 with Federal Emergency Management Agency for Lease or Rental of Facilities -- Parking Facilities Conservation. Signed on 2005-12-30. Effective on 2005-11-14. Completion date: 2006-09-30.
$26,460 with Federal Emergency Management Agency for Lease or Rental of Facilities -- Other Non-Building Facilities. Signed on 2006-09-22. Effective on 2006-10-01. Completion date: 2006-12-31.
$0 with Federal Emergency Management Agency for Lease or Rental of Facilities -- Parking Facilities Conservation. Signed on 2006-03-01. Effective on 2005-11-13. Completion date: 2006-09-30.
-$1,092, same as above.Signed on 2006-09-09. Effective on 2006-09-28. Completion date: 2006-09-30.
TOTAL MARINE SOLUTIONS INC (4350 OAKES RD STE 502 in FORT LAUDERDAL, FL; small business) : $121,254 in 2 contractsin 2006
$99,320 with Navy for Technical Assistance. Taking place in VA. Signed on 2006-01-25. Completion date: 2006-09-30.
$21,934 with Navy for Non-nuclear Ship Repair (West) Ship repair (including overhauls and conversions) performed on. non-nuclear propelled and nonpropelled ships west of the 108th meridian. Signed on 2006-06-15. Completion date: 2006-08-09.
ROLLS-ROYCE COMMERCIAL MARINE (4350 OAKES RD STE 528 in FORT LAUDERDAL, FL)
$39,111 with Defense Logistics Agency for Bearings, Plain, Unmounted. Signed on 2004-05-28. Completion date: 2004-11-12.
SKYHIGH ACCESSORIES INC (4960 SW 52ND ST STE 426 in FORT LAUDERDAL, FL) : $35,950 in 3 contractsin 2006
$20,900 with Air Force for Aircraft Air Conditioning, Heating, and Pressurizing Equipment. Signed on 2006-06-29. Completion date: 2006-07-14.
$9,000, same as above.Signed on 2006-06-15. Completion date: 2006-06-29.
$6,050 with Air Force for O-Ring. Signed on 2006-04-26. Completion date: 2006-05-11.
NALFLEET INC (4350 OAKES RD STE 502 in FORT LAUDERDAL, FL) : $26,538 in 4 contractsfrom 2004 to 2005
$7,748 with U.S. Army Corps of Engineers - civil program financing only for Chemicals. Taking place in PA. Signed on 2005-06-21. Completion date: 2005-06-30.
$7,748 with Army for Chemicals. Taking place in PA. Signed on 2005-06-21. Completion date: 2005-06-30.
$5,521, same as above.Signed on 2004-09-08. Completion date: 2004-08-09.
$5,521 with U.S. Army Corps of Engineers - civil program financing only for Chemicals. Taking place in PA. Signed on 2004-09-08. Completion date: 2004-08-09.
SCALEMEN OF FLORIDA INC (3650HACIENDA BOULEVARD SUI in DAVIE, FL; small business) : $14,823 in 2 contractsfrom 2001 to 2003
$9,894 with Air Force for Maintenance, Repair or Alteration of Real Property -- Miscellaneous Buildings. Signed on 2003-06-12. Completion date: 2003-06-30.
$4,929, same as above.Signed on 2001-01-29. Completion date: 2001-01-29.
ALPHATRON INDUSTRIES INCORPORA (3411 SW 49TH WAY STE 3 in FORT LAUDERDAL, FL; small business)
$7,205 with Army for Physical Properties Testing and Inspection. Signed on 2005-12-06. Completion date: 2005-12-30.
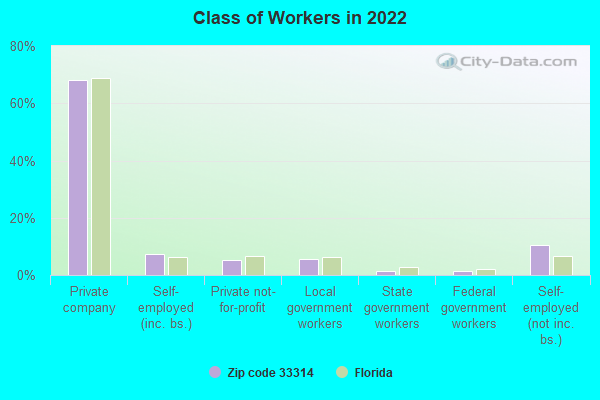
Top industries in this zip code by the number of employees in 2005:
Finance and Insurance: Direct Property and Casualty Insurance Carriers (over 1000 employees: 1 establishment, 50-99 employees: 1 establishment, 5-9 employees: 1 establishment)
Accommodation and Food Services: Casino Hotels (over 1000: 1)
Educational Services: Colleges, Universities, and Professional Schools (over 1000: 1)
Construction: Commercial and Institutional Building Construction (500-999: 1, 250-499: 1, 100-249: 1, 20-49: 2, 5-9: 2, 1-4: 3)
2002 - 2018 National Fire Incident Reporting System (NFIRS) incidents
Based on the data from the years 2002 - 2018 the average number of fire incidents per year is 112. The highest number of reported fire incidents - 195 took place in 2009, and the least - 6 in 2003. The data has an increasing trend.
When looking into fire subcategories, the most reports belonged to: Mobile Property/Vehicle Fires (31.6%), and Outside Fires (30.9%).
Fire incident types reported to NFIRS in Zip Code 33314


 Nearest zip codes: 33317, 33312, 33024, 33328, 33021, 33324.


 Based on the data from the years 2002 - 2018 the average number of fire incidents per year is 112. The highest number of reported fire incidents - 195 took place in 2009, and the least - 6 in 2003. The data has an increasing trend.
 When looking into fire subcategories, the most reports belonged to: Mobile Property/Vehicle Fires (31.6%), and Outside Fires (30.9%).