Estimated zip code population in 2022: 58,944 Zip code population in 2010: 34,088 Zip code population in 2000: 20,716
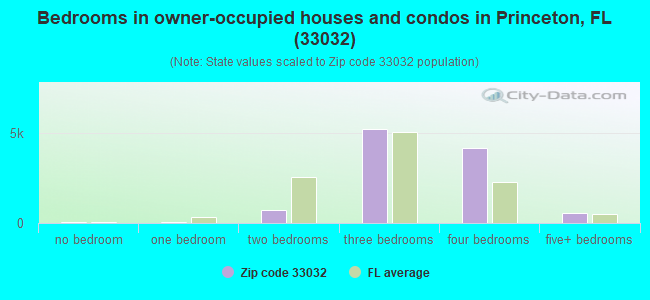
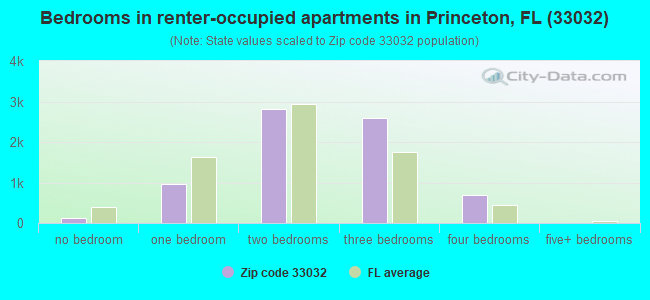
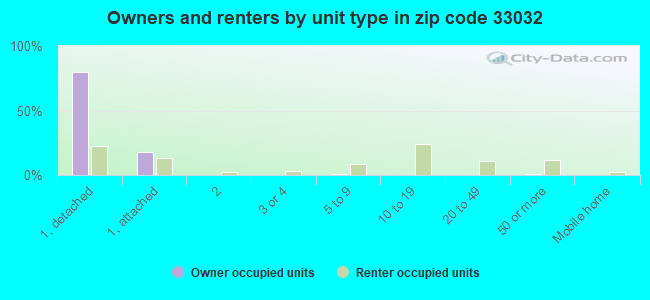
Houses and condos: 18,419 Renter-occupied apartments: 7,262
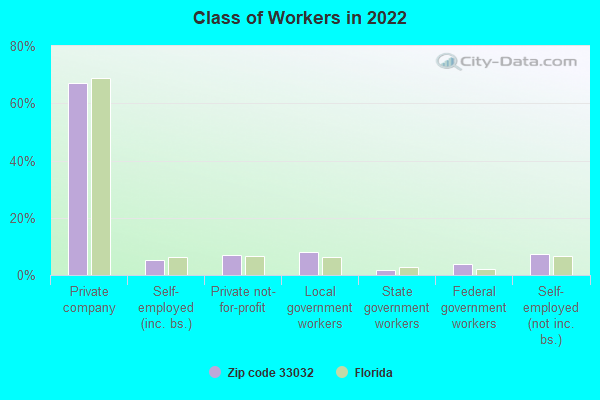
% of renters here:
40%
State:
33%
March 2022 cost of living index in zip code 33032: 103.6 (near average, U.S. average is 100)
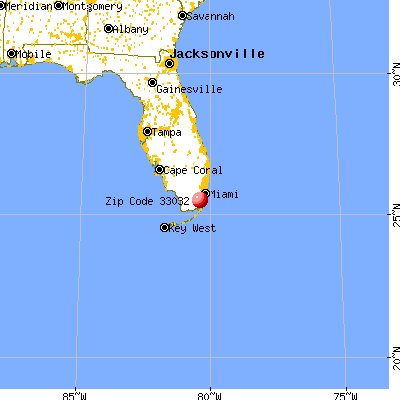
Land area: 18.8 sq. mi. Water area: 0.9 sq. mi.
Population density: 3,135 people per square mile
(average).
OSM Map
General Map
Google Map
MSN Map
OSM Map
General Map
Google Map
MSN Map
OSM Map
General Map
Google Map
MSN Map
OSM Map
General Map
Google Map
MSN Map
Please wait while loading the map...
Real estate property taxes paid for housing units in 2022:
This zip code:
0.8% ($3,446)
Florida:
0.7% ($2,529)
Median real estate property taxes paid for housing units with mortgages in 2022: $3,552 (0.9%) Median real estate property taxes paid for housing units with no mortgage in 2022: $3,020 (0.8%)
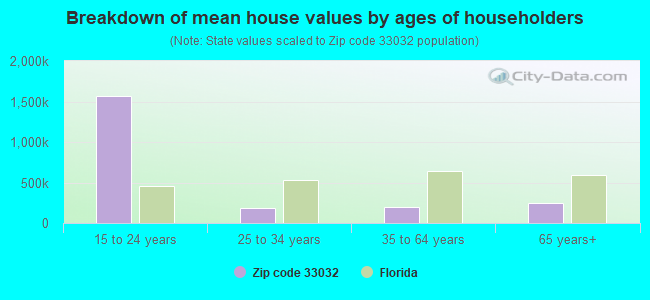
Estimated median house/condo value in 2022: $412,026
33032:
$412,026
Florida:
$354,100
According to our research of Florida and other state lists, there were 58 registered sex offenders living in 33032 zip code as of April 27, 2024. The ratio of all residents to sex offenders in zip code 33032 is 757 to 1. The ratio of registered sex offenders to all residents in this zip code is lower than the state average.
Median resident age:
This zip code:
33.7 years
Florida median age:
42.7 years
Average household size:
This zip code:
3.3 people
Florida:
2.5 people
Averages for the 2020 tax year for zip code 33032, filed in 2021:
Average Adjusted Gross Income (AGI) in 2020: $40,570 (Individual Income Tax Returns)
Here:
$40,570
State:
$82,200
Salary/wage: $41,012 (reported on 82.0% of returns)
Here:
$41,012
State:
$58,347
(% of AGI for various income ranges: 1226.1% for AGIs below $25k, 3760.6% for AGIs $25k-50k, 7048.7% for AGIs $50k-75k, 10258.8% for AGIs $75k-100k, 16921.4% for AGIs $100k-200k, 52348.6% for AGIs over 200k)
Taxable interest for individuals: $485 (reported on 8.3% of returns)
This zip code:
$485
Florida:
$4,272
(% of AGI for various income ranges: 1.8% for AGIs below $25k, 2.2% for AGIs $25k-50k, 5.0% for AGIs $50k-75k, 9.5% for AGIs $75k-100k, 22.4% for AGIs $100k-200k, 407.1% for AGIs over 200k)
Ordinary dividends: $1,778 (reported on 3.9% of returns)
Here:
$1,778
State:
$15,863
(% of AGI for various income ranges: 1.8% for AGIs below $25k, 3.1% for AGIs $25k-50k, 9.0% for AGIs $50k-75k, 23.6% for AGIs $75k-100k, 41.2% for AGIs $100k-200k, 762.9% for AGIs over 200k)
Net capital gain/loss in AGI: +$4,551 (reported on 5.1% of returns)
Here:
+$4,551
State:
+$62,983
(% of AGI for various income ranges: 1.0% for AGIs below $25k, 2.9% for AGIs $25k-50k, 18.2% for AGIs $50k-75k, 45.4% for AGIs $75k-100k, 206.1% for AGIs $100k-200k, 3991.4% for AGIs over 200k)
Profit/loss from business: +$3,094 (reported on 37.9% of returns)
Here:
+$3,094
State:
+$9,719
(% of AGI for various income ranges: 216.7% for AGIs below $25k, 42.2% for AGIs $25k-50k, 99.2% for AGIs $50k-75k, 62.4% for AGIs $75k-100k, 173.0% for AGIs $100k-200k, 2054.3% for AGIs over 200k)
Taxable individual retirement arrangement distribution: $15,415 (reported on 1.3% of returns)
33032:
$15,415
Florida:
$24,823
(% of AGI for various income ranges: 5.2% for AGIs below $25k, 12.5% for AGIs $25k-50k, 38.2% for AGIs $50k-75k, 77.8% for AGIs $75k-100k, 198.9% for AGIs $100k-200k)
Total itemized deductions: $27,868 (reported on 8.6% of returns)
Here:
$27,868
State:
$45,393
(% of AGI for various income ranges: 35.6% for AGIs below $25k, 231.1% for AGIs $25k-50k, 617.1% for AGIs $50k-75k, 906.4% for AGIs $75k-100k, 1271.2% for AGIs $100k-200k, 6984.3% for AGIs over 200k)
Charity contributions: $6,271 (reported on 6.3% of returns)
Here:
$6,271
State:
$20,178
(% of AGI for various income ranges: 3.3% for AGIs below $25k, 34.4% for AGIs $25k-50k, 96.4% for AGIs $50k-75k, 146.0% for AGIs $75k-100k, 272.9% for AGIs $100k-200k, 917.1% for AGIs over 200k)
Taxes paid: $7,677 (reported on 8.4% of returns)
33032:
$7,677
State:
$6,967
(% of AGI for various income ranges: 8.8% for AGIs below $25k, 64.7% for AGIs $25k-50k, 189.9% for AGIs $50k-75k, 258.4% for AGIs $75k-100k, 321.6% for AGIs $100k-200k, 848.6% for AGIs over 200k)
Earned income credit: $2,562 (reported on 35.5% of returns)
Here:
$2,562
State:
$2,306
(% of AGI for various income ranges: 174.5% for AGIs below $25k, 100.5% for AGIs $25k-50k, 1.4% for AGIs $50k-75k)
Percentage of individuals using paid preparers for their 2020 taxes: 92.4%
Here:
92%
State:
92%
(% for various income ranges: 91.3% for AGIs below $25k, 93.7% for AGIs $25k-50k, 93.2% for AGIs $50k-75k, 92.9% for AGIs $75k-100k, 92.7% for AGIs $100k-200k, 94.7% for AGIs over 200k)
Averages for the 2012 tax year for zip code 33032, filed in 2013:
Average Adjusted Gross Income (AGI) in 2012: $33,779 (Individual Income Tax Returns)
Here:
$33,779
State:
$60,316
Salary/wage: $31,484 (reported on 85.1% of returns)
Here:
$31,484
State:
$45,277
(% of AGI for various income ranges: 77.9% for AGIs below $25k, 92.3% for AGIs $25k-50k, 91.2% for AGIs $50k-75k, 90.1% for AGIs $75k-100k, 83.2% for AGIs $100k-200k, 18.8% for AGIs over 200k)
Taxable interest for individuals: $783 (reported on 10.7% of returns)
This zip code:
$783
Florida:
$3,587
(% of AGI for various income ranges: 0.3% for AGIs below $25k, 0.1% for AGIs $25k-50k, 0.3% for AGIs $50k-75k, 0.2% for AGIs $75k-100k, 0.2% for AGIs $100k-200k, 0.5% for AGIs over 200k)
Ordinary dividends: $5,626 (reported on 4.0% of returns)
Here:
$5,626
State:
$12,831
(% of AGI for various income ranges: 1.2% for AGIs below $25k, 0.3% for AGIs $25k-50k, 0.4% for AGIs $50k-75k, 0.4% for AGIs $75k-100k, 0.4% for AGIs $100k-200k, 1.5% for AGIs over 200k)
Net capital gain/loss in AGI: +$16,851 (reported on 2.7% of returns)
Here:
+$16,851
State:
+$33,493
(% of AGI for various income ranges: 0.1% for AGIs $25k-50k, 0.2% for AGIs $75k-100k, 0.5% for AGIs $100k-200k, 11.4% for AGIs over 200k)
Profit/loss from business: +$5,675 (reported on 27.0% of returns)
Here:
+$5,675
State:
+$10,012
(% of AGI for various income ranges: 16.4% for AGIs below $25k, 1.7% for AGIs $25k-50k, 0.6% for AGIs $50k-75k, 0.8% for AGIs $75k-100k, 1.9% for AGIs $100k-200k)
Taxable individual retirement arrangement distribution: $11,710 (reported on 1.8% of returns)
33032:
$11,710
Florida:
$21,544
(% of AGI for various income ranges: 0.3% for AGIs below $25k, 0.6% for AGIs $25k-50k, 0.7% for AGIs $50k-75k, 0.7% for AGIs $75k-100k, 1.6% for AGIs $100k-200k)
Self-employment retirement plans: $4,233 (reported on 0.2% of returns)
33032:
$4,233
Florida:
$20,611
Total itemized deductions: $19,258 (28% of AGI, reported on 22.7% of returns)
Here:
$19,258
State:
$25,533
Here:
28.0% of AGI
State:
18.0% of AGI
(% of AGI for various income ranges: 6.5% for AGIs below $25k, 16.2% for AGIs $25k-50k, 18.7% for AGIs $50k-75k, 15.6% for AGIs $75k-100k, 13.9% for AGIs $100k-200k, 6.2% for AGIs over 200k)
Charity contributions: $3,009 (reported on 17.4% of returns)
Here:
$3,009
State:
$5,698
(% of AGI for various income ranges: 0.5% for AGIs below $25k, 1.8% for AGIs $25k-50k, 2.5% for AGIs $50k-75k, 2.2% for AGIs $75k-100k, 2.0% for AGIs $100k-200k, 0.6% for AGIs over 200k)
Taxes paid: $3,161 (reported on 21.7% of returns)
33032:
$3,161
State:
$6,203
(% of AGI for various income ranges: 0.9% for AGIs below $25k, 2.3% for AGIs $25k-50k, 2.9% for AGIs $50k-75k, 2.6% for AGIs $75k-100k, 2.5% for AGIs $100k-200k, 1.2% for AGIs over 200k)
Earned income credit: $2,802 (reported on 43.6% of returns)
Here:
$2,802
State:
$2,372
(% of AGI for various income ranges: 14.0% for AGIs below $25k, 2.0% for AGIs $25k-50k)
Percentage of individuals using paid preparers for their 2012 taxes: 65.9%
Here:
66%
State:
54%
(% for various income ranges: 65.7% for AGIs below $25k, 67.3% for AGIs $25k-50k, 64.2% for AGIs $50k-75k, 62.7% for AGIs $75k-100k, 65.6% for AGIs $100k-200k, 75.0% for AGIs over 200k)
Averages for the 2004 tax year for zip code 33032, filed in 2005:
Average Adjusted Gross Income (AGI) in 2004: $30,842 (Individual Income Tax Returns)
Here:
$30,842
State:
$50,523
Salary/wage: $28,761 (reported on 87.7% of returns)
Here:
$28,761
State:
$39,563
(% of AGI for various income ranges: 83.3% for AGIs below $10k, 82.9% for AGIs $10k-25k, 94.1% for AGIs $25k-50k, 90.3% for AGIs $50k-75k, 91.5% for AGIs $75k-100k, 47.7% for AGIs over 100k)
Taxable interest for individuals: $1,141 (reported on 17.9% of returns)
This zip code:
$1,141
Florida:
$3,211
(% of AGI for various income ranges: 0.8% for AGIs below $10k, 0.4% for AGIs $10k-25k, 0.3% for AGIs $25k-50k, 0.3% for AGIs $50k-75k, 0.3% for AGIs $75k-100k, 2.0% for AGIs over 100k)
Taxable dividends: $2,829 (reported on 5.4% of returns)
Here:
$2,829
State:
$6,129
(% of AGI for various income ranges: 0.3% for AGIs below $10k, 0.2% for AGIs $10k-25k, 0.1% for AGIs $25k-50k, 0.4% for AGIs $50k-75k, 0.3% for AGIs $75k-100k, 1.7% for AGIs over 100k)
Net capital gain/loss: +$20,745 (reported on 4.5% of returns)
Here:
+$20,745
State:
+$27,205
(% of AGI for various income ranges: -0.2% for AGIs below $10k, 0.1% for AGIs $10k-25k, 0.2% for AGIs $25k-50k, 0.3% for AGIs $50k-75k, 1.0% for AGIs $75k-100k, 14.9% for AGIs over 100k)
Profit/loss from business: +$7,562 (reported on 21.3% of returns)
Here:
+$7,562
State:
+$10,634
(% of AGI for various income ranges: 26.9% for AGIs below $10k, 13.6% for AGIs $10k-25k, 2.0% for AGIs $25k-50k, 1.5% for AGIs $50k-75k, 0.6% for AGIs $75k-100k, 3.1% for AGIs over 100k)
IRA payment deduction: $2,504 (reported on 1.4% of returns)
33032:
$2,504
Florida:
$3,082
(% of AGI for various income ranges: 0.1% for AGIs $10k-25k, 0.1% for AGIs $25k-50k, 0.3% for AGIs $50k-75k, 0.1% for AGIs over 100k)
Total itemized deductions: $17,169 (30% of AGI, reported on 28.5% of returns)
Here:
$17,169
State:
$20,370
Here:
30.1% of AGI
State:
20.7% of AGI
(% of AGI for various income ranges: 7.1% for AGIs below $10k, 9.3% for AGIs $10k-25k, 20.6% for AGIs $25k-50k, 20.0% for AGIs $50k-75k, 19.4% for AGIs $75k-100k, 11.2% for AGIs over 100k)
Charity contributions deductions: $2,550 (4% of AGI, reported on 23.8% of returns)
Here:
$2,550
State:
$4,064
Here:
4.2% of AGI
State:
3.8% of AGI
(% of AGI for various income ranges: 0.4% for AGIs below $10k, 0.7% for AGIs $10k-25k, 2.3% for AGIs $25k-50k, 2.7% for AGIs $50k-75k, 3.0% for AGIs $75k-100k, 1.7% for AGIs over 100k)
Total tax: $4,092 (reported on 61.1% of returns)
33032:
$4,092
State:
$9,431
(% of AGI for various income ranges: 4.8% for AGIs below $10k, 3.5% for AGIs $10k-25k, 4.4% for AGIs $25k-50k, 7.4% for AGIs $50k-75k, 9.1% for AGIs $75k-100k, 19.3% for AGIs over 100k)
Earned income credit: $2,240 (reported on 41.7% of returns)
Here:
$2,240
State:
$1,808
Percentage of individuals using paid preparers for their 2004 taxes: 70.5%
Here:
71%
State:
60%
(% for various income ranges: 67.8% for AGIs below $10k, 74.6% for AGIs $10k-25k, 69.8% for AGIs $25k-50k, 64.8% for AGIs $50k-75k, 65.5% for AGIs $75k-100k, 71.4% for AGIs over 100k)
Likely homosexual households (counted as self-reported same-sex unmarried-partner households)
Lesbian couples: 0.0% of all households
Gay men: 0.1% of all households
Household received Food Stamps/SNAP in the past 12 months: 4,873 Household did not receive Food Stamps/SNAP in the past 12 months: 12,923
Women who had a birth in the past 12 months: 489 (303 now married, 183 unmarried) Women who did not have a birth in the past 12 months: 15,140 (5,870 now married, 9,269 unmarried)
Housing units in zip code 33032 with a mortgage: 8,225 (231 second mortgage, 12 home equity loan, 99 both second mortgage and home equity loan) Houses without a mortgage: 40
Median monthly owner costs for units with a mortgage: $2,140 Median monthly owner costs for units without a mortgage: $626
Residents with income below the poverty level in 2022:
This zip code:
15.6%
Whole state:
12.7%
Residents with income below 50% of the poverty level in 2022:
This zip code:
9.2%
Whole state:
6.6%
Median number of rooms in houses and condos:
Here:
6.0
State:
5.9
Median number of rooms in apartments:
Here:
4.5
State:
4.2
Notable locations in this zip code not listed on our city pages
Notable locations in zip code 33032: Shoppes of Naranja Lake (A), Miami-Dade County Fire Control Headquarters (B), Black Point Marina (C), Orchid Jungle (D), Small World Day Care Center (E), Saint Ann Mission - Naranja Center (F), Carol Day Care Center (G), Aim High Day Care Center (H), Miami - Dade County Fire Rescue Station 5 (I), South Dade Sewage Treatment Facility (J), Naranja Recreation Center (K). Display/hide their locations on the map
7,726 married couples with children.
5,934 single-parent households (1,239 men, 4,695 women).
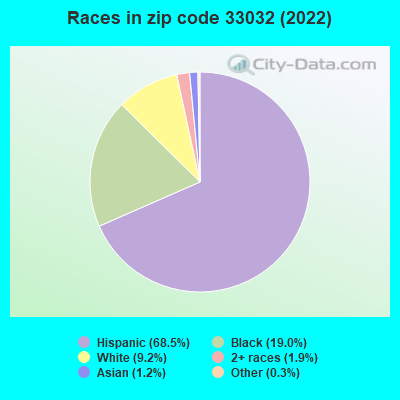
33.0% of residents of 33032 zip code speak English at home.
62.8% of residents speak Spanish at home (52% very well, 18% well, 19% not well, 12% not at all).
2.9% of residents speak other Indo-European language at home (70% very well, 16% well, 7% not well, 7% not at all).
0.7% of residents speak Asian or Pacific Island language at home (59% very well, 22% well, 18% not at all).
0.4% of residents speak other language at home (62% very well, 19% not well, 19% not at all).
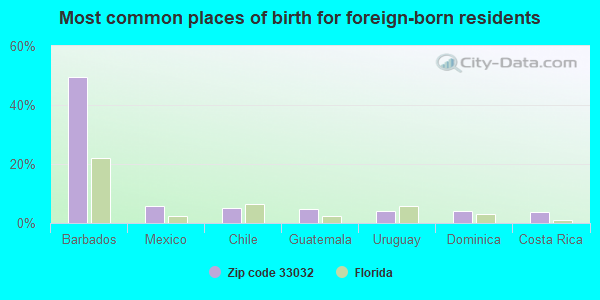
Foreign born population: 27,415 (46.5%) (59.4% of them are naturalized citizens)
This zip code:
46.5%
Whole state:
21.7%
49%Barbados
6%Mexico
5%Chile
5%Guatemala
4%Uruguay
4%Dominica
4%Costa Rica
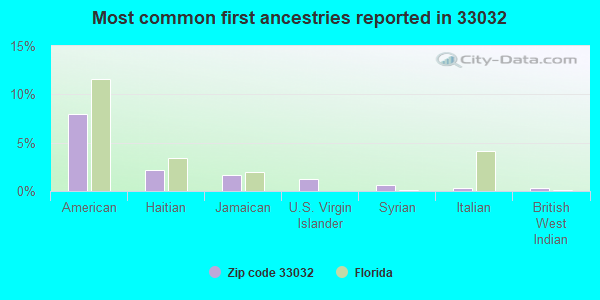
8%American
2%Haitian
2%Jamaican
1%U.S. Virgin Islander
1%Syrian
0%Italian
0%British West Indian
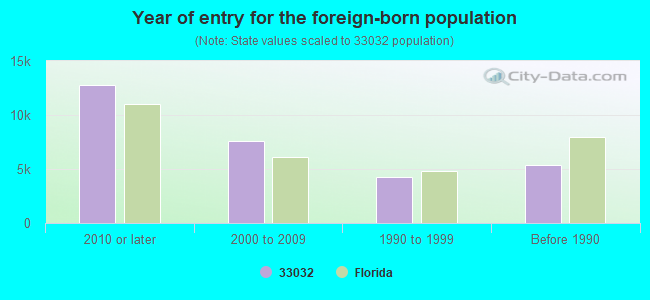
Year of entry for the foreign-born population
12,8032010 or later
7,5932000 to 2009
4,2611990 to 1999
5,413Before 1990
Facilities with environmental interests located in this zip code:
AIR BASE ELEMENTARY SCHOOL (12829 S.W. 272ND STREET in HOMESTEAD, FL)
(National Center for Education Statistics) - STATE ID-0041 Small Quantity Generators, between 100 kg and 1000 kg of hazardous waste/month (Resource Conservation and Recovery Act (tracking hazardous waste)) - notification Small Quantity Generators, between 100 kg and 1000 kg of hazardous waste/month (Resource Conservation and Recovery Act (tracking hazardous waste)) - notification Organizations: RONALD NICKERSON, PRINCIPAL (CONTACT/OWNER)
, DADE COUNTY SCHOOL DISTRICT (SCHOOL DISTRICT)
Alternative names: DADE CO AIR BASE ELEMENTARY, DADE CO REDLAND ELEMENTARY
NARANJA ELEMENTARY SCHOOL (13990 S.W. 264TH STREET in NARANJA, FL)
(Geographic Names Information System) (National Center for Education Statistics) - STATE ID-3621 Small Quantity Generators, between 100 kg and 1000 kg of hazardous waste/month (Resource Conservation and Recovery Act (tracking hazardous waste)) - notification Organizations: O`NEIL MCGREW, PRINCIPAL (CONTACT/OWNER)
, DADE COUNTY SCHOOL DISTRICT (SCHOOL DISTRICT)
Alternative names: DADE CO NARANJA ELEMENTARY
SILVER PALM EAST (SW 117TH AVE & SW 240TH ST in HOMESTEAD, FL)
National Pollutant Discharge Elimination System NON-MAJOR (Tracking pollutant discharge elimination systems) - permit Organizations: ANTHONY SEIJAS (CONTACT/OWNER)
SILVER PALM WEST (SW 117TH AVE & SW 240TH ST in HOMESTEAD, FL)
National Pollutant Discharge Elimination System NON-MAJOR (Tracking pollutant discharge elimination systems) - permit Organizations: ANTHONY SEIJAS (CONTACT/OWNER)
ARTEMISA SHELL SERVICE (25075 S DIXIE HWY in PRINCETON, FL)
GLADE & GROOVE SUPPLY CO INC (13841 SW 252 ST in PRINCETON, FL)
(Resource Conservation and Recovery Act (tracking hazardous waste)) Organizations: MARK COOPER, VP (CONTACT/OWNER)
HOWARDS PAINT & BODY SHOP (24141 S DIXIE HWY in PRINCETON, FL)
(Resource Conservation and Recovery Act (tracking hazardous waste)) Organizations: LINZGREEN REAL ESTATE (CONTACT/OWNER)
AMOCO SERVICE STATION #4178 (24795 S DIXIE HWY in PRINCETON, FL)
Small Quantity Generators, between 100 kg and 1000 kg of hazardous waste/month (Resource Conservation and Recovery Act (tracking hazardous waste)) - notification Organizations: ARTHUR SPENCE, DEALER (CONTACT/OWNER)
AMUSEMENTS OF AMERICA (24301 SW 137TH AVE in PRINCETON, FL)
Small Quantity Generators, between 100 kg and 1000 kg of hazardous waste/month (Resource Conservation and Recovery Act (tracking hazardous waste)) - notification Organizations: FONTANA MATT MGR (CONTACT/OWNER)
H & H LANDCLEARING INC (25550 SW 142ND AVE in PRINCETON, FL)
Small Quantity Generators, between 100 kg and 1000 kg of hazardous waste/month (Resource Conservation and Recovery Act (tracking hazardous waste)) - notification Organizations: HARDEN ROGER (CONTACT/OWNER)
PRINCETON AUTO & TRUCK REPAIR (23756 SW 132ND AVE in HOMESTEAD, FL)
Small Quantity Generators, between 100 kg and 1000 kg of hazardous waste/month (Resource Conservation and Recovery Act (tracking hazardous waste)) - notification Organizations: JAMES R HESS (CONTACT/OWNER)
SEAHUNTER (25400 SW 140TH AVE in PRINCETON, FL)
Small Quantity Generators, between 100 kg and 1000 kg of hazardous waste/month (Resource Conservation and Recovery Act (tracking hazardous waste)) Organizations: RALPH MONTALUO (CONTACT/OWNER)
Housing units lacking complete plumbing facilities: 0.1% Housing units lacking complete kitchen facilities: 0.4%
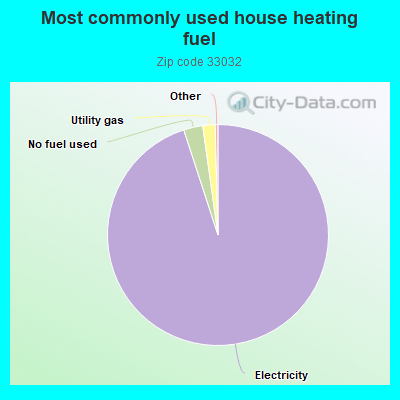
95.0%Electricity
2.8%No fuel used
1.8%Utility gas
Population in 1990: 18,070. Population change in the 1990s: +2,646 (+14.6%).
Place of birth for U.S.-born residents:
This state: 24,059
Northeast: 3,103
Midwest: 437
South: 1,389
West: 500
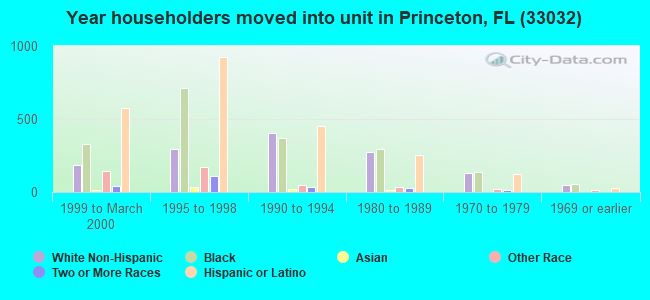
51% of the 33032 zip code residents lived in the same house 5 years ago. Out of people who lived in different houses, 83% lived in this county. Out of people who lived in different counties, 50% lived in Florida.
88% of the 33032 zip code residents lived in the same house 1 year ago. Out of people who lived in different houses, 63% moved from this county. Out of people who lived in different houses, 7% moved from different county within same state. Out of people who lived in different houses, 4% moved from different state. Out of people who lived in different houses, 24% moved from abroad.
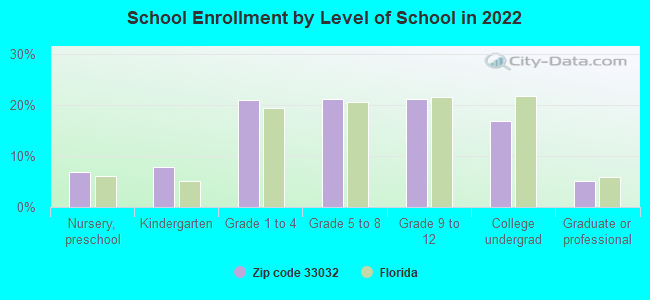
Private vs. public school enrollment:
Students in private schools in grades 1 to 8 (elementary and middle school): 675
Here:
10.0%
Florida:
15.8%
Students in private schools in grades 9 to 12 (high school): 180
Here:
5.3%
Florida:
12.9%
Students in private undergraduate colleges: 387
Here:
14.3%
Florida:
23.6%
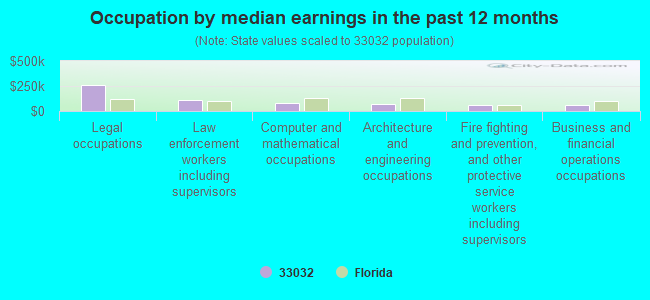
Occupation by median earnings in the past 12 months ($)
256,359Legal occupations
108,297Law enforcement workers including supervisors
78,260Computer and mathematical occupations
73,888Architecture and engineering occupations
58,595Fire fighting and prevention, and other protective service workers including supervisors
57,676Business and financial operations occupations
Companies with federal contracts located in this zip code:
ELYS LAWN SERVICE INC (26831 SW 145 AVE RD in NARANJA, FL; small business) : $942,988 in 12 contractsfrom 2000 to 2006
Contracts for Landscaping/Groundskeeping Services by Air Force Signed by year:2000: $130,095; 2001: $130,095; 2002: $178,884; 2003: $131,624; 2004: $211,198; 2005: $170,596; 2006: -$9,504.
Biggest contracts:
$184,994 with Air Force for Landscaping/Groundskeeping Services. Signed on 2005-10-01. Completion date: 2006-09-30.
$184,994, same as above.Signed on 2004-10-01. Completion date: 2005-09-30.
$131,624, same as above.Signed on 2003-10-01. Completion date: 2007-09-30.
$130,095, same as above.Signed on 2001-03-20. Completion date: 2001-03-20.
NEW LIMECO LLC (25251 SW 139TH AVE in PRINCETON, FL; small business) : $596,199 in 107 contractsfrom 2004 to 2006
Contracts for Fruits and Vegetables by Defense Logistics Agency Signed by year:2000: $0; 2001: $0; 2002: $0; 2003: $0; 2004: $282,187; 2005: $255,069; 2006: $58,943.
Biggest contracts:
$25,090 with Defense Logistics Agency for Fruits and Vegetables. Signed on 2004-11-17. Completion date: 2004-11-17.
$20,950, same as above.Signed on 2004-11-24. Completion date: 2004-11-24.
$18,824, same as above.Signed on 2005-08-06. Completion date: 2005-08-06.
$13,910, same as above.Signed on 2005-10-23. Completion date: 2005-10-23.
JV INTERNATIONAL TRADING CORP. (13935 SW 252 ST. in HOMESTEAD, FL; small business)
$235,700 with Air Force for Transformers: Distribution and Power Station. Signed on 2000-05-25. Completion date: 2000-06-25.
ZUNI TRANSPORTATION (23635-A SOUTH DIXIE HIGHWA in HOMESTEAD, FL; small business) : $78,240 in 3 contractsfrom 1999 to 2000
$51,840 with Army for Passenger Motor Charter Service. Signed on 2000-10-01. Completion date: 2001-09-30.
$26,400 with Air Force for Motor Passenger Services. Signed on 1999-10-01. Completion date: 2000-09-30.
$0 with Army for Passenger Motor Charter Service. Signed on 2000-10-01. Completion date: 2001-09-30.
DENTAL CARE CENTER (27501 S DIXIE HWY STE 300 in HOMESTEAD, FL; small business)
$10,000 with Army for Dental Instruments, Equipment, and Supplies. Signed on 2003-12-02. Completion date: 2004-09-30.
AAA ABOVE ALL SUN GOLD COKER O (25105 SW 142 AVE in HOMESTEAD, FL; small business) : $2,940 in 2 contractsin 2005
$2,940 with Air Force for Waste Treatment and Storage. Signed on 2005-10-01. Completion date: 2006-09-30.
$0, same as above.Signed on 2005-10-01. Completion date: 2006-09-30.
DIVERSIFIED AIRCRAFT PARTS, IN (24864 SW 129 PATH in HOMESTEAD, FL; small business) 50 employees, $0 revenue. Woman Owned Business: $0 in 2 contractsin 2005
$6,001 with Air Force for Bearings, Antifriction, Unmounted. Signed on 2005-08-30. Completion date: 2005-09-13.
-$6,001, same as above.Signed on 2005-09-12. Completion date: 2005-09-13.
Top industries in this zip code by the number of employees in 2005:
2008 - 2018 National Fire Incident Reporting System (NFIRS) incidents
According to the data from the years 2008 - 2018 the average number of fire incidents per year is 146. The highest number of reported fires - 203 took place in 2013, and the least - 97 in 2014. The data has a dropping trend.
When looking into fire subcategories, the most reports belonged to: Outside Fires (56.4%), and Structure Fires (24.1%).
Fire incident types reported to NFIRS in Zip Code 33032


 Nearest zip codes: 33039, 33190, 33033, 33177, 33189, 33170.


 According to the data from the years 2008 - 2018 the average number of fire incidents per year is 146. The highest number of reported fires - 203 took place in 2013, and the least - 97 in 2014. The data has a dropping trend.
 When looking into fire subcategories, the most reports belonged to: Outside Fires (56.4%), and Structure Fires (24.1%).