Estimated zip code population in 2022: 70,042 Zip code population in 2010: 49,028 Zip code population in 2000: 31,394
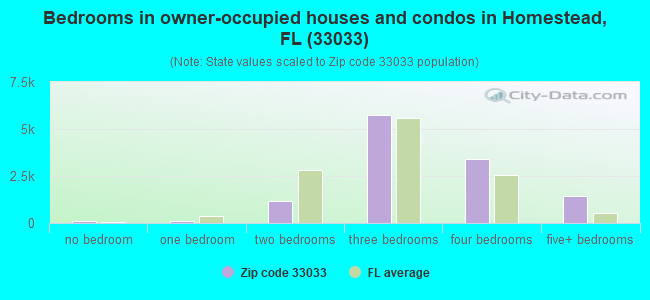
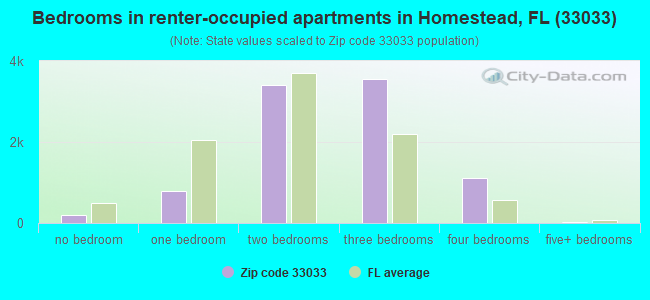
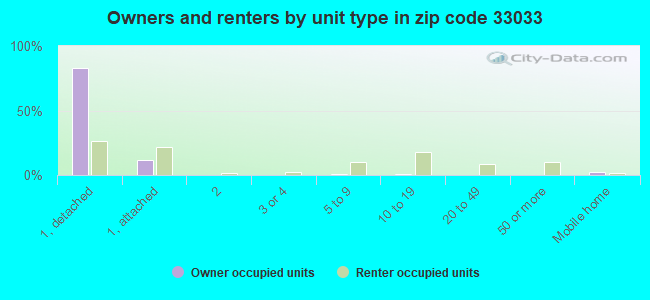
Houses and condos: 21,370 Renter-occupied apartments: 9,180
% of renters here:
44%
State:
33%
March 2022 cost of living index in zip code 33033: 104.5 (near average, U.S. average is 100)
Land area: 16.8 sq. mi. Water area: 0.5 sq. mi.
Population density: 4,174 people per square mile
(average).
OSM Map
General Map
Google Map
MSN Map
OSM Map
General Map
Google Map
MSN Map
OSM Map
General Map
Google Map
MSN Map
OSM Map
General Map
Google Map
MSN Map
Please wait while loading the map...
Real estate property taxes paid for housing units in 2022:
This zip code:
0.9% ($3,682)
Florida:
0.7% ($2,529)
Median real estate property taxes paid for housing units with mortgages in 2022: $3,957 (1.0%) Median real estate property taxes paid for housing units with no mortgage in 2022: $2,786 (0.7%)
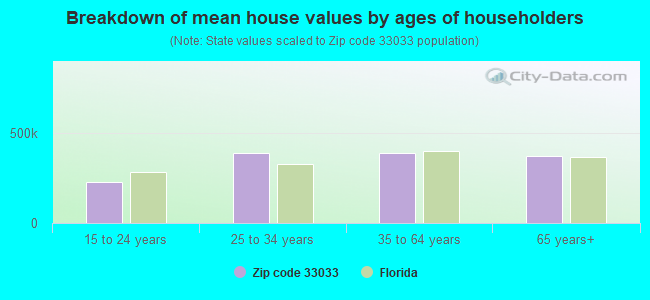
Estimated median house/condo value in 2022: $402,695
33033:
$402,695
Florida:
$354,100
According to our research of Florida and other state lists, there were 47 registered sex offenders living in 33033 zip code as of April 27, 2024. The ratio of all residents to sex offenders in zip code 33033 is 1,208 to 1. The ratio of registered sex offenders to all residents in this zip code is lower than the state average.
Median resident age:
This zip code:
33.1 years
Florida median age:
42.7 years
Average household size:
This zip code:
3.3 people
Florida:
2.5 people
Averages for the 2020 tax year for zip code 33033, filed in 2021:
Average Adjusted Gross Income (AGI) in 2020: $39,025 (Individual Income Tax Returns)
Here:
$39,025
State:
$82,200
Salary/wage: $40,640 (reported on 81.6% of returns)
Here:
$40,640
State:
$58,347
(% of AGI for various income ranges: 1269.5% for AGIs below $25k, 3768.5% for AGIs $25k-50k, 6889.9% for AGIs $50k-75k, 9855.3% for AGIs $75k-100k, 16526.9% for AGIs $100k-200k, 60153.8% for AGIs over 200k)
Taxable interest for individuals: $558 (reported on 8.9% of returns)
This zip code:
$558
Florida:
$4,272
(% of AGI for various income ranges: 2.6% for AGIs below $25k, 3.2% for AGIs $25k-50k, 5.9% for AGIs $50k-75k, 18.0% for AGIs $75k-100k, 26.5% for AGIs $100k-200k, 296.2% for AGIs over 200k)
Ordinary dividends: $1,995 (reported on 4.2% of returns)
Here:
$1,995
State:
$15,863
(% of AGI for various income ranges: 2.5% for AGIs below $25k, 3.8% for AGIs $25k-50k, 10.6% for AGIs $50k-75k, 24.3% for AGIs $75k-100k, 53.4% for AGIs $100k-200k, 868.8% for AGIs over 200k)
Net capital gain/loss in AGI: +$6,274 (reported on 5.3% of returns)
Here:
+$6,274
State:
+$62,983
(% of AGI for various income ranges: 0.8% for AGIs below $25k, 4.5% for AGIs $25k-50k, 15.3% for AGIs $50k-75k, 61.2% for AGIs $75k-100k, 253.0% for AGIs $100k-200k, 6736.2% for AGIs over 200k)
Profit/loss from business: +$2,885 (reported on 36.0% of returns)
Here:
+$2,885
State:
+$9,719
(% of AGI for various income ranges: 203.3% for AGIs below $25k, 32.5% for AGIs $25k-50k, 33.8% for AGIs $50k-75k, 124.5% for AGIs $75k-100k, 119.1% for AGIs $100k-200k, 2001.2% for AGIs over 200k)
Taxable individual retirement arrangement distribution: $13,596 (reported on 1.6% of returns)
33033:
$13,596
Florida:
$24,823
(% of AGI for various income ranges: 5.1% for AGIs below $25k, 11.9% for AGIs $25k-50k, 41.7% for AGIs $50k-75k, 88.3% for AGIs $75k-100k, 203.4% for AGIs $100k-200k)
Total itemized deductions: $27,924 (reported on 7.8% of returns)
Here:
$27,924
State:
$45,393
(% of AGI for various income ranges: 31.0% for AGIs below $25k, 208.6% for AGIs $25k-50k, 575.5% for AGIs $50k-75k, 859.1% for AGIs $75k-100k, 1135.8% for AGIs $100k-200k, 5605.0% for AGIs over 200k)
Charity contributions: $6,672 (reported on 5.8% of returns)
Here:
$6,672
State:
$20,178
(% of AGI for various income ranges: 4.0% for AGIs below $25k, 34.0% for AGIs $25k-50k, 86.0% for AGIs $50k-75k, 151.4% for AGIs $75k-100k, 266.7% for AGIs $100k-200k, 1087.5% for AGIs over 200k)
Taxes paid: $8,123 (reported on 7.4% of returns)
33033:
$8,123
State:
$6,967
(% of AGI for various income ranges: 7.7% for AGIs below $25k, 59.1% for AGIs $25k-50k, 181.3% for AGIs $50k-75k, 236.6% for AGIs $75k-100k, 295.7% for AGIs $100k-200k, 1051.2% for AGIs over 200k)
Earned income credit: $2,643 (reported on 35.2% of returns)
Here:
$2,643
State:
$2,306
(% of AGI for various income ranges: 179.2% for AGIs below $25k, 106.9% for AGIs $25k-50k, 1.0% for AGIs $50k-75k)
Percentage of individuals using paid preparers for their 2020 taxes: 91.7%
Here:
92%
State:
92%
(% for various income ranges: 90.5% for AGIs below $25k, 93.3% for AGIs $25k-50k, 92.5% for AGIs $50k-75k, 92.4% for AGIs $75k-100k, 92.5% for AGIs $100k-200k, 92.3% for AGIs over 200k)
Averages for the 2012 tax year for zip code 33033, filed in 2013:
Average Adjusted Gross Income (AGI) in 2012: $31,917 (Individual Income Tax Returns)
Here:
$31,917
State:
$60,316
Salary/wage: $32,105 (reported on 85.7% of returns)
Here:
$32,105
State:
$45,277
(% of AGI for various income ranges: 80.2% for AGIs below $25k, 92.1% for AGIs $25k-50k, 89.9% for AGIs $50k-75k, 85.1% for AGIs $75k-100k, 85.4% for AGIs $100k-200k, 73.8% for AGIs over 200k)
Taxable interest for individuals: $788 (reported on 11.3% of returns)
This zip code:
$788
Florida:
$3,587
(% of AGI for various income ranges: 0.3% for AGIs below $25k, 0.2% for AGIs $25k-50k, 0.3% for AGIs $50k-75k, 0.3% for AGIs $75k-100k, 0.3% for AGIs $100k-200k, 0.4% for AGIs over 200k)
Ordinary dividends: $4,357 (reported on 4.2% of returns)
Here:
$4,357
State:
$12,831
(% of AGI for various income ranges: 0.8% for AGIs below $25k, 0.6% for AGIs $25k-50k, 0.5% for AGIs $50k-75k, 0.3% for AGIs $75k-100k, 0.6% for AGIs $100k-200k, 0.4% for AGIs over 200k)
Net capital gain/loss in AGI: +$2,568 (reported on 2.7% of returns)
Here:
+$2,568
State:
+$33,493
(% of AGI for various income ranges: 0.1% for AGIs $25k-50k, 0.1% for AGIs $75k-100k, 1.1% for AGIs $100k-200k)
Profit/loss from business: +$5,252 (reported on 25.4% of returns)
Here:
+$5,252
State:
+$10,012
(% of AGI for various income ranges: 14.2% for AGIs below $25k, 1.4% for AGIs $25k-50k, 1.4% for AGIs $50k-75k, 0.6% for AGIs $75k-100k, 0.5% for AGIs $100k-200k)
Taxable individual retirement arrangement distribution: $12,209 (reported on 1.9% of returns)
33033:
$12,209
Florida:
$21,544
(% of AGI for various income ranges: 0.3% for AGIs below $25k, 0.6% for AGIs $25k-50k, 0.9% for AGIs $50k-75k, 0.8% for AGIs $75k-100k, 1.6% for AGIs $100k-200k)
Self-employment retirement plans: $3,280 (reported on 0.2% of returns)
33033:
$3,280
Florida:
$20,611
Total itemized deductions: $19,368 (32% of AGI, reported on 20.9% of returns)
Here:
$19,368
State:
$25,533
Here:
31.7% of AGI
State:
18.0% of AGI
(% of AGI for various income ranges: 6.3% for AGIs below $25k, 14.4% for AGIs $25k-50k, 15.0% for AGIs $50k-75k, 18.5% for AGIs $75k-100k, 14.1% for AGIs $100k-200k, 6.0% for AGIs over 200k)
Charity contributions: $2,863 (reported on 15.5% of returns)
Here:
$2,863
State:
$5,698
(% of AGI for various income ranges: 0.4% for AGIs below $25k, 1.6% for AGIs $25k-50k, 1.7% for AGIs $50k-75k, 1.9% for AGIs $75k-100k, 1.9% for AGIs $100k-200k, 1.2% for AGIs over 200k)
Taxes paid: $3,121 (reported on 19.6% of returns)
33033:
$3,121
State:
$6,203
(% of AGI for various income ranges: 0.9% for AGIs below $25k, 2.0% for AGIs $25k-50k, 2.4% for AGIs $50k-75k, 2.4% for AGIs $75k-100k, 2.5% for AGIs $100k-200k, 1.2% for AGIs over 200k)
Earned income credit: $2,821 (reported on 42.0% of returns)
Here:
$2,821
State:
$2,372
(% of AGI for various income ranges: 13.3% for AGIs below $25k, 2.0% for AGIs $25k-50k)
Percentage of individuals using paid preparers for their 2012 taxes: 67.6%
Here:
68%
State:
54%
(% for various income ranges: 69.2% for AGIs below $25k, 67.8% for AGIs $25k-50k, 62.4% for AGIs $50k-75k, 61.1% for AGIs $75k-100k, 62.8% for AGIs $100k-200k, 85.7% for AGIs over 200k)
Averages for the 2004 tax year for zip code 33033, filed in 2005:
Average Adjusted Gross Income (AGI) in 2004: $29,140 (Individual Income Tax Returns)
Here:
$29,140
State:
$50,523
Salary/wage: $28,351 (reported on 87.7% of returns)
Here:
$28,351
State:
$39,563
(% of AGI for various income ranges: 73.7% for AGIs below $10k, 85.3% for AGIs $10k-25k, 92.8% for AGIs $25k-50k, 89.2% for AGIs $50k-75k, 90.8% for AGIs $75k-100k, 63.7% for AGIs over 100k)
Taxable interest for individuals: $1,002 (reported on 19.6% of returns)
This zip code:
$1,002
Florida:
$3,211
(% of AGI for various income ranges: 1.0% for AGIs below $10k, 0.5% for AGIs $10k-25k, 0.4% for AGIs $25k-50k, 0.6% for AGIs $50k-75k, 0.5% for AGIs $75k-100k, 1.8% for AGIs over 100k)
Taxable dividends: $1,801 (reported on 5.7% of returns)
Here:
$1,801
State:
$6,129
(% of AGI for various income ranges: 0.8% for AGIs below $10k, 0.3% for AGIs $10k-25k, 0.2% for AGIs $25k-50k, 0.3% for AGIs $50k-75k, 0.1% for AGIs $75k-100k, 0.9% for AGIs over 100k)
Net capital gain/loss: +$13,817 (reported on 4.9% of returns)
Here:
+$13,817
State:
+$27,205
(% of AGI for various income ranges: -0.1% for AGIs below $10k, 0.0% for AGIs $10k-25k, 0.3% for AGIs $25k-50k, 0.8% for AGIs $50k-75k, 1.3% for AGIs $75k-100k, 13.3% for AGIs over 100k)
Profit/loss from business: +$6,580 (reported on 19.7% of returns)
Here:
+$6,580
State:
+$10,634
(% of AGI for various income ranges: 28.7% for AGIs below $10k, 10.4% for AGIs $10k-25k, 2.0% for AGIs $25k-50k, 1.4% for AGIs $50k-75k, 0.2% for AGIs $75k-100k, 0.8% for AGIs over 100k)
Profit/loss from farming: +$4,929 (reported on 0.3% of returns)
Here:
+$4,929
State:
-$6,005
IRA payment deduction: $2,456 (reported on 1.1% of returns)
33033:
$2,456
Florida:
$3,082
(% of AGI for various income ranges: 0.1% for AGIs $10k-25k, 0.1% for AGIs $25k-50k, 0.1% for AGIs $50k-75k, 0.1% for AGIs $75k-100k, 0.1% for AGIs over 100k)
Total itemized deductions: $16,712 (30% of AGI, reported on 24.1% of returns)
Here:
$16,712
State:
$20,370
Here:
30.2% of AGI
State:
20.7% of AGI
(% of AGI for various income ranges: 5.0% for AGIs below $10k, 7.8% for AGIs $10k-25k, 16.5% for AGIs $25k-50k, 18.2% for AGIs $50k-75k, 16.9% for AGIs $75k-100k, 11.7% for AGIs over 100k)
Charity contributions deductions: $2,332 (4% of AGI, reported on 20.1% of returns)
Here:
$2,332
State:
$4,064
Here:
4.1% of AGI
State:
3.8% of AGI
(% of AGI for various income ranges: 0.3% for AGIs below $10k, 0.6% for AGIs $10k-25k, 1.6% for AGIs $25k-50k, 2.2% for AGIs $50k-75k, 2.5% for AGIs $75k-100k, 2.0% for AGIs over 100k)
Total tax: $3,385 (reported on 60.8% of returns)
33033:
$3,385
State:
$9,431
(% of AGI for various income ranges: 4.9% for AGIs below $10k, 3.2% for AGIs $10k-25k, 4.7% for AGIs $25k-50k, 7.8% for AGIs $50k-75k, 9.9% for AGIs $75k-100k, 15.3% for AGIs over 100k)
Earned income credit: $2,185 (reported on 41.0% of returns)
Here:
$2,185
State:
$1,808
Percentage of individuals using paid preparers for their 2004 taxes: 72.6%
Here:
73%
State:
60%
(% for various income ranges: 70.0% for AGIs below $10k, 78.8% for AGIs $10k-25k, 69.8% for AGIs $25k-50k, 67.7% for AGIs $50k-75k, 65.3% for AGIs $75k-100k, 60.2% for AGIs over 100k)
Likely homosexual households (counted as self-reported same-sex unmarried-partner households)
Lesbian couples: 0.1% of all households
Gay men: 0.1% of all households
Household received Food Stamps/SNAP in the past 12 months: 6,428 Household did not receive Food Stamps/SNAP in the past 12 months: 14,388
Women who had a birth in the past 12 months: 949 (440 now married, 484 unmarried) Women who did not have a birth in the past 12 months: 16,909 (6,904 now married, 10,005 unmarried)
Housing units in zip code 33033 with a mortgage: 8,548 (398 second mortgage, 59 home equity loan, 279 both second mortgage and home equity loan) Median monthly owner costs for units with a mortgage: $2,070 Median monthly owner costs for units without a mortgage: $708
Residents with income below the poverty level in 2022:
This zip code:
15.9%
Whole state:
12.7%
Residents with income below 50% of the poverty level in 2022:
This zip code:
7.5%
Whole state:
6.6%
Median number of rooms in houses and condos:
Here:
6.2
State:
5.9
Median number of rooms in apartments:
Here:
4.8
State:
4.2
Notable locations in this zip code not listed on our city pages
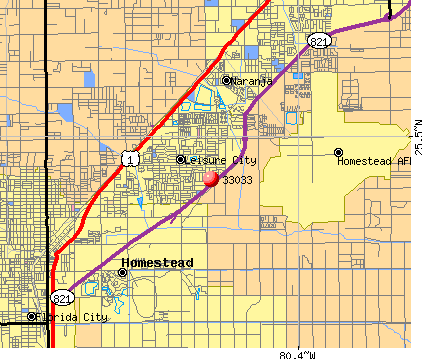
Notable locations in zip code 33033: Coral Castle (A), Young America Day Care Center (B), South Dade Child Care Center (C), South Dade Skill Center (D), Small Fry Day Care Center (E), Rcma South Dade Day Care Center (F), Modello Head Start & Child Care Center (G), Leisure City Elementary-YMCA Prime Time (H), Kids R Us Day Care Center (I), Gonzalez Day Care Center (J), Eighth Street Day Care Center (K), Countryside Early Learning Center (L), Berkshire Infant Care (M), Miami - Dade County Fire Rescue Station 6 (N), Homestead Air Reserve Base Fire Department (O). Display/hide their locations on the map
Churches in zip code 33033 include: B'nai Israel Synagogue (A), Leisure City Church (B), South Dade Alliance Church (C), Modello Baptist Church (D), Mission Bautista Nueva Nacimiento (E), Shalom Foursquare Gospel Church (F). Display/hide their locations on the map
Parks in zip code 33033 include: South Dade Park (1), Modello Wayside Park (2), Leisure Park (3), Leisure Lake Park (4), Palmland Park (5), Seminole Wayside Park (6). Display/hide their locations on the map
9,436 married couples with children.
8,968 single-parent households (1,583 men, 7,385 women).
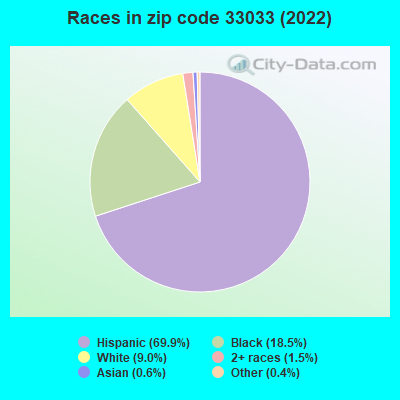
31.6% of residents of 33033 zip code speak English at home.
62.3% of residents speak Spanish at home (57% very well, 14% well, 16% not well, 12% not at all).
4.8% of residents speak other Indo-European language at home (71% very well, 23% well, 4% not well, 2% not at all).
0.4% of residents speak Asian or Pacific Island language at home (37% very well, 38% well, 25% not well).
0.9% of residents speak other language at home (63% very well, 23% well, 13% not well, 1% not at all).
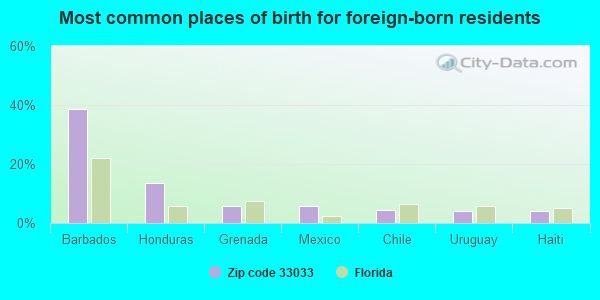
Foreign born population: 28,005 (40.0%) (57.0% of them are naturalized citizens)
This zip code:
40.0%
Whole state:
21.7%
39%Barbados
14%Honduras
6%Grenada
6%Mexico
4%Chile
4%Uruguay
4%Haiti
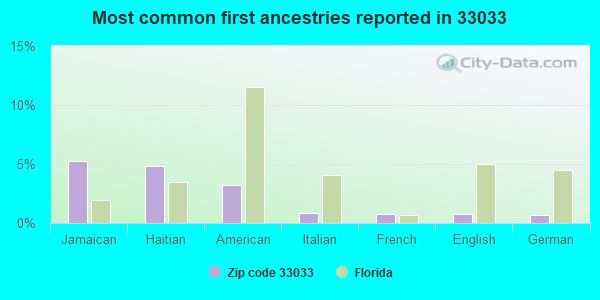
5%Jamaican
5%Haitian
3%American
1%Italian
1%French
1%English
1%German
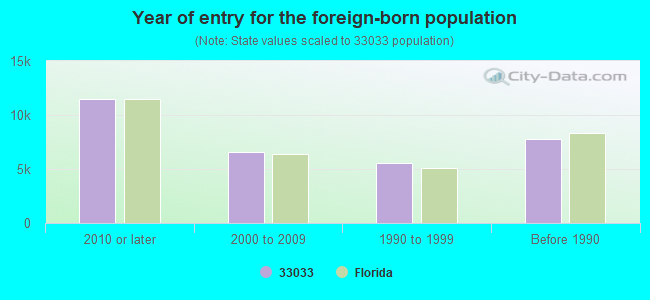
Year of entry for the foreign-born population
11,4572010 or later
6,5742000 to 2009
5,5601990 to 1999
7,753Before 1990
Facilities with environmental interests located in this zip code:
LEISURE CITY ELEMENTARY SCHOOL (14950 S.W. 288TH STREET in HOMESTEAD, FL)
(Geographic Names Information System) (National Center for Education Statistics) - STATE ID-2901 Organizations: DADE COUNTY SCHOOL DISTRICT (SCHOOL DISTRICT)
ASPIRA SOUTH YOUTH LEADERSHIP CHARTER SCHOOL (14112-14114 SW 288TH ST. in LEISURE CITY, FL)
(National Center for Education Statistics) - STATE ID-6060 Organizations: DADE COUNTY SCHOOL DISTRICT (SCHOOL DISTRICT)
SOUTH DADE SKILL CENTER (28300 S.W. 152ND AVENUE in LEISURE CITY, FL)
(National Center for Education Statistics) - STATE ID-8981 Organizations: DADE COUNTY SCHOOL DISTRICT (SCHOOL DISTRICT)
CIRCLE K #2384 (13300 SW 288TH STREET in HOMESTEAD, FL)
National Pollutant Discharge Elimination System NON-MAJOR (Tracking pollutant discharge elimination systems) - permit (Resource Conservation and Recovery Act (tracking hazardous waste)) Business SIC classification: GASOLINE SERVICE STATIONS Organizations: STEVE BELIN, MGR (CONTACT/OWNER)
Alternative names: CIRLE K STORE #2384
ARUBA AT OASIS - POD G (PACIFIC BLVD & SW 152ND AVE in HOMESTEAD, FL)
National Pollutant Discharge Elimination System NON-MAJOR (Tracking pollutant discharge elimination systems) - permit Organizations: CARLOS GONZALEZ (CONTACT/OWNER)
OASIS - PHASE 3 (SW 152ND AVE & MOWRY DR in HOMESTEAD, FL)
National Pollutant Discharge Elimination System NON-MAJOR (Tracking pollutant discharge elimination systems) - permit Organizations: ANTHONY SEIJAS (CONTACT/OWNER)
OASIS PHASE 1 (SW 152 AVE & MOWRY DR in HOMESTEAD, FL)
National Pollutant Discharge Elimination System NON-MAJOR (Tracking pollutant discharge elimination systems) - permit Organizations: ANTHONY SEIJAS (CONTACT/OWNER)
OASIS PLAZA (SW 152ND AVENUE AND SW 312TH S in HOMESTEAD, FL)
National Pollutant Discharge Elimination System NON-MAJOR (Tracking pollutant discharge elimination systems) - permit Organizations: LAZARO ELOSEGUI (CONTACT/OWNER)
Housing units lacking complete plumbing facilities: 0.3% Housing units lacking complete kitchen facilities: 0.4%
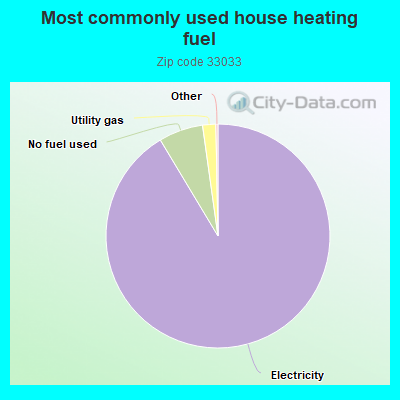
91.4%Electricity
6.4%No fuel used
1.9%Utility gas
Population in 1990: 25,439. Population change in the 1990s: +5,955 (+23.4%).
Place of birth for U.S.-born residents:
This state: 30,799
Northeast: 3,516
Midwest: 898
South: 2,511
West: 1,059
51% of the 33033 zip code residents lived in the same house 5 years ago. Out of people who lived in different houses, 82% lived in this county. Out of people who lived in different counties, 50% lived in Florida.
88% of the 33033 zip code residents lived in the same house 1 year ago. Out of people who lived in different houses, 70% moved from this county. Out of people who lived in different houses, 4% moved from different county within same state. Out of people who lived in different houses, 8% moved from different state. Out of people who lived in different houses, 11% moved from abroad.
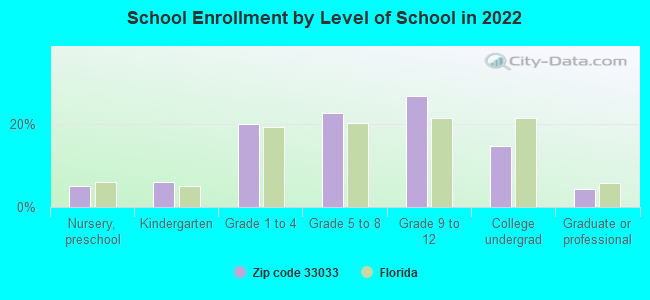
Private vs. public school enrollment:
Students in private schools in grades 1 to 8 (elementary and middle school): 1,086
Here:
12.0%
Florida:
15.8%
Students in private schools in grades 9 to 12 (high school): 382
Here:
6.8%
Florida:
12.9%
Students in private undergraduate colleges: 680
Here:
21.9%
Florida:
23.6%
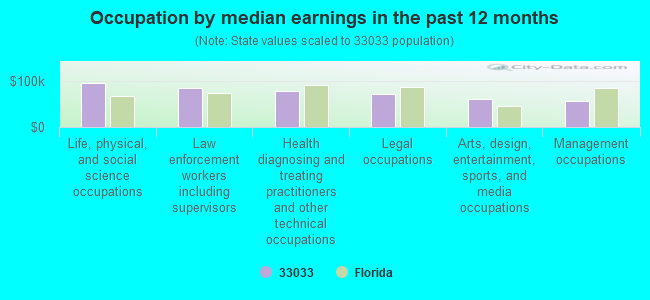
Occupation by median earnings in the past 12 months ($)
96,574Life, physical, and social science occupations
86,056Law enforcement workers including supervisors
79,787Health diagnosing and treating practitioners and other technical occupations
71,809Legal occupations
60,967Arts, design, entertainment, sports, and media occupations
57,291Management occupations
Companies with federal contracts located in this zip code:
PERIGEE ENVIROMENTAL, INC (14925 GARFIELD DRIVE in HOMESTEAD, FL; small business) : $72,480 in 2 contractsfrom 2003 to 2004
$42,720 with Navy for Other Professional Services. Signed on 2003-03-17. Completion date: 2003-04-30.
$29,760, same as above.Signed on 2004-04-08. Completion date: 2004-10-05.
J A M ENTERPRISES (15501 SW 298 TERR in HOMESTEAD, FL; small business) : $27,050 in 6 contractsfrom 2005 to 2006
Contracts for Electrical Hardware and Supplies, Switches, Hardware, Commercial, Relays and Solenoids, and moreby Defense Logistics Agency Signed by year:2000: $0; 2001: $0; 2002: $0; 2003: $0; 2004: $0; 2005: $20,537; 2006: $6,513.
Biggest contracts:
$11,837 with Defense Logistics Agency for Electrical Hardware and Supplies. Signed on 2005-09-20. Completion date: 2005-10-20.
$3,601 with Defense Logistics Agency for Switches. Signed on 2006-06-09. Completion date: 2006-07-12.
$2,912 with Defense Logistics Agency for Hardware, Commercial. Taking place in WI. Signed on 2006-06-06. Completion date: 2006-07-06.
$2,900 with Defense Logistics Agency for Relays and Solenoids. Signed on 2005-02-03. Completion date: 2005-02-24.
SPITZER DODGE INC (30101 S DIXIE HWY in HOMESTEAD, FL; small business)
$7,210 with Navy for Maintenance, Repair and Rebuilding of Equipment -- Ground Effect Vehicles, Motor Vehicles, Trailers, and Cycles. Signed on 2005-02-02. Completion date: 2005-02-15.
Top industries in this zip code by the number of employees in 2005:
Construction: Other Building Finishing Contractors (100-249 employees: 1 establishment, 1-4 employees: 1 establishment)
Health Care and Social Assistance: Child Day Care Services (20-49: 2, 10-19: 5, 5-9: 2, 1-4: 2)
2008 - 2018 National Fire Incident Reporting System (NFIRS) incidents
According to the data from the years 2008 - 2018 the average number of fire incidents per year is 108. The highest number of reported fires - 181 took place in 2008, and the least - 63 in 2016. The data has a dropping trend.
When looking into fire subcategories, the most reports belonged to: Outside Fires (47.9%), and Structure Fires (30.9%).
Fire incident types reported to NFIRS in Zip Code 33033


+$4,929
-$6,005
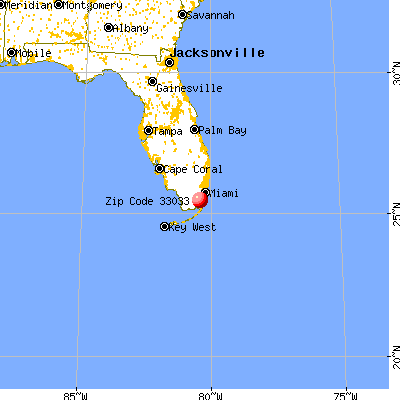
 Nearest zip codes: 33039, 33032, 33035, 33170, 33031, 33030.
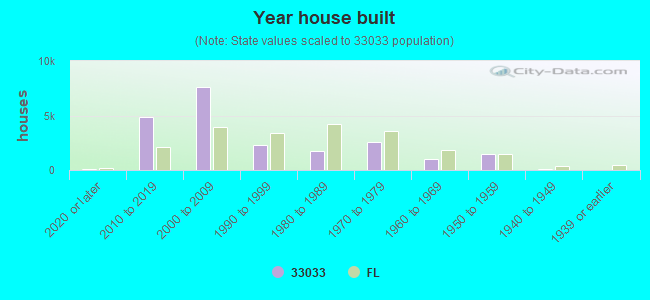


 According to the data from the years 2008 - 2018 the average number of fire incidents per year is 108. The highest number of reported fires - 181 took place in 2008, and the least - 63 in 2016. The data has a dropping trend.
 When looking into fire subcategories, the most reports belonged to: Outside Fires (47.9%), and Structure Fires (30.9%).