Estimated zip code population in 2022: 35,722
Zip code population in 2010: 36,066
Zip code population in 2000: 35,712
Houses and condos: 16,173
Renter-occupied apartments: 11,997
% of renters here:
79%State:
33%
March 2022 cost of living index in zip code 33135: 110.4
(more than average, U.S. average is 100)
Land area: 2.2
sq. mi.
Water area: 0.0
sq. mi.
Population density: 16,566 people per square mile (very high).
OSM Map
General Map
Google Map
MSN Map
OSM Map
General Map
Google Map
MSN Map
OSM Map
General Map
Google Map
MSN Map
OSM Map
General Map
Google Map
MSN Map
Please wait while loading the map...
Real estate property taxes paid for housing units in 2022:
This zip code:
0.7% ($2,955)Florida:
0.7% ($2,529)
Median real estate property taxes paid for housing units with mortgages in 2022: $3,709 (0.8%)
Median real estate property taxes paid for housing units with no mortgage in 2022: $2,544 (0.6%)
Profiles of local businesses
Business Search - 14 Million verified businesses
Males: 18,865 Females: 16,858
For population 25 years and over in 33135:
High school or higher: 69.3%Bachelor's degree or higher: 21.0%Graduate or professional degree: 6.1%Unemployed: 4.0%Mean travel time to work (commute): 31.3 minutes
For population 15 years and over in 33135:
Never married: 37.2%Now married: 38.8%Separated: 3.7%Widowed: 7.1%Divorced: 13.1%
Zip code 33135 compared to state average:
Median household income below state average. Black race population percentage significantly below state average. Hispanic race population percentage significantly above state average. Foreign-born population percentage significantly above state average. Renting percentage significantly above state average. Length of stay since moving in significantly above state average. Number of rooms per house below state average. House age significantly above state average. Percentage of population with a bachelor's degree or higher below state average. 33,728 94.4% Hispanic or Latino 1,235 3.5% White 494 1.4% Black 120 0.3% Asian 96 0.3% Two or more races 22 0.06% American Indian 23 0.06% Some other race
Data:
Median household income ($)
Median household income (% change since 2000)
Household income diversity
Ratio of average income to average house value (%)
Ratio of average income to average rent
Median household income ($) - White
Median household income ($) - Black or African American
Median household income ($) - Asian
Median household income ($) - Hispanic or Latino
Median household income ($) - American Indian and Alaska Native
Median household income ($) - Multirace
Median household income ($) - Other Race
Median household income for houses/condos with a mortgage ($)
Median household income for apartments without a mortgage ($)
Races - White alone (%)
Races - White alone (% change since 2000)
Races - Black alone (%)
Races - Black alone (% change since 2000)
Races - American Indian alone (%)
Races - American Indian alone (% change since 2000)
Races - Asian alone (%)
Races - Asian alone (% change since 2000)
Races - Hispanic (%)
Races - Hispanic (% change since 2000)
Races - Native Hawaiian and Other Pacific Islander alone (%)
Races - Native Hawaiian and Other Pacific Islander alone (% change since 2000)
Races - Two or more races (%)
Races - Two or more races (% change since 2000)
Races - Other race alone (%)
Races - Other race alone (% change since 2000)
Racial diversity
Unemployment (%)
Unemployment (% change since 2000)
Unemployment (%) - White
Unemployment (%) - Black or African American
Unemployment (%) - Asian
Unemployment (%) - Hispanic or Latino
Unemployment (%) - American Indian and Alaska Native
Unemployment (%) - Multirace
Unemployment (%) - Other Race
Population density (people per square mile)
Population - Males (%)
Population - Females (%)
Population - Males (%) - White
Population - Males (%) - Black or African American
Population - Males (%) - Asian
Population - Males (%) - Hispanic or Latino
Population - Males (%) - American Indian and Alaska Native
Population - Males (%) - Multirace
Population - Males (%) - Other Race
Population - Females (%) - White
Population - Females (%) - Black or African American
Population - Females (%) - Asian
Population - Females (%) - Hispanic or Latino
Population - Females (%) - American Indian and Alaska Native
Population - Females (%) - Multirace
Population - Females (%) - Other Race
Coronavirus confirmed cases (Apr 27, 2024)
Deaths caused by coronavirus (Apr 27, 2024)
Coronavirus confirmed cases (per 100k population) (Apr 27, 2024)
Deaths caused by coronavirus (per 100k population) (Apr 27, 2024)
Daily increase in number of cases (Apr 27, 2024)
Weekly increase in number of cases (Apr 27, 2024)
Cases doubled (in days) (Apr 27, 2024)
Hospitalized patients (Apr 18, 2022)
Negative test results (Apr 18, 2022)
Total test results (Apr 18, 2022)
COVID Vaccine doses distributed (per 100k population) (Sep 19, 2023)
COVID Vaccine doses administered (per 100k population) (Sep 19, 2023)
COVID Vaccine doses distributed (Sep 19, 2023)
COVID Vaccine doses administered (Sep 19, 2023)
Likely homosexual households (%)
Likely homosexual households (% change since 2000)
Likely homosexual households - Lesbian couples (%)
Likely homosexual households - Lesbian couples (% change since 2000)
Likely homosexual households - Gay men (%)
Likely homosexual households - Gay men (% change since 2000)
Cost of living index
Median gross rent ($)
Median contract rent ($)
Median monthly housing costs ($)
Median house or condo value ($)
Median house or condo value ($ change since 2000)
Mean house or condo value by units in structure - 1, detached ($)
Mean house or condo value by units in structure - 1, attached ($)
Mean house or condo value by units in structure - 2 ($)
Mean house or condo value by units in structure by units in structure - 3 or 4 ($)
Mean house or condo value by units in structure - 5 or more ($)
Mean house or condo value by units in structure - Boat, RV, van, etc. ($)
Mean house or condo value by units in structure - Mobile home ($)
Median house or condo value ($) - White
Median house or condo value ($) - Black or African American
Median house or condo value ($) - Asian
Median house or condo value ($) - Hispanic or Latino
Median house or condo value ($) - American Indian and Alaska Native
Median house or condo value ($) - Multirace
Median house or condo value ($) - Other Race
Median resident age
Resident age diversity
Median resident age - Males
Median resident age - Females
Median resident age - White
Median resident age - Black or African American
Median resident age - Asian
Median resident age - Hispanic or Latino
Median resident age - American Indian and Alaska Native
Median resident age - Multirace
Median resident age - Other Race
Median resident age - Males - White
Median resident age - Males - Black or African American
Median resident age - Males - Asian
Median resident age - Males - Hispanic or Latino
Median resident age - Males - American Indian and Alaska Native
Median resident age - Males - Multirace
Median resident age - Males - Other Race
Median resident age - Females - White
Median resident age - Females - Black or African American
Median resident age - Females - Asian
Median resident age - Females - Hispanic or Latino
Median resident age - Females - American Indian and Alaska Native
Median resident age - Females - Multirace
Median resident age - Females - Other Race
Commute - mean travel time to work (minutes)
Travel time to work - Less than 5 minutes (%)
Travel time to work - Less than 5 minutes (% change since 2000)
Travel time to work - 5 to 9 minutes (%)
Travel time to work - 5 to 9 minutes (% change since 2000)
Travel time to work - 10 to 19 minutes (%)
Travel time to work - 10 to 19 minutes (% change since 2000)
Travel time to work - 20 to 29 minutes (%)
Travel time to work - 20 to 29 minutes (% change since 2000)
Travel time to work - 30 to 39 minutes (%)
Travel time to work - 30 to 39 minutes (% change since 2000)
Travel time to work - 40 to 59 minutes (%)
Travel time to work - 40 to 59 minutes (% change since 2000)
Travel time to work - 60 to 89 minutes (%)
Travel time to work - 60 to 89 minutes (% change since 2000)
Travel time to work - 90 or more minutes (%)
Travel time to work - 90 or more minutes (% change since 2000)
Marital status - Never married (%)
Marital status - Now married (%)
Marital status - Separated (%)
Marital status - Widowed (%)
Marital status - Divorced (%)
Median family income ($)
Median family income (% change since 2000)
Median non-family income ($)
Median non-family income (% change since 2000)
Median per capita income ($)
Median per capita income (% change since 2000)
Median family income ($) - White
Median family income ($) - Black or African American
Median family income ($) - Asian
Median family income ($) - Hispanic or Latino
Median family income ($) - American Indian and Alaska Native
Median family income ($) - Multirace
Median family income ($) - Other Race
Median year house/condo built
Median year apartment built
Year house built - Built 2005 or later (%)
Year house built - Built 2000 to 2004 (%)
Year house built - Built 1990 to 1999 (%)
Year house built - Built 1980 to 1989 (%)
Year house built - Built 1970 to 1979 (%)
Year house built - Built 1960 to 1969 (%)
Year house built - Built 1950 to 1959 (%)
Year house built - Built 1940 to 1949 (%)
Year house built - Built 1939 or earlier (%)
Average household size
Household density (households per square mile)
Average household size - White
Average household size - Black or African American
Average household size - Asian
Average household size - Hispanic or Latino
Average household size - American Indian and Alaska Native
Average household size - Multirace
Average household size - Other Race
Occupied housing units (%)
Vacant housing units (%)
Owner occupied housing units (%)
Renter occupied housing units (%)
Vacancy status - For rent (%)
Vacancy status - For sale only (%)
Vacancy status - Rented or sold, not occupied (%)
Vacancy status - For seasonal, recreational, or occasional use (%)
Vacancy status - For migrant workers (%)
Vacancy status - Other vacant (%)
Residents with income below the poverty level (%)
Residents with income below 50% of the poverty level (%)
Children below poverty level (%)
Poor families by family type - Married-couple family (%)
Poor families by family type - Male, no wife present (%)
Poor families by family type - Female, no husband present (%)
Poverty status for native-born residents (%)
Poverty status for foreign-born residents (%)
Poverty among high school graduates not in families (%)
Poverty among people who did not graduate high school not in families (%)
Residents with income below the poverty level (%) - White
Residents with income below the poverty level (%) - Black or African American
Residents with income below the poverty level (%) - Asian
Residents with income below the poverty level (%) - Hispanic or Latino
Residents with income below the poverty level (%) - American Indian and Alaska Native
Residents with income below the poverty level (%) - Multirace
Residents with income below the poverty level (%) - Other Race
Air pollution - Air Quality Index (AQI)
Air pollution - CO
Air pollution - NO2
Air pollution - SO2
Air pollution - Ozone
Air pollution - PM10
Air pollution - PM25
Air pollution - Pb
Crime - Murders per 100,000 population
Crime - Rapes per 100,000 population
Crime - Robberies per 100,000 population
Crime - Assaults per 100,000 population
Crime - Burglaries per 100,000 population
Crime - Thefts per 100,000 population
Crime - Auto thefts per 100,000 population
Crime - Arson per 100,000 population
Crime - City-data.com crime index
Crime - Violent crime index
Crime - Property crime index
Crime - Murders per 100,000 population (5 year average)
Crime - Rapes per 100,000 population (5 year average)
Crime - Robberies per 100,000 population (5 year average)
Crime - Assaults per 100,000 population (5 year average)
Crime - Burglaries per 100,000 population (5 year average)
Crime - Thefts per 100,000 population (5 year average)
Crime - Auto thefts per 100,000 population (5 year average)
Crime - Arson per 100,000 population (5 year average)
Crime - City-data.com crime index (5 year average)
Crime - Violent crime index (5 year average)
Crime - Property crime index (5 year average)
1996 Presidential Elections Results (%) - Democratic Party (Clinton)
1996 Presidential Elections Results (%) - Republican Party (Dole)
1996 Presidential Elections Results (%) - Other
2000 Presidential Elections Results (%) - Democratic Party (Gore)
2000 Presidential Elections Results (%) - Republican Party (Bush)
2000 Presidential Elections Results (%) - Other
2004 Presidential Elections Results (%) - Democratic Party (Kerry)
2004 Presidential Elections Results (%) - Republican Party (Bush)
2004 Presidential Elections Results (%) - Other
2008 Presidential Elections Results (%) - Democratic Party (Obama)
2008 Presidential Elections Results (%) - Republican Party (McCain)
2008 Presidential Elections Results (%) - Other
2012 Presidential Elections Results (%) - Democratic Party (Obama)
2012 Presidential Elections Results (%) - Republican Party (Romney)
2012 Presidential Elections Results (%) - Other
2016 Presidential Elections Results (%) - Democratic Party (Clinton)
2016 Presidential Elections Results (%) - Republican Party (Trump)
2016 Presidential Elections Results (%) - Other
2020 Presidential Elections Results (%) - Democratic Party (Biden)
2020 Presidential Elections Results (%) - Republican Party (Trump)
2020 Presidential Elections Results (%) - Other
Ancestries Reported - Arab (%)
Ancestries Reported - Czech (%)
Ancestries Reported - Danish (%)
Ancestries Reported - Dutch (%)
Ancestries Reported - English (%)
Ancestries Reported - French (%)
Ancestries Reported - French Canadian (%)
Ancestries Reported - German (%)
Ancestries Reported - Greek (%)
Ancestries Reported - Hungarian (%)
Ancestries Reported - Irish (%)
Ancestries Reported - Italian (%)
Ancestries Reported - Lithuanian (%)
Ancestries Reported - Norwegian (%)
Ancestries Reported - Polish (%)
Ancestries Reported - Portuguese (%)
Ancestries Reported - Russian (%)
Ancestries Reported - Scotch-Irish (%)
Ancestries Reported - Scottish (%)
Ancestries Reported - Slovak (%)
Ancestries Reported - Subsaharan African (%)
Ancestries Reported - Swedish (%)
Ancestries Reported - Swiss (%)
Ancestries Reported - Ukrainian (%)
Ancestries Reported - United States (%)
Ancestries Reported - Welsh (%)
Ancestries Reported - West Indian (%)
Ancestries Reported - Other (%)
Educational Attainment - No schooling completed (%)
Educational Attainment - Less than high school (%)
Educational Attainment - High school or equivalent (%)
Educational Attainment - Less than 1 year of college (%)
Educational Attainment - 1 or more years of college (%)
Educational Attainment - Associate degree (%)
Educational Attainment - Bachelor's degree (%)
Educational Attainment - Master's degree (%)
Educational Attainment - Professional school degree (%)
Educational Attainment - Doctorate degree (%)
School Enrollment - Nursery, preschool (%)
School Enrollment - Kindergarten (%)
School Enrollment - Grade 1 to 4 (%)
School Enrollment - Grade 5 to 8 (%)
School Enrollment - Grade 9 to 12 (%)
School Enrollment - College undergrad (%)
School Enrollment - Graduate or professional (%)
School Enrollment - Not enrolled in school (%)
School enrollment - Public schools (%)
School enrollment - Private schools (%)
School enrollment - Not enrolled (%)
Median number of rooms in houses and condos
Median number of rooms in apartments
Housing units lacking complete plumbing facilities (%)
Housing units lacking complete kitchen facilities (%)
Density of houses
Urban houses (%)
Rural houses (%)
Households with people 60 years and over (%)
Households with people 65 years and over (%)
Households with people 75 years and over (%)
Households with one or more nonrelatives (%)
Households with no nonrelatives (%)
Population in households (%)
Family households (%)
Nonfamily households (%)
Population in families (%)
Family households with own children (%)
Median number of bedrooms in owner occupied houses
Mean number of bedrooms in owner occupied houses
Median number of bedrooms in renter occupied houses
Mean number of bedrooms in renter occupied houses
Median number of vehichles in owner occupied houses
Mean number of vehichles in owner occupied houses
Median number of vehichles in renter occupied houses
Mean number of vehichles in renter occupied houses
Mortgage status - with mortgage (%)
Mortgage status - with second mortgage (%)
Mortgage status - with home equity loan (%)
Mortgage status - with both second mortgage and home equity loan (%)
Mortgage status - without a mortgage (%)
Average family size
Average family size - White
Average family size - Black or African American
Average family size - Asian
Average family size - Hispanic or Latino
Average family size - American Indian and Alaska Native
Average family size - Multirace
Average family size - Other Race
Geographical mobility - Same house 1 year ago (%)
Geographical mobility - Moved within same county (%)
Geographical mobility - Moved from different county within same state (%)
Geographical mobility - Moved from different state (%)
Geographical mobility - Moved from abroad (%)
Place of birth - Born in state of residence (%)
Place of birth - Born in other state (%)
Place of birth - Native, outside of US (%)
Place of birth - Foreign born (%)
Housing units in structures - 1, detached (%)
Housing units in structures - 1, attached (%)
Housing units in structures - 2 (%)
Housing units in structures - 3 or 4 (%)
Housing units in structures - 5 to 9 (%)
Housing units in structures - 10 to 19 (%)
Housing units in structures - 20 to 49 (%)
Housing units in structures - 50 or more (%)
Housing units in structures - Mobile home (%)
Housing units in structures - Boat, RV, van, etc. (%)
House/condo owner moved in on average (years ago)
Renter moved in on average (years ago)
Year householder moved into unit - Moved in 1999 to March 2000 (%)
Year householder moved into unit - Moved in 1995 to 1998 (%)
Year householder moved into unit - Moved in 1990 to 1994 (%)
Year householder moved into unit - Moved in 1980 to 1989 (%)
Year householder moved into unit - Moved in 1970 to 1979 (%)
Year householder moved into unit - Moved in 1969 or earlier (%)
Means of transportation to work - Drove car alone (%)
Means of transportation to work - Carpooled (%)
Means of transportation to work - Public transportation (%)
Means of transportation to work - Bus or trolley bus (%)
Means of transportation to work - Streetcar or trolley car (%)
Means of transportation to work - Subway or elevated (%)
Means of transportation to work - Railroad (%)
Means of transportation to work - Ferryboat (%)
Means of transportation to work - Taxicab (%)
Means of transportation to work - Motorcycle (%)
Means of transportation to work - Bicycle (%)
Means of transportation to work - Walked (%)
Means of transportation to work - Other means (%)
Working at home (%)
Industry diversity
Most Common Industries - Agriculture, forestry, fishing and hunting, and mining (%)
Most Common Industries - Agriculture, forestry, fishing and hunting (%)
Most Common Industries - Mining, quarrying, and oil and gas extraction (%)
Most Common Industries - Construction (%)
Most Common Industries - Manufacturing (%)
Most Common Industries - Wholesale trade (%)
Most Common Industries - Retail trade (%)
Most Common Industries - Transportation and warehousing, and utilities (%)
Most Common Industries - Transportation and warehousing (%)
Most Common Industries - Utilities (%)
Most Common Industries - Information (%)
Most Common Industries - Finance and insurance, and real estate and rental and leasing (%)
Most Common Industries - Finance and insurance (%)
Most Common Industries - Real estate and rental and leasing (%)
Most Common Industries - Professional, scientific, and management, and administrative and waste management services (%)
Most Common Industries - Professional, scientific, and technical services (%)
Most Common Industries - Management of companies and enterprises (%)
Most Common Industries - Administrative and support and waste management services (%)
Most Common Industries - Educational services, and health care and social assistance (%)
Most Common Industries - Educational services (%)
Most Common Industries - Health care and social assistance (%)
Most Common Industries - Arts, entertainment, and recreation, and accommodation and food services (%)
Most Common Industries - Arts, entertainment, and recreation (%)
Most Common Industries - Accommodation and food services (%)
Most Common Industries - Other services, except public administration (%)
Most Common Industries - Public administration (%)
Occupation diversity
Most Common Occupations - Management, business, science, and arts occupations (%)
Most Common Occupations - Management, business, and financial occupations (%)
Most Common Occupations - Management occupations (%)
Most Common Occupations - Business and financial operations occupations (%)
Most Common Occupations - Computer, engineering, and science occupations (%)
Most Common Occupations - Computer and mathematical occupations (%)
Most Common Occupations - Architecture and engineering occupations (%)
Most Common Occupations - Life, physical, and social science occupations (%)
Most Common Occupations - Education, legal, community service, arts, and media occupations (%)
Most Common Occupations - Community and social service occupations (%)
Most Common Occupations - Legal occupations (%)
Most Common Occupations - Education, training, and library occupations (%)
Most Common Occupations - Arts, design, entertainment, sports, and media occupations (%)
Most Common Occupations - Healthcare practitioners and technical occupations (%)
Most Common Occupations - Health diagnosing and treating practitioners and other technical occupations (%)
Most Common Occupations - Health technologists and technicians (%)
Most Common Occupations - Service occupations (%)
Most Common Occupations - Healthcare support occupations (%)
Most Common Occupations - Protective service occupations (%)
Most Common Occupations - Fire fighting and prevention, and other protective service workers including supervisors (%)
Most Common Occupations - Law enforcement workers including supervisors (%)
Most Common Occupations - Food preparation and serving related occupations (%)
Most Common Occupations - Building and grounds cleaning and maintenance occupations (%)
Most Common Occupations - Personal care and service occupations (%)
Most Common Occupations - Sales and office occupations (%)
Most Common Occupations - Sales and related occupations (%)
Most Common Occupations - Office and administrative support occupations (%)
Most Common Occupations - Natural resources, construction, and maintenance occupations (%)
Most Common Occupations - Farming, fishing, and forestry occupations (%)
Most Common Occupations - Construction and extraction occupations (%)
Most Common Occupations - Installation, maintenance, and repair occupations (%)
Most Common Occupations - Production, transportation, and material moving occupations (%)
Most Common Occupations - Production occupations (%)
Most Common Occupations - Transportation occupations (%)
Most Common Occupations - Material moving occupations (%)
People in Group quarters - Institutionalized population (%)
People in Group quarters - Correctional institutions (%)
People in Group quarters - Federal prisons and detention centers (%)
People in Group quarters - Halfway houses (%)
People in Group quarters - Local jails and other confinement facilities (including police lockups) (%)
People in Group quarters - Military disciplinary barracks (%)
People in Group quarters - State prisons (%)
People in Group quarters - Other types of correctional institutions (%)
People in Group quarters - Nursing homes (%)
People in Group quarters - Hospitals/wards, hospices, and schools for the handicapped (%)
People in Group quarters - Hospitals/wards and hospices for chronically ill (%)
People in Group quarters - Hospices or homes for chronically ill (%)
People in Group quarters - Military hospitals or wards for chronically ill (%)
People in Group quarters - Other hospitals or wards for chronically ill (%)
People in Group quarters - Hospitals or wards for drug/alcohol abuse (%)
People in Group quarters - Mental (Psychiatric) hospitals or wards (%)
People in Group quarters - Schools, hospitals, or wards for the mentally retarded (%)
People in Group quarters - Schools, hospitals, or wards for the physically handicapped (%)
People in Group quarters - Institutions for the deaf (%)
People in Group quarters - Institutions for the blind (%)
People in Group quarters - Orthopedic wards and institutions for the physically handicapped (%)
People in Group quarters - Wards in general hospitals for patients who have no usual home elsewhere (%)
People in Group quarters - Wards in military hospitals for patients who have no usual home elsewhere (%)
People in Group quarters - Juvenile institutions (%)
People in Group quarters - Long-term care (%)
People in Group quarters - Homes for abused, dependent, and neglected children (%)
People in Group quarters - Residential treatment centers for emotionally disturbed children (%)
People in Group quarters - Training schools for juvenile delinquents (%)
People in Group quarters - Short-term care, detention or diagnostic centers for delinquent children (%)
People in Group quarters - Type of juvenile institution unknown (%)
People in Group quarters - Noninstitutionalized population (%)
People in Group quarters - College dormitories (includes college quarters off campus) (%)
People in Group quarters - Military quarters (%)
People in Group quarters - On base (%)
People in Group quarters - Barracks, unaccompanied personnel housing (UPH), (Enlisted/Officer), ;and similar group living quarters for military personnel (%)
People in Group quarters - Transient quarters for temporary residents (%)
People in Group quarters - Military ships (%)
People in Group quarters - Group homes (%)
People in Group quarters - Homes or halfway houses for drug/alcohol abuse (%)
People in Group quarters - Homes for the mentally ill (%)
People in Group quarters - Homes for the mentally retarded (%)
People in Group quarters - Homes for the physically handicapped (%)
People in Group quarters - Other group homes (%)
People in Group quarters - Religious group quarters (%)
People in Group quarters - Dormitories (%)
People in Group quarters - Agriculture workers' dormitories on farms (%)
People in Group quarters - Job Corps and vocational training facilities (%)
People in Group quarters - Other workers' dormitories (%)
People in Group quarters - Crews of maritime vessels (%)
People in Group quarters - Other nonhousehold living situations (%)
People in Group quarters - Other noninstitutional group quarters (%)
Residents speaking English at home (%)
Residents speaking English at home - Born in the United States (%)
Residents speaking English at home - Native, born elsewhere (%)
Residents speaking English at home - Foreign born (%)
Residents speaking Spanish at home (%)
Residents speaking Spanish at home - Born in the United States (%)
Residents speaking Spanish at home - Native, born elsewhere (%)
Residents speaking Spanish at home - Foreign born (%)
Residents speaking other language at home (%)
Residents speaking other language at home - Born in the United States (%)
Residents speaking other language at home - Native, born elsewhere (%)
Residents speaking other language at home - Foreign born (%)
Class of Workers - Employee of private company (%)
Class of Workers - Self-employed in own incorporated business (%)
Class of Workers - Private not-for-profit wage and salary workers (%)
Class of Workers - Local government workers (%)
Class of Workers - State government workers (%)
Class of Workers - Federal government workers (%)
Class of Workers - Self-employed workers in own not incorporated business and Unpaid family workers (%)
House heating fuel used in houses and condos - Utility gas (%)
House heating fuel used in houses and condos - Bottled, tank, or LP gas (%)
House heating fuel used in houses and condos - Electricity (%)
House heating fuel used in houses and condos - Fuel oil, kerosene, etc. (%)
House heating fuel used in houses and condos - Coal or coke (%)
House heating fuel used in houses and condos - Wood (%)
House heating fuel used in houses and condos - Solar energy (%)
House heating fuel used in houses and condos - Other fuel (%)
House heating fuel used in houses and condos - No fuel used (%)
House heating fuel used in apartments - Utility gas (%)
House heating fuel used in apartments - Bottled, tank, or LP gas (%)
House heating fuel used in apartments - Electricity (%)
House heating fuel used in apartments - Fuel oil, kerosene, etc. (%)
House heating fuel used in apartments - Coal or coke (%)
House heating fuel used in apartments - Wood (%)
House heating fuel used in apartments - Solar energy (%)
House heating fuel used in apartments - Other fuel (%)
House heating fuel used in apartments - No fuel used (%)
Armed forces status - In Armed Forces (%)
Armed forces status - Civilian (%)
Armed forces status - Civilian - Veteran (%)
Armed forces status - Civilian - Nonveteran (%)
Fatal accidents locations in years 2005-2021
Fatal accidents locations in 2005
Fatal accidents locations in 2006
Fatal accidents locations in 2007
Fatal accidents locations in 2008
Fatal accidents locations in 2009
Fatal accidents locations in 2010
Fatal accidents locations in 2011
Fatal accidents locations in 2012
Fatal accidents locations in 2013
Fatal accidents locations in 2014
Fatal accidents locations in 2015
Fatal accidents locations in 2016
Fatal accidents locations in 2017
Fatal accidents locations in 2018
Fatal accidents locations in 2019
Fatal accidents locations in 2020
Fatal accidents locations in 2021
Alcohol use - People drinking some alcohol every month (%)
Alcohol use - People not drinking at all (%)
Alcohol use - Average days/month drinking alcohol
Alcohol use - Average drinks/week
Alcohol use - Average days/year people drink much
Audiometry - Average condition of hearing (%)
Audiometry - People that can hear a whisper from across a quiet room (%)
Audiometry - People that can hear normal voice from across a quiet room (%)
Audiometry - Ears ringing, roaring, buzzing (%)
Audiometry - Had a job exposure to loud noise (%)
Audiometry - Had off-work exposure to loud noise (%)
Blood Pressure & Cholesterol - Has high blood pressure (%)
Blood Pressure & Cholesterol - Checking blood pressure at home (%)
Blood Pressure & Cholesterol - Frequently checking blood cholesterol (%)
Blood Pressure & Cholesterol - Has high cholesterol level (%)
Consumer Behavior - Money monthly spent on food at supermarket/grocery store
Consumer Behavior - Money monthly spent on food at other stores
Consumer Behavior - Money monthly spent on eating out
Consumer Behavior - Money monthly spent on carryout/delivered foods
Consumer Behavior - Income spent on food at supermarket/grocery store (%)
Consumer Behavior - Income spent on food at other stores (%)
Consumer Behavior - Income spent on eating out (%)
Consumer Behavior - Income spent on carryout/delivered foods (%)
Current Health Status - General health condition (%)
Current Health Status - Blood donors (%)
Current Health Status - Has blood ever tested for HIV virus (%)
Current Health Status - Left-handed people (%)
Dermatology - People using sunscreen (%)
Diabetes - Diabetics (%)
Diabetes - Had a blood test for high blood sugar (%)
Diabetes - People taking insulin (%)
Diet Behavior & Nutrition - Diet health (%)
Diet Behavior & Nutrition - Milk product consumption (# of products/month)
Diet Behavior & Nutrition - Meals not home prepared (#/week)
Diet Behavior & Nutrition - Meals from fast food or pizza place (#/week)
Diet Behavior & Nutrition - Ready-to-eat foods (#/month)
Diet Behavior & Nutrition - Frozen meals/pizza (#/month)
Drug Use - People that ever used marijuana or hashish (%)
Drug Use - Ever used hard drugs (%)
Drug Use - Ever used any form of cocaine (%)
Drug Use - Ever used heroin (%)
Drug Use - Ever used methamphetamine (%)
Health Insurance - People covered by health insurance (%)
Kidney Conditions-Urology - Avg. # of times urinating at night
Medical Conditions - People with asthma (%)
Medical Conditions - People with anemia (%)
Medical Conditions - People with psoriasis (%)
Medical Conditions - People with overweight (%)
Medical Conditions - Elderly people having difficulties in thinking or remembering (%)
Medical Conditions - People who ever received blood transfusion (%)
Medical Conditions - People having trouble seeing even with glass/contacts (%)
Medical Conditions - People with arthritis (%)
Medical Conditions - People with gout (%)
Medical Conditions - People with congestive heart failure (%)
Medical Conditions - People with coronary heart disease (%)
Medical Conditions - People with angina pectoris (%)
Medical Conditions - People who ever had heart attack (%)
Medical Conditions - People who ever had stroke (%)
Medical Conditions - People with emphysema (%)
Medical Conditions - People with thyroid problem (%)
Medical Conditions - People with chronic bronchitis (%)
Medical Conditions - People with any liver condition (%)
Medical Conditions - People who ever had cancer or malignancy (%)
Mental Health - People who have little interest in doing things (%)
Mental Health - People feeling down, depressed, or hopeless (%)
Mental Health - People who have trouble sleeping or sleeping too much (%)
Mental Health - People feeling tired or having little energy (%)
Mental Health - People with poor appetite or overeating (%)
Mental Health - People feeling bad about themself (%)
Mental Health - People who have trouble concentrating on things (%)
Mental Health - People moving or speaking slowly or too fast (%)
Mental Health - People having thoughts they would be better off dead (%)
Oral Health - Average years since last visit a dentist
Oral Health - People embarrassed because of mouth (%)
Oral Health - People with gum disease (%)
Oral Health - General health of teeth and gums (%)
Oral Health - Average days a week using dental floss/device
Oral Health - Average days a week using mouthwash for dental problem
Oral Health - Average number of teeth
Pesticide Use - Households using pesticides to control insects (%)
Pesticide Use - Households using pesticides to kill weeds (%)
Physical Activity - People doing vigorous-intensity work activities (%)
Physical Activity - People doing moderate-intensity work activities (%)
Physical Activity - People walking or bicycling (%)
Physical Activity - People doing vigorous-intensity recreational activities (%)
Physical Activity - People doing moderate-intensity recreational activities (%)
Physical Activity - Average hours a day doing sedentary activities
Physical Activity - Average hours a day watching TV or videos
Physical Activity - Average hours a day using computer
Physical Functioning - People having limitations keeping them from working (%)
Physical Functioning - People limited in amount of work they can do (%)
Physical Functioning - People that need special equipment to walk (%)
Physical Functioning - People experiencing confusion/memory problems (%)
Physical Functioning - People requiring special healthcare equipment (%)
Prescription Medications - Average number of prescription medicines taking
Preventive Aspirin Use - Adults 40+ taking low-dose aspirin (%)
Reproductive Health - Vaginal deliveries (%)
Reproductive Health - Cesarean deliveries (%)
Reproductive Health - Deliveries resulted in a live birth (%)
Reproductive Health - Pregnancies resulted in a delivery (%)
Reproductive Health - Women breastfeeding newborns (%)
Reproductive Health - Women that had a hysterectomy (%)
Reproductive Health - Women that had both ovaries removed (%)
Reproductive Health - Women that have ever taken birth control pills (%)
Reproductive Health - Women taking birth control pills (%)
Reproductive Health - Women that have ever used Depo-Provera or injectables (%)
Reproductive Health - Women that have ever used female hormones (%)
Sexual Behavior - People 18+ that ever had sex (vaginal, anal, or oral) (%)
Sexual Behavior - Males 18+ that ever had vaginal sex with a woman (%)
Sexual Behavior - Males 18+ that ever performed oral sex on a woman (%)
Sexual Behavior - Males 18+ that ever had anal sex with a woman (%)
Sexual Behavior - Males 18+ that ever had any sex with a man (%)
Sexual Behavior - Females 18+ that ever had vaginal sex with a man (%)
Sexual Behavior - Females 18+ that ever performed oral sex on a man (%)
Sexual Behavior - Females 18+ that ever had anal sex with a man (%)
Sexual Behavior - Females 18+ that ever had any kind of sex with a woman (%)
Sexual Behavior - Average age people first had sex
Sexual Behavior - Average number of female sex partners in lifetime (males 18+)
Sexual Behavior - Average number of female vaginal sex partners in lifetime (males 18+)
Sexual Behavior - Average age people first performed oral sex on a woman (18+)
Sexual Behavior - Average number of woman performed oral sex on in lifetime (18+)
Sexual Behavior - Average number of male sex partners in lifetime (males 18+)
Sexual Behavior - Average number of male anal sex partners in lifetime (males 18+)
Sexual Behavior - Average age people first performed oral sex on a man (18+)
Sexual Behavior - Average number of male oral sex partners in lifetime (18+)
Sexual Behavior - People using protection when performing oral sex (%)
Sexual Behavior - Average number of times people have vaginal or anal sex a year
Sexual Behavior - People having sex without condom (%)
Sexual Behavior - Average number of male sex partners in lifetime (females 18+)
Sexual Behavior - Average number of male vaginal sex partners in lifetime (females 18+)
Sexual Behavior - Average number of female sex partners in lifetime (females 18+)
Sexual Behavior - Circumcised males 18+ (%)
Sleep Disorders - Average hours sleeping at night
Sleep Disorders - People that has trouble sleeping (%)
Smoking-Cigarette Use - People smoking cigarettes (%)
Taste & Smell - People 40+ having problems with smell (%)
Taste & Smell - People 40+ having problems with taste (%)
Taste & Smell - People 40+ that ever had wisdom teeth removed (%)
Taste & Smell - People 40+ that ever had tonsils teeth removed (%)
Taste & Smell - People 40+ that ever had a loss of consciousness because of a head injury (%)
Taste & Smell - People 40+ that ever had a broken nose or other serious injury to face or skull (%)
Taste & Smell - People 40+ that ever had two or more sinus infections (%)
Weight - Average height (inches)
Weight - Average weight (pounds)
Weight - Average BMI
Weight - People that are obese (%)
Weight - People that ever were obese (%)
Weight - People trying to lose weight (%)
100%
urban population.
Estimated median house/condo value in 2022: $444,867
33135:
$444,867Florida:
$354,100
According to our research of Florida and other state lists, there were 14 registered sex offenders living in 33135 zip code as of April 27, 2024 . The ratio of all residents to sex offenders in zip code 33135 is 2,816 to 1.The ratio of registered sex offenders to all residents in this zip code is much lower than the state average.
Median resident age: This zip code:
45.3 yearsFlorida median age:
42.7 years
Average household size: This zip code:
2.3 peopleFlorida:
2.5 people
Averages for the 2020 tax year for zip code 33135, filed in 2021:
Average Adjusted Gross Income (AGI) in 2020: $29,591 (Individual Income Tax Returns) Here:
$29,591State:
$82,200
Salary/wage: $31,533 (reported on 71.7% of returns )Here:
$31,533State:
$58,347
(% of AGI for various income ranges: 1121.3% for AGIs below $25k , 3594.9% for AGIs $25k-50k , 6943.5% for AGIs $50k-75k , 10324.4% for AGIs $75k-100k , 17341.1% for AGIs $100k-200k , 58552.5% for AGIs over 200k ) Taxable interest for individuals: $927 (reported on 7.9% of returns )This zip code:
$927Florida:
$4,272
(% of AGI for various income ranges: 2.7% for AGIs below $25k , 6.3% for AGIs $25k-50k , 17.5% for AGIs $50k-75k , 50.9% for AGIs $75k-100k , 85.0% for AGIs $100k-200k , 650.0% for AGIs over 200k ) Ordinary dividends: $1,826 (reported on 3.5% of returns )(% of AGI for various income ranges: 2.1% for AGIs below $25k , 3.0% for AGIs $25k-50k , 26.4% for AGIs $50k-75k , 35.9% for AGIs $75k-100k , 66.8% for AGIs $100k-200k , 675.0% for AGIs over 200k ) Net capital gain/loss in AGI: +$11,585 (reported on 4.7% of returns )Here:
+$11,585State:
+$62,983
(% of AGI for various income ranges: 15.8% for AGIs $25k-50k , 43.8% for AGIs $50k-75k , 70.3% for AGIs $75k-100k , 791.1% for AGIs $100k-200k , 15040.0% for AGIs over 200k ) Profit/loss from business: +$4,590 (reported on 46.6% of returns )Here:
+$4,590State:
+$9,719
(% of AGI for various income ranges: 347.9% for AGIs below $25k , 142.4% for AGIs $25k-50k , 179.3% for AGIs $50k-75k , 597.2% for AGIs $75k-100k , 721.1% for AGIs $100k-200k , 1215.0% for AGIs over 200k ) Taxable individual retirement arrangement distribution: $12,216 (reported on 1.1% of returns )33135:
$12,216Florida:
$24,823
(% of AGI for various income ranges: 4.8% for AGIs below $25k , 9.2% for AGIs $25k-50k , 70.2% for AGIs $50k-75k , 321.1% for AGIs $100k-200k ) Total itemized deductions: $27,932 (reported on 3.4% of returns )Here:
$27,932State:
$45,393
(% of AGI for various income ranges: 19.5% for AGIs below $25k , 152.0% for AGIs $25k-50k , 273.5% for AGIs $50k-75k , 578.1% for AGIs $75k-100k , 1243.6% for AGIs $100k-200k , 2762.5% for AGIs over 200k ) Charity contributions: $5,353 (reported on 2.1% of returns )(% of AGI for various income ranges: 1.1% for AGIs below $25k , 15.5% for AGIs $25k-50k , 39.3% for AGIs $50k-75k , 85.6% for AGIs $75k-100k , 135.0% for AGIs $100k-200k , 500.0% for AGIs over 200k ) Taxes paid: $8,022 (reported on 3.1% of returns )(% of AGI for various income ranges: 4.6% for AGIs below $25k , 50.5% for AGIs $25k-50k , 71.5% for AGIs $50k-75k , 140.0% for AGIs $75k-100k , 236.8% for AGIs $100k-200k , 757.5% for AGIs over 200k ) Earned income credit: $1,933 (reported on 35.9% of returns )(% of AGI for various income ranges: 130.0% for AGIs below $25k , 66.2% for AGIs $25k-50k ) Percentage of individuals using paid preparers for their 2020 taxes: 86.0%(% for various income ranges: 82.5% for AGIs below $25k , 91.2% for AGIs $25k-50k , 91.2% for AGIs $50k-75k , 91.5% for AGIs $75k-100k , 91.5% for AGIs $100k-200k , 90.9% for AGIs over 200k )
Averages for the 2012 tax year for zip code 33135, filed in 2013:
Average Adjusted Gross Income (AGI) in 2012: $24,214 (Individual Income Tax Returns) Here:
$24,214State:
$60,316
Salary/wage: $24,865 (reported on 77.7% of returns )Here:
$24,865State:
$45,277
(% of AGI for various income ranges: 76.3% for AGIs below $25k , 93.2% for AGIs $25k-50k , 85.2% for AGIs $50k-75k , 82.0% for AGIs $75k-100k , 70.8% for AGIs $100k-200k , 60.2% for AGIs over 200k ) Taxable interest for individuals: $1,414 (reported on 8.6% of returns )This zip code:
$1,414Florida:
$3,587
(% of AGI for various income ranges: 0.4% for AGIs below $25k , 0.2% for AGIs $25k-50k , 0.6% for AGIs $50k-75k , 0.8% for AGIs $75k-100k , 0.4% for AGIs $100k-200k , 1.2% for AGIs over 200k ) Ordinary dividends: $4,657 (reported on 2.7% of returns )(% of AGI for various income ranges: 0.5% for AGIs below $25k , 0.4% for AGIs $25k-50k , 0.6% for AGIs $50k-75k , 0.4% for AGIs $75k-100k , 2.3% for AGIs $100k-200k ) Net capital gain/loss in AGI: +$15,921 (reported on 1.7% of returns )Here:
+$15,921State:
+$33,493
(% of AGI for various income ranges: 3.6% for AGIs $100k-200k , 6.7% for AGIs over 200k ) Profit/loss from business: +$5,515 (reported on 33.7% of returns )Here:
+$5,515State:
+$10,012
(% of AGI for various income ranges: 18.0% for AGIs below $25k , 1.9% for AGIs $25k-50k , 2.4% for AGIs $50k-75k , 1.7% for AGIs $75k-100k , 4.6% for AGIs $100k-200k ) Taxable individual retirement arrangement distribution: $8,692 (reported on 1.5% of returns )33135:
$8,692Florida:
$21,544
(% of AGI for various income ranges: 0.4% for AGIs below $25k , 0.3% for AGIs $25k-50k , 1.7% for AGIs $50k-75k , 2.2% for AGIs $100k-200k ) Self-employment retirement plans: $5,840 (reported on 0.3% of returns )33135:
$5,840Florida:
$20,611
(% of AGI for various income ranges: 0.2% for AGIs $25k-50k ) Total itemized deductions: $26,319 (38% of AGI, reported on 11.3% of returns )Here:
$26,319State:
$25,533
Here:
38.4% of AGIState:
18.0% of AGI
(% of AGI for various income ranges: 4.4% for AGIs below $25k , 11.5% for AGIs $25k-50k , 11.3% for AGIs $50k-75k , 12.2% for AGIs $75k-100k , 12.0% for AGIs $100k-200k , 35.4% for AGIs over 200k ) Charity contributions: $6,903 (reported on 7.0% of returns )(% of AGI for various income ranges: 0.2% for AGIs below $25k , 0.8% for AGIs $25k-50k , 1.0% for AGIs $50k-75k , 1.1% for AGIs $75k-100k , 1.4% for AGIs $100k-200k , 10.4% for AGIs over 200k ) Taxes paid: $3,205 (reported on 9.9% of returns )(% of AGI for various income ranges: 0.6% for AGIs below $25k , 1.8% for AGIs $25k-50k , 2.1% for AGIs $50k-75k , 1.9% for AGIs $75k-100k , 2.8% for AGIs $100k-200k , 0.8% for AGIs over 200k ) Earned income credit: $2,242 (reported on 42.1% of returns )(% of AGI for various income ranges: 9.7% for AGIs below $25k , 1.3% for AGIs $25k-50k ) Percentage of individuals using paid preparers for their 2012 taxes: 68.1%(% for various income ranges: 68.5% for AGIs below $25k , 66.8% for AGIs $25k-50k , 68.5% for AGIs $50k-75k , 66.7% for AGIs $75k-100k , 68.4% for AGIs $100k-200k , 60.0% for AGIs over 200k )
Averages for the 2004 tax year for zip code 33135, filed in 2005:
Average Adjusted Gross Income (AGI) in 2004: $19,769 (Individual Income Tax Returns) Here:
$19,769State:
$50,523
Salary/wage: $20,636 (reported on 78.6% of returns )Here:
$20,636State:
$39,563
(% of AGI for various income ranges: 59.8% for AGIs below $10k , 84.7% for AGIs $10k-25k , 93.2% for AGIs $25k-50k , 85.9% for AGIs $50k-75k , 81.6% for AGIs $75k-100k , 52.0% for AGIs over 100k ) Taxable interest for individuals: $1,135 (reported on 16.0% of returns )This zip code:
$1,135Florida:
$3,211
(% of AGI for various income ranges: 1.7% for AGIs below $10k , 0.7% for AGIs $10k-25k , 0.7% for AGIs $25k-50k , 0.9% for AGIs $50k-75k , 0.8% for AGIs $75k-100k , 1.6% for AGIs over 100k ) Taxable dividends: $1,324 (reported on 3.1% of returns )(% of AGI for various income ranges: 0.4% for AGIs below $10k , 0.2% for AGIs $10k-25k , 0.1% for AGIs $25k-50k , 0.1% for AGIs $50k-75k , 0.4% for AGIs $75k-100k , 0.5% for AGIs over 100k ) Net capital gain/loss: +$16,135 (reported on 2.9% of returns )Here:
+$16,135State:
+$27,205
(% of AGI for various income ranges: -0.3% for AGIs below $10k , 0.1% for AGIs $10k-25k , 0.6% for AGIs $25k-50k , 2.0% for AGIs $50k-75k , 2.3% for AGIs $75k-100k , 18.5% for AGIs over 100k ) Profit/loss from business: +$5,643 (reported on 30.5% of returns )Here:
+$5,643State:
+$10,634
(% of AGI for various income ranges: 41.0% for AGIs below $10k , 11.0% for AGIs $10k-25k , 2.3% for AGIs $25k-50k , 1.6% for AGIs $50k-75k , 3.2% for AGIs $75k-100k , 3.1% for AGIs over 100k ) IRA payment deduction: $2,000 (reported on 1.5% of returns )33135:
$2,000Florida:
$3,082
(% of AGI for various income ranges: 0.1% for AGIs below $10k , 0.1% for AGIs $10k-25k , 0.2% for AGIs $25k-50k , 0.2% for AGIs $50k-75k , 0.4% for AGIs $75k-100k ) Total itemized deductions: $15,000 (40% of AGI, reported on 15.6% of returns )Here:
$15,000State:
$20,370
Here:
39.8% of AGIState:
20.7% of AGI
(% of AGI for various income ranges: 3.8% for AGIs below $10k , 10.2% for AGIs $10k-25k , 15.9% for AGIs $25k-50k , 14.3% for AGIs $50k-75k , 13.0% for AGIs $75k-100k , 8.0% for AGIs over 100k ) Charity contributions deductions: $1,556 (4% of AGI, reported on 11.7% of returns )Here:
3.8% of AGIState:
3.8% of AGI
(% of AGI for various income ranges: 0.1% for AGIs below $10k , 0.6% for AGIs $10k-25k , 1.1% for AGIs $25k-50k , 1.4% for AGIs $50k-75k , 1.5% for AGIs $75k-100k , 1.3% for AGIs over 100k ) Total tax: $2,107 (reported on 66.4% of returns )(% of AGI for various income ranges: 6.8% for AGIs below $10k , 3.8% for AGIs $10k-25k , 5.5% for AGIs $25k-50k , 9.4% for AGIs $50k-75k , 11.7% for AGIs $75k-100k , 19.6% for AGIs over 100k ) Earned income credit: $1,770 (reported on 41.1% of returns )Percentage of individuals using paid preparers for their 2004 taxes: 70.9%(% for various income ranges: 68.6% for AGIs below $10k , 74.0% for AGIs $10k-25k , 68.3% for AGIs $25k-50k , 68.5% for AGIs $50k-75k , 69.6% for AGIs $75k-100k , 72.3% for AGIs over 100k )
Estimated median household income in 2022: This zip code:
$35,903Florida:
$69,303
Nearest zip codes: 33145 ,
33125 ,
33130 ,
33128 ,
33136 ,
33134 .
Miami Zip Code Map
Percentage of family households: This zip code:
35.9%Florida:
41.2%
Percentage of households with unmarried partners: This zip code:
2.8%Florida:
46.7%
Likely homosexual households (counted as self-reported same-sex unmarried-partner households)
Lesbian couples: 0.2% of all households Gay men: 0.1% of all households
Household received Food Stamps/SNAP in the past 12 months: 5,838Household did not receive Food Stamps/SNAP in the past 12 months: 9,229
Women who had a birth in the past 12 months: 530 (352 now married , 178 unmarried) Women who did not have a birth in the past 12 months: 6,811 (2,467 now married , 4,343 unmarried)
Housing units in zip code 33135 with a mortgage: 1,453 (40
second mortgage , 11
both second mortgage and home equity loan )
Houses without a mortgage: 21
Median monthly owner costs for units with a mortgage: $2,001
Median monthly owner costs for units without a mortgage: $648
Residents with income below the poverty level in 2022:
This zip code:
23.9%Whole state:
12.7%
Residents with income below 50% of the poverty level in 2022:
This zip code:
16.0%Whole state:
6.6%
Median number of rooms in houses and condos: Median number of rooms in apartments: Notable locations in this zip code not listed on our city pages
Click to draw/clear zip code borders Notable locations in zip code 33135: (A) , Latin Quarter Cultural Center of Miami (B) , YMCA International (C) , Tamiami United Methodist Day Care Center (D) , Terry's Day Nursery (E) , The Candy House Day Care Center (F) , Ponce Plaza Nursing and Rehabiliation Center (G) , Refugee Health Clinic (H) , New Sunrise Day Care Center (I) , Miami South Police Station (J) , Mi Casita Day Care Center (K) , Las Americas Day Care Center (L) , Latin American Art Museum (M) , International Jose Marti YMCA Day Care Center (N) , Hispanic Library (O) , Gladys Molina Family Day Care Center (P) , Gingerbread House Day Care Center (Q) , Cuban Museum of Arts and Culture (R) , Calvary Baptist Church Day Care Center (S) , City of Miami Department of Fire Rescue Station 7 (T) . Display/hide their locations on the map
Churches in zip code 33135 include: (A) , Palmetto Baptist Church (B) , Iglesia Victoria (C) , Riverside Baptist Church (D) , Saint Dominics Catholic Church (E) , Saint Louis Catholic Church (F) . Display/hide their locations on the map
Cemetery: (1) . Display/hide its location on the map
Park in zip code 33135: (1) . Display/hide its location on the map
Year house built (houses)
149 2020 or later1,071 2010 to 2019770 2000 to 2009652 1990 to 19991,089 1980 to 19891,802 1970 to 19791,584 1960 to 19693,085 1950 to 19592,163 1940 to 19493,138 1939 or earlier
Zip code 33135 household income distribution in 2022 1,452 Less than $10,0001,833 $10,000 to $14,9991,335 $15,000 to $19,9991,023 $20,000 to $24,999917 $25,000 to $29,999883 $30,000 to $34,999596 $35,000 to $39,999656 $40,000 to $44,999379 $45,000 to $49,9991,210 $50,000 to $59,9991,415 $60,000 to $74,9991,346 $75,000 to $99,999633 $100,000 to $124,999413 $125,000 to $149,999546 $150,000 to $199,999499 $200,000 or moreEstimate of home value of owner-occupied houses/condos in 2022 in zip code 33135 15 Less than $10,00018 $10,000 to $14,99911 $15,000 to $19,99917 $25,000 to $29,99940 $35,000 to $39,99931 $70,000 to $79,9997 $80,000 to $89,9996 $90,000 to $99,99944 $100,000 to $124,99967 $125,000 to $149,999100 $150,000 to $174,999107 $175,000 to $199,999170 $200,000 to $249,999170 $250,000 to $299,999881 $300,000 to $399,999713 $400,000 to $499,999879 $500,000 to $749,999164 $750,000 to $999,99967 $1,500,000 to $1,999,999Rent paid by renters in 2022 in zip code 33135 104 Less than $10012 $100 to $149473 $150 to $199387 $200 to $24983 $250 to $299118 $300 to $34947 $350 to $39981 $400 to $44963 $450 to $499155 $500 to $54948 $550 to $599103 $600 to $649211 $650 to $699413 $700 to $749294 $750 to $799650 $800 to $899749 $900 to $9992,586 $1,000 to $1,2492,129 $1,250 to $1,4991,770 $1,500 to $1,999410 $2,000 to $2,499125 $2,500 to $2,999345 No cash rent
Median gross rent in 2022: $1,289.
Median price asked for vacant for-sale houses and condos in 2022: $4,571,045.
Estimated median house (or condo) value in 2022 for: White Non-Hispanic householders: $438,903Black or African American householders: $546,641American Indian or Alaska Native householders: $337,923Asian householders: $806,246Some other race householders: $513,644Two or more races householders: $551,014Hispanic or Latino householders: $504,102Estimated median house or condo value in 2022: $444,867
33135:
$444,867Florida:
$354,100
Lower value quartile - upper value quartile: $285,706 - $582,864
Mean price in 2022: Detached houses: $479,349Here:
$479,349State:
$500,941
Townhouses or other attached units: $827,756Here:
$827,756State:
$370,869
In 2-unit structures: $174,541Here:
$174,541State:
$423,188
In 3-to-4-unit structures: $859,442Here:
$859,442State:
$309,944
In 5-or-more-unit structures: $230,700Here:
$230,700State:
$447,145
Mobile homes: $61,349Here:
$61,349State:
$113,202
Housing units in structures:
One, detached: 3,058One, attached: 2,590Two: 4213 or 4: 1,1015 to 9: 2,54010 to 19: 2,67020 to 49: 1,63050 or more: 1,914Mobile homes: 317Boats, RVs, vans, etc.: 12Unemployment : 4.0%
Means of transportation to work in zip code 33135 61.2% 11,278 Drove a car alone13.0% 2,386 Carpooled6.8% 1,245 Bus or trolley bus0.2% 29 Streetcar or trolley car0.7% 129 Taxi0.4% 75 Motorcycle0.6% 110 Bicycle3.5% 647 Walked0.7% 131 Other means11.3% 2,083 Worked at homeTravel time to work (commute) in zip code 33135 87 Less than 5 minutes669 5 to 9 minutes1,305 10 to 14 minutes1,508 15 to 19 minutes2,340 20 to 24 minutes815 25 to 29 minutes3,913 30 to 34 minutes862 35 to 39 minutes1,237 40 to 44 minutes1,760 45 to 59 minutes1,126 60 to 89 minutes417 90 or more minutes
Neighborhoods in zip code 33135: Percentage of zip code residents living and working in this county: 98.9%
Household type by relationship:
Households: 35,722
Male householders: 7,481 (2,477 living alone ), Female householders: 7,854 (2,857 living alone )4,512 spouses (4,454 opposite-sex spouses ), 1,239 unmarried partners , (1,196 opposite-sex unmarried partners ), 7,842 children (7,262 natural , 412 adopted , 187 stepchildren ), 687 grandchildren , 1,154 brothers or sisters , 1,247 parents , 27 foster children , 1,360 other relatives , 1,875 non-relatives In group quarters: 314 (-1 institutionalized population )
Size of family households: 3,603 2-persons , 2,640 3-persons , 1,439 4-persons , 378 5-persons , 172 6-persons , 192 7-or-more-persons
Size of nonfamily households: 5,332 1-person , 1,189 2-persons , 221 3-persons , 149 4-persons , 42 5-persons
2,051 married couples with children. single-parent households (405 men , 1,523 women ).
7.3% of residents of 33135 zip code speak English at home. of residents speak Spanish at home (34% very well, 13% well, 25% not well, 28% not at all ).of residents speak other Indo-European language at home (82% very well, 2% well, 2% not well, 14% not at all ).of residents speak Asian or Pacific Island language at home (22% very well, 59% well, 19% not well ).of residents speak other language at home (100% very well ).
Foreign born population: 27,313 (76.5%)
(40.7%
of them are naturalized citizens )
This zip code:
76.5%Whole state:
21.7%
50% Barbados 13% Mexico 10% Guatemala 5% Uruguay 5% Costa Rica 4% Chile 2% El Salvador 1% American 1% Haitian 0% Italian 0% German 0% Russian 0% French 0% European
Year of entry for the foreign-born population
10,879 2010 or later 6,026 2000 to 2009 4,756 1990 to 1999 6,417 Before 1990
There are
142 Counselors 140 Social Workers 306 Other Medical Specialists in Zip Code 33135.
Major facilities with environmental interests located in this zip code:
MIAMI SENIOR HIGH SCHOOL (2450 SW 1ST STREET in MIAMI, FL)
(Geographic Names Information System) (National Center for Education Statistics) - STATE ID-7461 Small Quantity Generators, between 100 kg and 1000 kg of hazardous waste/month (Resource Conservation and Recovery Act (tracking hazardous waste)) - notification Organizations: GARCIA DIEGO, ASST PRINCIPAL (CONTACT/OWNER)
, DADE COUNTY SCHOOL DISTRICT (SCHOOL DISTRICT)
Alternative names: DADE CO MIAMI SR HIGH SCHOOL
AUBURNDALE ELEMENTARY SCHOOL (3255 S.W. 6TH STREET in MIAMI, FL)
(National Center for Education Statistics) - STATE ID-0121 Small Quantity Generators, between 100 kg and 1000 kg of hazardous waste/month (Resource Conservation and Recovery Act (tracking hazardous waste)) - notification Organizations: MARY JOHNSON, PRINCIPAL (CONTACT/OWNER)
, DADE COUNTY SCHOOL DISTRICT (SCHOOL DISTRICT)
Alternative names: DADE CO AUBURNDALE ELEMENTARY
SHENANDOAH ELEMENTARY SCHOOL (1023 S.W. 21ST AVENUE in MIAMI, FL)
(National Center for Education Statistics) - STATE ID-5001 Small Quantity Generators, between 100 kg and 1000 kg of hazardous waste/month (Resource Conservation and Recovery Act (tracking hazardous waste)) - notification Organizations: MARIA LIERENA, PRINCIPAL (CONTACT/OWNER)
, DADE COUNTY SCHOOL DISTRICT (SCHOOL DISTRICT)
Alternative names: DADE CO SHENANDOAH ELEMENTARY
LEONARD BROTHERS TRUCKING CO (2515 NW 20TH STREET in MIAMI, FL)
(Resource Conservation and Recovery Act (tracking hazardous waste)) Organizations: TOM LEONARD, PRESIDENT (CONTACT/OWNER)
, JOHN DEWHURST, VICE PRES (CONTACT/OWNER)
Alternative names: LEONARD BROTHERS CO
MIAMI SENIOR ADULT EDUCATION CENTER (2450 S.W. 1ST STREET in MIAMI, FL)
(National Center for Education Statistics) - STATE ID-7462 Organizations: DADE COUNTY SCHOOL DISTRICT (SCHOOL DISTRICT)
ANDRES DRY CLEANERS INC (1432 W FLAGLER ST in MIAMI, FL)
AIR MINOR (AIRS/AFS) Small Quantity Generators, between 100 kg and 1000 kg of hazardous waste/month (Resource Conservation and Recovery Act (tracking hazardous waste)) - notification Business SIC classification: DRYCLEANING PLANTS, EXCEPT RUG CLEANINGOrganizations: PIRE RAUL (CONTACT/OWNER)
Alternative names: ANDRES CLEANERS
SPANNY CLEANERS INC (2555 SW 8TH ST in MIAMI, FL)
AIR MINOR (AIRS/AFS) Small Quantity Generators, between 100 kg and 1000 kg of hazardous waste/month (Resource Conservation and Recovery Act (tracking hazardous waste)) - notification Business SIC classification: DRYCLEANING PLANTS, EXCEPT RUG CLEANINGOrganizations: ENRIQUE CHANTRES (CONTACT/OWNER)
Alternative names: ENRIQUE CHANTRES CLEANERS
MASTER AUTO INC (230 21ST CT SW in MIAMI, FL)
(Resource Conservation and Recovery Act (tracking hazardous waste)) Organizations: ROBERTO HERNANDEZ, OWNER (CONTACT/OWNER)
NATIONAL BODY SHOP INC (1316 W FLAGLER in MIAMI, FL)
(Resource Conservation and Recovery Act (tracking hazardous waste)) Organizations: HUGO JIMENEZ (CONTACT/OWNER)
PAT SHEEHAN BUICK INC (2301 SW 8TH STREET in MIAMI, FL)
(Resource Conservation and Recovery Act (tracking hazardous waste)) Organizations: FRANK ROSENBERGER, SERVICE DIR (CONTACT/OWNER)
R G INDUSTRIES INC (2485 NW 20TH STREET in MIAMI, FL)
(Resource Conservation and Recovery Act (tracking hazardous waste)) Organizations: G CHARLES FLINT (CONTACT/OWNER)
RANDLE AMBULANCE (35 SW 27TH AVE in MIAMI, FL)
(Resource Conservation and Recovery Act (tracking hazardous waste)) Organizations: ROBERTO FERNANDEZ, CHIEF MECH (CONTACT/OWNER)
DECOLORES (280 SW 22ND AVE in MIAMI, FL)
(Resource Conservation and Recovery Act (tracking hazardous waste)) Organizations: JOHN KRANTZ, PRES (CONTACT/OWNER)
Housing units lacking complete plumbing facilities: 0.6%
Housing units lacking complete kitchen facilities: 1.5%
92.1% Electricity 5.8% No fuel used 1.8% Utility gas
Population in 1990: 35,425. Population change in the 1990s: +287 (+0.8%).
Place of birth for U.S.-born residents:
This state: 6,667Northeast: 558Midwest: 125South: 646West: 221
53% of the 33135 zip code residents lived in the same house 5 years ago.
Out of people who lived in different houses, 92% lived in this county.
Out of people who lived in different counties, 50% lived in Florida.
91% of the 33135 zip code residents lived in the same house 1 year ago.
Out of people who lived in different houses, 62% moved from this county.
Out of people who lived in different houses, 6% moved from different county within same state.
Out of people who lived in different houses, 13% moved from different state.
Out of people who lived in different houses, 18% moved from abroad.
Private vs. public school enrollment:
Students in private schools in grades 1 to 8 (elementary and middle school): 199
Students in private schools in grades 9 to 12 (high school): 141
Students in private undergraduate colleges: 237
Occupation by median earnings in the past 12 months ($)
117,021 Life, physical, and social science occupations 109,257 Architecture and engineering occupations 64,322 Legal occupations 58,444 Business and financial operations occupations 55,943 Computer and mathematical occupations 53,492 Education, training, and library occupations
Companies with federal contracts located in this zip code:
IBILEY MANUFACTURING CORPORATI (1927 W FLAGLER ST in MIAMI, FL; small business) in 2 contracts from 2004 to 2005
$20,000 with Army for Clothing, Special Purpose. Signed on 2004-08-06. Completion date: 2004-09-03.
, same as above. Signed on 2005-01-12. Completion date: 2004-09-03.
Top industries in this zip code by the number of employees in 2005:
Accommodation and Food Services: Full-Service Restaurants (100-249 employees: 4 establishments, 50-99 employees: 1 establishment, 20-49 employees: 1 establishment, 10-19 employees: 2 establishments, 5-9 employees: 8 establishments, 1-4 employees: 11 establishments)Health Care and Social Assistance: Offices of Physicians (except Mental Health Specialists) (250-499: 1, 100-249: 1, 20-49: 3, 10-19: 2, 5-9: 12, 1-4: 52)Educational Services: Elementary and Secondary Schools (100-249: 1, 20-49: 1, 10-19: 4)Administrative and Support and Waste Management and Remediation Services: Telemarketing Bureaus (100-249: 1, 20-49: 2, 5-9: 1)Health Care and Social Assistance: Child Day Care Services (50-99: 1, 20-49: 2, 10-19: 4, 5-9: 3, 1-4: 6)Accommodation and Food Services: Limited-Service Restaurants (20-49: 4, 10-19: 2, 5-9: 3, 1-4: 8)Construction: Commercial and Institutional Building Construction (100-249: 1, 10-19: 1, 5-9: 1, 1-4: 1)
People in group quarters in 2010:
132 people in nursing facilities/skilled-nursing facilities
24 people in group homes intended for adults
20 people in other noninstitutional facilities
17 people in workers' group living quarters and job corps centers
8 people in residential treatment centers for adults
People in group quarters in 2000:
115 people in other noninstitutional group quarters
85 people in homes or halfway houses for drug/alcohol abuse
46 people in nursing homes
13 people in hospitals/wards and hospices for chronically ill
13 people in military hospitals or wards for chronically ill
11 people in religious group quarters
Fatal accident statistics in 2014:
Fatal accident count: 1Vehicles involved in fatal accidents: 1Fatal accidents caused by drunken drivers: 0Fatalities: 1Persons involved in fatal accidents: 1Pedestrians involved in fatal accidents: 1
Fatal accident statistics in 2013:
Fatal accident count: 5Vehicles involved in fatal accidents: 5Fatal accidents caused by drunken drivers: 0Fatalities: 5Persons involved in fatal accidents: 9Pedestrians involved in fatal accidents: 5
Home Mortgage Disclosure Act Aggregated Statistics For Year 2009(Based on 6 full and 8 partial tracts) A) FHA, FSA/RHS & VA B) Conventional C) Refinancings D) Home Improvement Loans E) Loans on Dwellings For 5+ Families F) Non-occupant Loans on Number Average Value Number Average Value Number Average Value Number Average Value Number Average Value Number Average Value
LOANS ORIGINATED 48 $167,842 41 $125,112 96 $174,184 2 $24,710 12 $479,764 30 $154,959 APPLICATIONS APPROVED, NOT ACCEPTED 0 $0 5 $304,522 12 $144,338 1 $25,810 0 $0 4 $220,032 APPLICATIONS DENIED 29 $175,584 34 $141,971 79 $197,831 14 $69,032 2 $97,560 43 $161,588 APPLICATIONS WITHDRAWN 9 $165,266 12 $117,855 24 $161,455 0 $0 2 $494,200 5 $92,722 FILES CLOSED FOR INCOMPLETENESS 5 $176,110 3 $238,003 11 $157,278 0 $0 0 $0 0 $0
Aggregated Statistics For Year 2008(Based on 6 full and 8 partial tracts) A) FHA, FSA/RHS & VA B) Conventional C) Refinancings D) Home Improvement Loans E) Loans on Dwellings For 5+ Families F) Non-occupant Loans on G) Loans On Manufactured Number Average Value Number Average Value Number Average Value Number Average Value Number Average Value Number Average Value Number Average Value
LOANS ORIGINATED 14 $172,876 104 $217,612 128 $191,575 16 $152,727 22 $553,319 45 $167,105 0 $0 APPLICATIONS APPROVED, NOT ACCEPTED 8 $247,289 33 $210,748 39 $226,586 7 $121,223 6 $348,923 13 $222,423 0 $0 APPLICATIONS DENIED 14 $261,248 99 $291,619 205 $225,617 28 $52,509 6 $398,427 80 $185,144 1 $81,300 APPLICATIONS WITHDRAWN 21 $214,889 35 $255,504 49 $225,999 1 $21,370 3 $401,007 15 $258,641 0 $0 FILES CLOSED FOR INCOMPLETENESS 3 $205,557 21 $227,280 22 $285,329 2 $24,710 0 $0 8 $159,629 0 $0
Aggregated Statistics For Year 2007(Based on 6 full and 8 partial tracts) A) FHA, FSA/RHS & VA B) Conventional C) Refinancings D) Home Improvement Loans E) Loans on Dwellings For 5+ Families F) Non-occupant Loans on G) Loans On Manufactured Number Average Value Number Average Value Number Average Value Number Average Value Number Average Value Number Average Value Number Average Value
LOANS ORIGINATED 13 $164,532 483 $185,509 438 $244,552 62 $182,262 37 $785,291 161 $226,766 0 $0 APPLICATIONS APPROVED, NOT ACCEPTED 1 $270,360 110 $216,620 128 $241,878 12 $142,622 2 $395,360 40 $280,790 0 $0 APPLICATIONS DENIED 2 $150,240 344 $255,029 398 $286,289 102 $121,137 10 $477,022 99 $251,901 4 $85,002 APPLICATIONS WITHDRAWN 2 $238,920 81 $250,252 167 $245,391 13 $214,212 10 $348,188 42 $284,684 0 $0 FILES CLOSED FOR INCOMPLETENESS 0 $0 32 $248,115 40 $312,484 5 $323,176 2 $568,330 9 $343,503 0 $0
Aggregated Statistics For Year 2006(Based on 6 full and 8 partial tracts) A) FHA, FSA/RHS & VA B) Conventional C) Refinancings D) Home Improvement Loans E) Loans on Dwellings For 5+ Families F) Non-occupant Loans on G) Loans On Manufactured Number Average Value Number Average Value Number Average Value Number Average Value Number Average Value Number Average Value Number Average Value
LOANS ORIGINATED 21 $169,013 802 $217,748 574 $228,102 70 $177,629 54 $875,915 186 $263,775 4 $72,648 APPLICATIONS APPROVED, NOT ACCEPTED 0 $0 152 $208,988 115 $208,548 25 $98,641 4 $262,572 38 $246,221 1 $65,940 APPLICATIONS DENIED 0 $0 488 $225,497 328 $260,164 49 $94,104 8 $641,211 116 $246,456 5 $58,146 APPLICATIONS WITHDRAWN 0 $0 230 $214,985 199 $266,755 17 $154,171 0 $0 46 $187,360 0 $0 FILES CLOSED FOR INCOMPLETENESS 0 $0 24 $297,273 60 $214,959 3 $215,880 0 $0 12 $301,713 0 $0
Aggregated Statistics For Year 2005(Based on 6 full and 8 partial tracts) A) FHA, FSA/RHS & VA B) Conventional C) Refinancings D) Home Improvement Loans E) Loans on Dwellings For 5+ Families F) Non-occupant Loans on G) Loans On Manufactured Number Average Value Number Average Value Number Average Value Number Average Value Number Average Value Number Average Value Number Average Value
LOANS ORIGINATED 20 $141,638 747 $195,501 532 $198,005 64 $143,496 47 $439,257 216 $203,341 2 $145,295 APPLICATIONS APPROVED, NOT ACCEPTED 0 $0 123 $190,063 99 $170,524 10 $162,378 2 $416,115 45 $220,918 0 $0 APPLICATIONS DENIED 0 $0 375 $213,501 317 $197,673 60 $75,465 2 $373,615 134 $219,471 2 $36,835 APPLICATIONS WITHDRAWN 4 $146,282 184 $206,626 206 $189,483 19 $168,657 0 $0 61 $228,904 0 $0 FILES CLOSED FOR INCOMPLETENESS 0 $0 60 $213,392 117 $194,473 1 $283,940 0 $0 12 $245,226 0 $0
Aggregated Statistics For Year 2004(Based on 6 full and 8 partial tracts) A) FHA, FSA/RHS & VA B) Conventional C) Refinancings D) Home Improvement Loans E) Loans on Dwellings For 5+ Families F) Non-occupant Loans on G) Loans On Manufactured Number Average Value Number Average Value Number Average Value Number Average Value Number Average Value Number Average Value Number Average Value
LOANS ORIGINATED 3 $183,510 603 $181,198 624 $166,140 76 $88,903 71 $491,349 228 $195,872 0 $0 APPLICATIONS APPROVED, NOT ACCEPTED 0 $0 84 $167,378 157 $140,473 16 $122,575 6 $338,208 46 $176,753 0 $0 APPLICATIONS DENIED 1 $127,160 189 $163,317 403 $164,770 73 $79,689 5 $869,622 77 $158,013 5 $79,542 APPLICATIONS WITHDRAWN 3 $138,977 133 $198,373 175 $166,552 5 $149,340 7 $509,409 50 $214,559 0 $0 FILES CLOSED FOR INCOMPLETENESS 0 $0 21 $190,510 122 $166,670 3 $46,370 0 $0 5 $133,026 0 $0
Aggregated Statistics For Year 2003(Based on 6 full and 8 partial tracts) A) FHA, FSA/RHS & VA B) Conventional C) Refinancings D) Home Improvement Loans E) Loans on Dwellings For 5+ Families F) Non-occupant Loans on Number Average Value Number Average Value Number Average Value Number Average Value Number Average Value Number Average Value
LOANS ORIGINATED 12 $170,433 393 $155,200 949 $130,754 28 $43,689 59 $391,737 181 $139,012 APPLICATIONS APPROVED, NOT ACCEPTED 4 $131,970 81 $160,479 194 $115,909 18 $39,033 5 $390,292 50 $126,116 APPLICATIONS DENIED 2 $133,435 147 $167,310 499 $148,583 64 $28,047 6 $278,293 96 $147,288 APPLICATIONS WITHDRAWN 0 $0 70 $179,747 230 $139,045 3 $61,193 7 $532,856 31 $129,409 FILES CLOSED FOR INCOMPLETENESS 2 $255,995 13 $146,440 61 $146,211 0 $0 0 $0 5 $121,240
Aggregated Statistics For Year 2002(Based on 6 full and 8 partial tracts) A) FHA, FSA/RHS & VA B) Conventional C) Refinancings D) Home Improvement Loans E) Loans on Dwellings For 5+ Families F) Non-occupant Loans on Number Average Value Number Average Value Number Average Value Number Average Value Number Average Value Number Average Value
LOANS ORIGINATED 33 $152,391 413 $143,372 483 $120,730 70 $22,025 73 $345,496 214 $118,962 APPLICATIONS APPROVED, NOT ACCEPTED 1 $199,140 124 $127,781 99 $124,291 21 $29,645 7 $378,060 26 $118,826 APPLICATIONS DENIED 7 $126,177 145 $133,686 267 $127,399 106 $15,843 7 $241,461 108 $70,447 APPLICATIONS WITHDRAWN 8 $141,139 55 $131,577 173 $128,206 9 $29,664 1 $197,690 24 $111,061 FILES CLOSED FOR INCOMPLETENESS 4 $92,195 17 $111,855 44 $122,413 6 $46,027 0 $0 12 $105,314
Aggregated Statistics For Year 2001(Based on 6 full and 8 partial tracts) A) FHA, FSA/RHS & VA B) Conventional C) Refinancings D) Home Improvement Loans E) Loans on Dwellings For 5+ Families F) Non-occupant Loans on Number Average Value Number Average Value Number Average Value Number Average Value Number Average Value Number Average Value
LOANS ORIGINATED 59 $119,521 343 $122,744 495 $102,754 50 $22,113 42 $530,927 145 $99,601 APPLICATIONS APPROVED, NOT ACCEPTED 10 $86,776 54 $121,141 100 $97,216 17 $36,046 6 $391,905 24 $100,609 APPLICATIONS DENIED 16 $129,472 171 $115,470 275 $100,510 64 $27,534 13 $505,169 50 $111,737 APPLICATIONS WITHDRAWN 13 $103,948 45 $126,514 137 $86,502 15 $43,098 4 $211,918 15 $99,128 FILES CLOSED FOR INCOMPLETENESS 3 $138,980 7 $125,113 34 $100,370 5 $33,608 0 $0 0 $0
Aggregated Statistics For Year 2000(Based on 6 full and 8 partial tracts) A) FHA, FSA/RHS & VA B) Conventional C) Refinancings D) Home Improvement Loans E) Loans on Dwellings For 5+ Families F) Non-occupant Loans on Number Average Value Number Average Value Number Average Value Number Average Value Number Average Value Number Average Value
LOANS ORIGINATED 40 $98,638 328 $107,735 130 $89,234 53 $16,533 37 $257,759 65 $108,401 APPLICATIONS APPROVED, NOT ACCEPTED 3 $102,247 67 $120,021 60 $90,040 23 $27,882 0 $0 7 $87,106 APPLICATIONS DENIED 12 $133,732 148 $109,480 128 $95,657 52 $20,977 10 $271,075 35 $111,272 APPLICATIONS WITHDRAWN 12 $108,276 72 $115,241 99 $68,029 10 $56,347 1 $580,680 11 $81,911 FILES CLOSED FOR INCOMPLETENESS 5 $92,742 21 $110,432 28 $96,511 0 $0 2 $373,315 3 $70,973
Private Mortgage Insurance Companies Aggregated Statistics For Year 2009(Based on 6 full and 6 partial tracts) A) Conventional C) Non-occupant Loans on Number Average Value Number Average Value
LOANS ORIGINATED 1 $196,500 0 $0 APPLICATIONS APPROVED, NOT ACCEPTED 7 $310,840 2 $148,290 APPLICATIONS DENIED 4 $93,898 0 $0 APPLICATIONS WITHDRAWN 3 $152,647 1 $285,180 FILES CLOSED FOR INCOMPLETENESS 1 $196,500 0 $0
Aggregated Statistics For Year 2008(Based on 6 full and 8 partial tracts) A) Conventional B) Refinancings C) Non-occupant Loans on Number Average Value Number Average Value Number Average Value
LOANS ORIGINATED 40 $265,941 7 $297,406 1 $161,880 APPLICATIONS APPROVED, NOT ACCEPTED 50 $252,367 9 $327,844 10 $161,968 APPLICATIONS DENIED 13 $309,513 6 $265,957 1 $427,840 APPLICATIONS WITHDRAWN 5 $376,626 1 $280,900 0 $0 FILES CLOSED FOR INCOMPLETENESS 0 $0 0 $0 0 $0
Aggregated Statistics For Year 2007(Based on 6 full and 8 partial tracts) A) Conventional B) Refinancings C) Non-occupant Loans on Number Average Value Number Average Value Number Average Value
LOANS ORIGINATED 116 $222,674 10 $305,413 13 $214,669 APPLICATIONS APPROVED, NOT ACCEPTED 28 $299,724 12 $261,758 1 $520,340 APPLICATIONS DENIED 5 $217,468 2 $412,165 0 $0 APPLICATIONS WITHDRAWN 5 $292,022 0 $0 0 $0 FILES CLOSED FOR INCOMPLETENESS 0 $0 3 $489,717 0 $0
Aggregated Statistics For Year 2006(Based on 6 full and 8 partial tracts) A) Conventional B) Refinancings C) Non-occupant Loans on Number Average Value Number Average Value Number Average Value
LOANS ORIGINATED 57 $322,111 8 $270,626 7 $246,596 APPLICATIONS APPROVED, NOT ACCEPTED 13 $362,090 9 $317,909 1 $520,340 APPLICATIONS DENIED 1 $461,580 0 $0 0 $0 APPLICATIONS WITHDRAWN 11 $378,651 0 $0 3 $346,897 FILES CLOSED FOR INCOMPLETENESS 0 $0 0 $0 0 $0
Aggregated Statistics For Year 2005(Based on 6 full and 8 partial tracts) A) Conventional B) Refinancings C) Non-occupant Loans on Number Average Value Number Average Value Number Average Value
LOANS ORIGINATED 63 $218,986 17 $180,579 18 $166,794 APPLICATIONS APPROVED, NOT ACCEPTED 15 $263,243 4 $155,052 3 $287,787 APPLICATIONS DENIED 3 $330,893 0 $0 2 $241,950 APPLICATIONS WITHDRAWN 4 $216,075 0 $0 2 $262,915 FILES CLOSED FOR INCOMPLETENESS 1 $481,800 0 $0 0 $0
Aggregated Statistics For Year 2004(Based on 6 full and 8 partial tracts) A) Conventional B) Refinancings C) Non-occupant Loans on Number Average Value Number Average Value Number Average Value
LOANS ORIGINATED 98 $200,237 16 $192,957 17 $157,179 APPLICATIONS APPROVED, NOT ACCEPTED 20 $201,361 8 $124,444 4 $220,892 APPLICATIONS DENIED 4 $295,528 0 $0 0 $0 APPLICATIONS WITHDRAWN 5 $196,676 1 $152,980 1 $152,980 FILES CLOSED FOR INCOMPLETENESS 2 $231,950 0 $0 0 $0
Aggregated Statistics For Year 2003(Based on 6 full and 8 partial tracts) A) Conventional B) Refinancings C) Non-occupant Loans on Number Average Value Number Average Value Number Average Value
LOANS ORIGINATED 122 $172,051 45 $161,544 12 $177,429 APPLICATIONS APPROVED, NOT ACCEPTED 46 $184,887 18 $167,791 15 $224,887 APPLICATIONS DENIED 3 $177,500 5 $74,116 4 $65,280 APPLICATIONS WITHDRAWN 9 $159,217 3 $205,413 0 $0 FILES CLOSED FOR INCOMPLETENESS 2 $188,730 0 $0 0 $0
Aggregated Statistics For Year 2002(Based on 6 full and 8 partial tracts) A) Conventional B) Refinancings C) Non-occupant Loans on Number Average Value Number Average Value Number Average Value
LOANS ORIGINATED 165 $146,574 46 $144,127 34 $128,920 APPLICATIONS APPROVED, NOT ACCEPTED 26 $150,394 11 $139,135 0 $0 APPLICATIONS DENIED 9 $136,171 3 $166,900 5 $141,046 APPLICATIONS WITHDRAWN 17 $133,806 7 $198,211 5 $154,820 FILES CLOSED FOR INCOMPLETENESS 2 $106,745 0 $0 0 $0
Aggregated Statistics For Year 2001(Based on 6 full and 8 partial tracts) A) Conventional B) Refinancings C) Non-occupant Loans on Number Average Value Number Average Value Number Average Value
LOANS ORIGINATED 176 $129,399 40 $137,504 22 $145,635 APPLICATIONS APPROVED, NOT ACCEPTED 23 $141,507 15 $124,960 3 $113,400 APPLICATIONS DENIED 10 $130,334 3 $140,900 1 $206,460 APPLICATIONS WITHDRAWN 15 $127,201 2 $98,840 1 $120,750 FILES CLOSED FOR INCOMPLETENESS 0 $0 1 $183,800 0 $0
Aggregated Statistics For Year 2000(Based on 6 full and 8 partial tracts) A) Conventional B) Refinancings C) Non-occupant Loans on Number Average Value Number Average Value Number Average Value
LOANS ORIGINATED 145 $121,121 13 $119,158 7 $149,277 APPLICATIONS APPROVED, NOT ACCEPTED 15 $69,149 5 $96,626 2 $62,715 APPLICATIONS DENIED 14 $121,716 0 $0 5 $128,646 APPLICATIONS WITHDRAWN 2 $115,645 0 $0 2 $115,645 FILES CLOSED FOR INCOMPLETENESS 5 $127,082 0 $0 0 $0
2005 - 2018 National Fire Incident Reporting System (NFIRS) incidents See full 2006 National Fire Incident Reporting System statistics for zip code 33135, Florida
Most common first names in zip code 33135 among deceased individuals Name Count Lived (average)
Maria 880 82.4 years Jose 583 77.5 years Juan 238 76.4 years Manuel 212 76.5 years Francisco 148 76.9 years Luis 146 74.6 years Carlos 142 71.3 years Antonio 140 77.9 years Pedro 137 77.4 years Juana 131 82.6 years
Most common last names in zip code 33135 among deceased individuals Last name Count Lived (average)
Gonzalez 387 78.0 years Rodriguez 373 78.1 years Garcia 308 77.7 years Perez 278 77.8 years Hernandez 257 75.9 years Fernandez 252 78.0 years Martinez 231 78.4 years Diaz 208 78.7 years Lopez 194 77.6 years Alvarez 142 78.4 years
Businesses in zip code 33135
Name Count Name Count
Advance Auto Parts 1 New Balance 1 AutoZone 1 Nissan 1 Burger King 1 Payless 1 CVS 1 Penske 1 DHL 1 Pizza Hut 1 FedEx 2 RadioShack 1 GameStop 1 Subway 2 H&R Block 2 T-Mobile 1 Home Depot 1 Taco Bell 1 Jones New York 1 Tire Kingdom 1 KFC 1 U-Haul 1 Lane Furniture 1 Walgreens 2 McDonald's 2
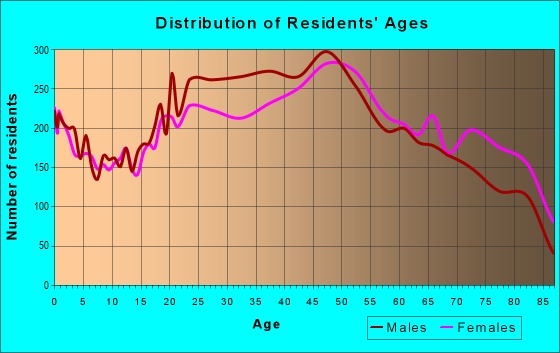
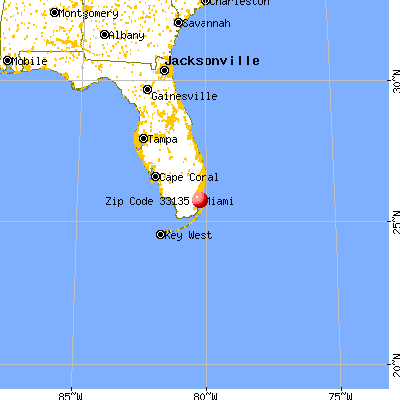


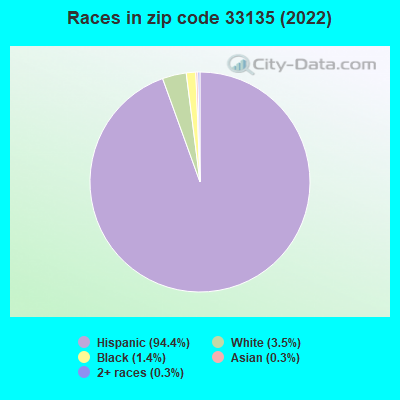


 Nearest zip codes: 33145, 33125, 33130, 33128, 33136, 33134.
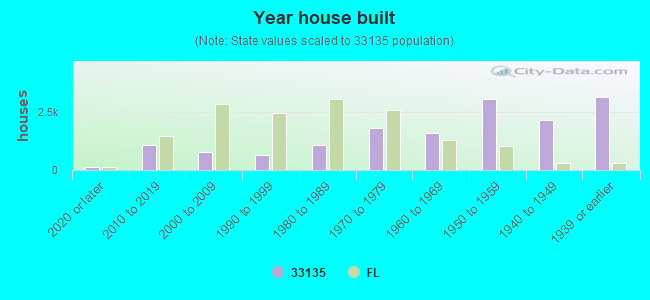

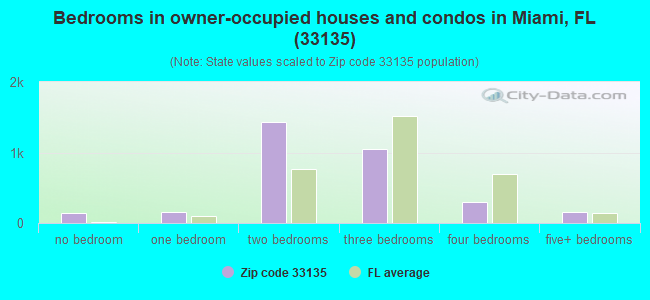
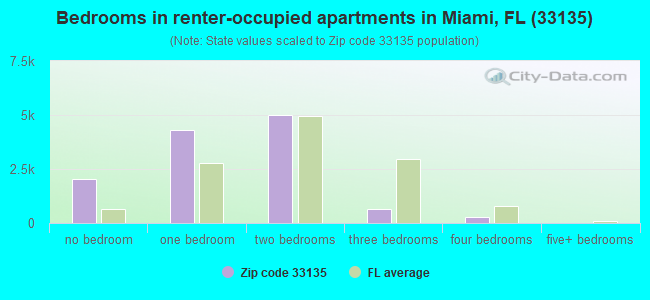
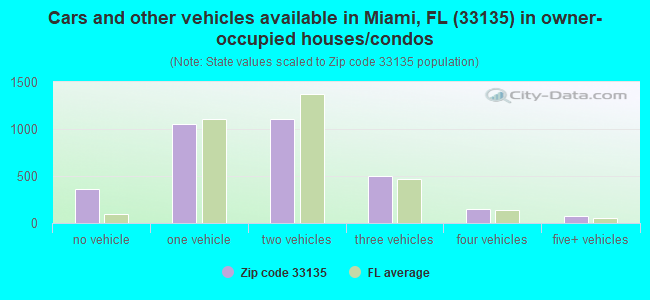
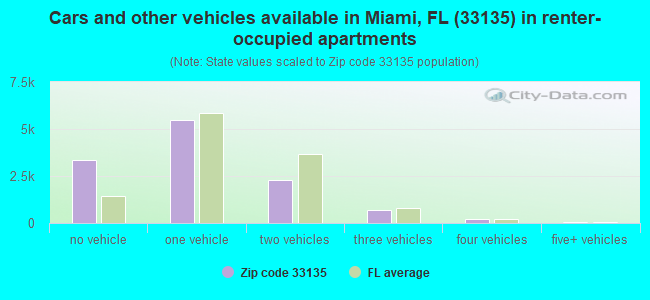

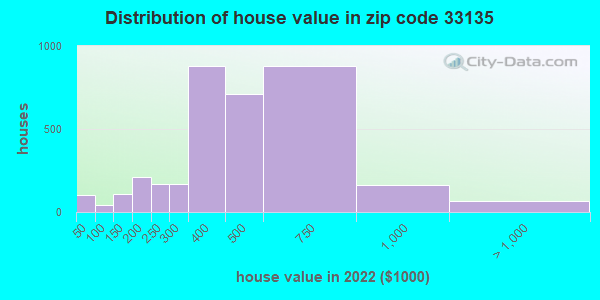
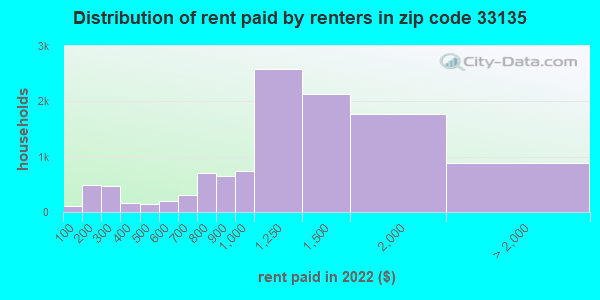
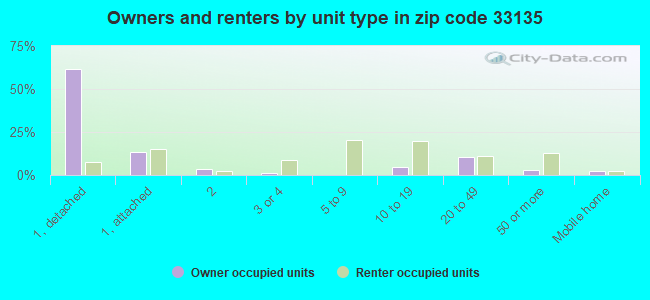
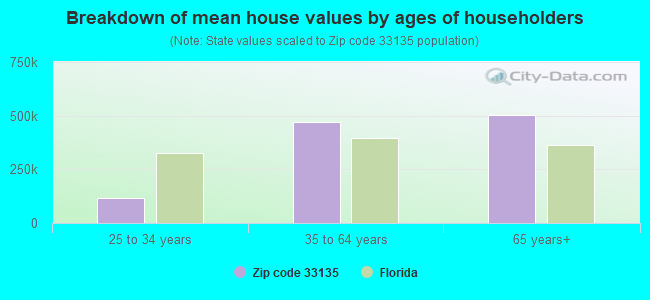

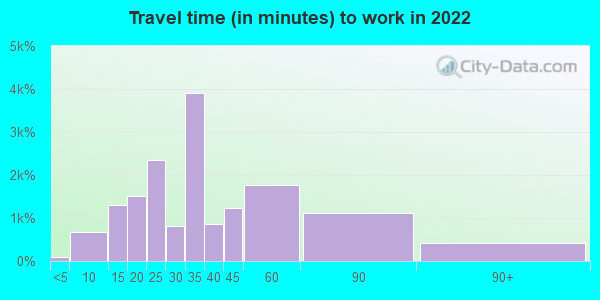
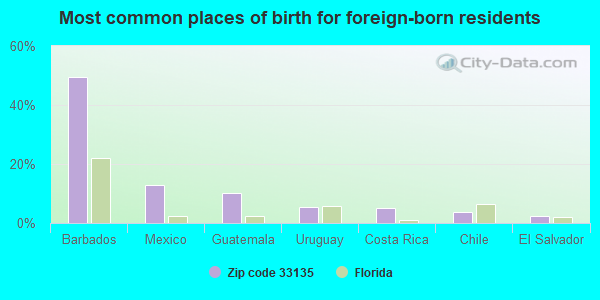
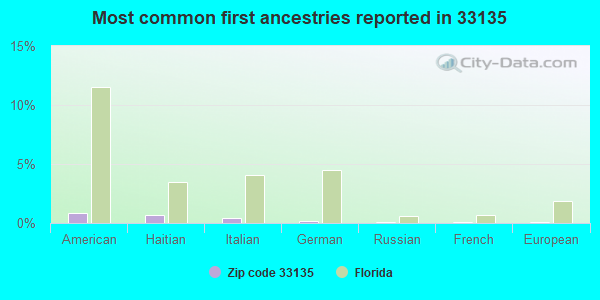
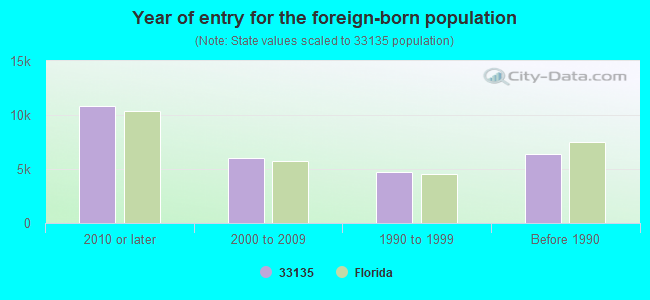


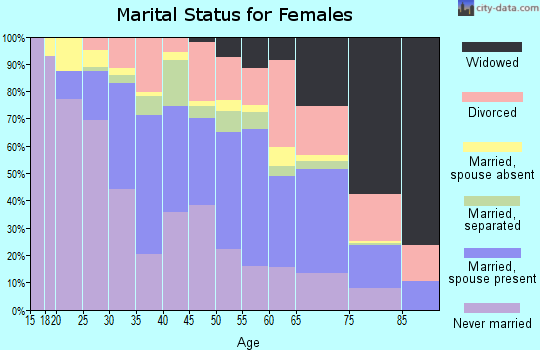
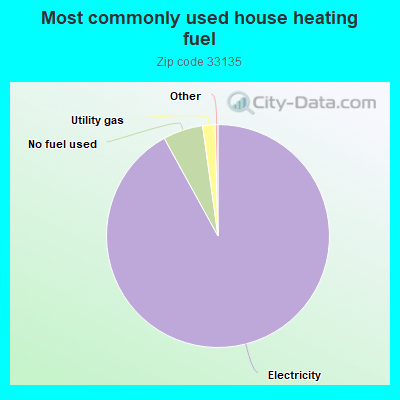
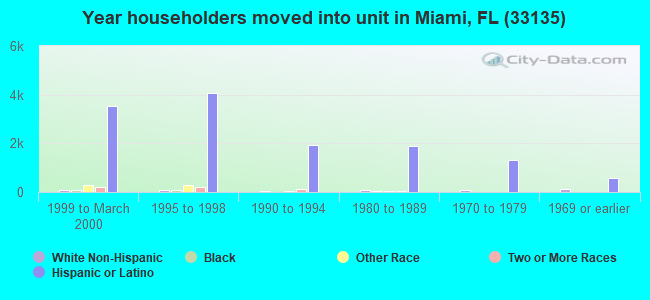
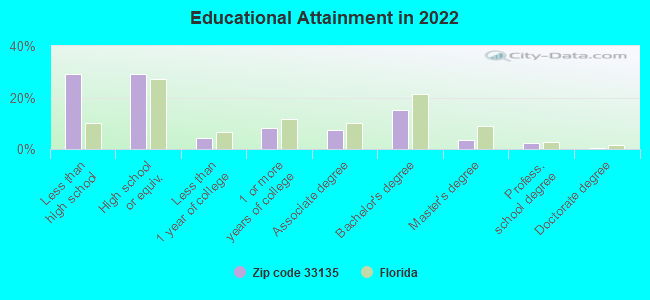
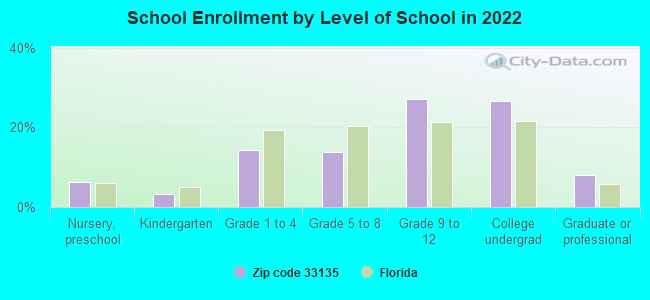
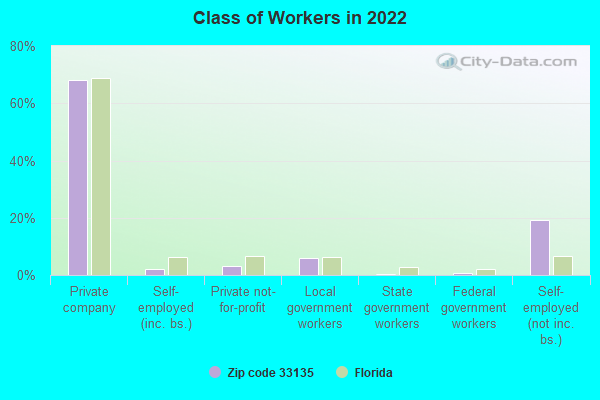
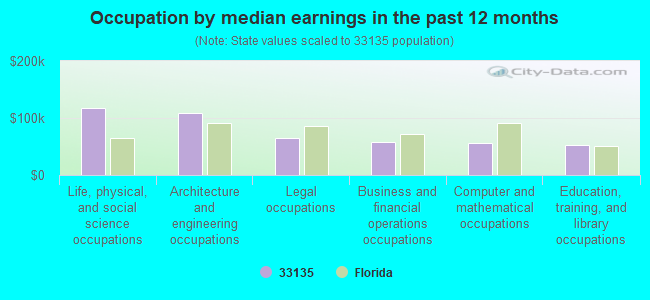
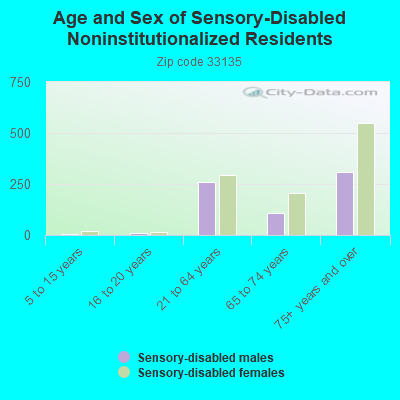
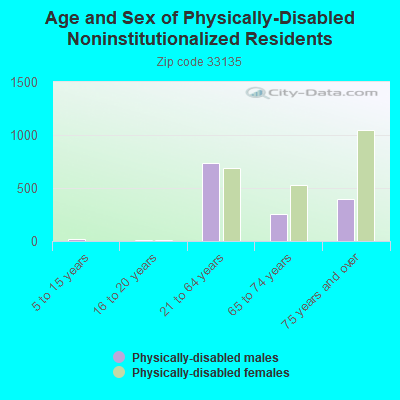
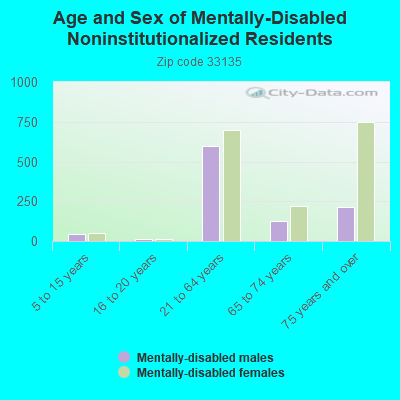
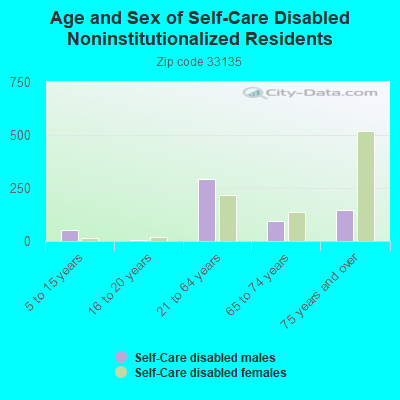
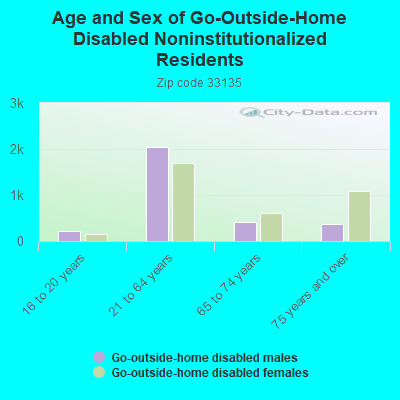
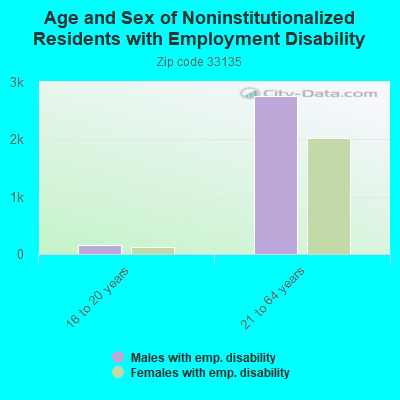
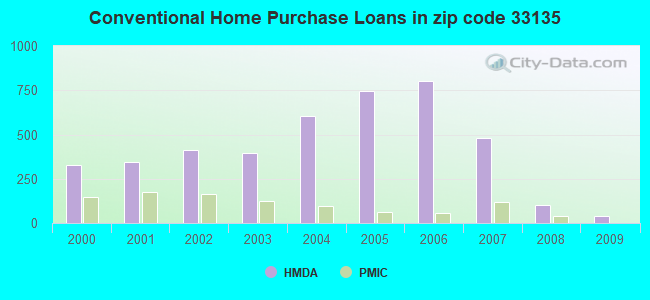
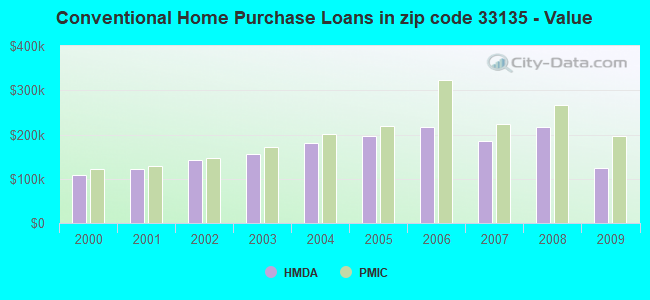
 Based on the data from the years 2005 - 2018 the average number of fire incidents per year is 91. The highest number of fire incidents - 163 took place in 2006, and the least - 55 in 2017. The data has a dropping trend.
 When looking into fire subcategories, the most incidents belonged to: Structure Fires (59.7%), and Mobile Property/Vehicle Fires (19.5%).