Estimated zip code population in 2022: 30,064 Zip code population in 2010: 29,758 Zip code population in 2000: 28,921
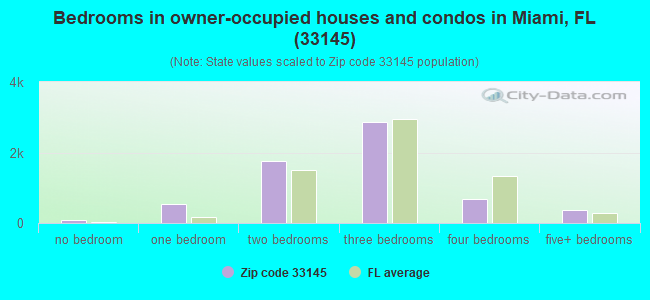
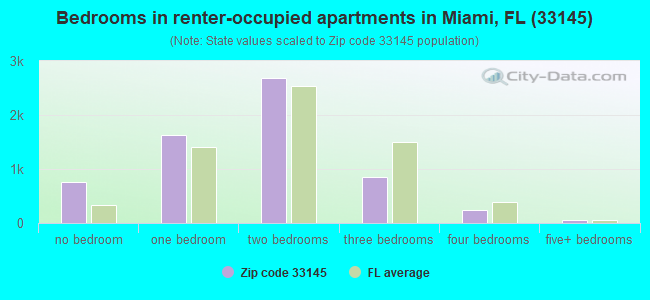
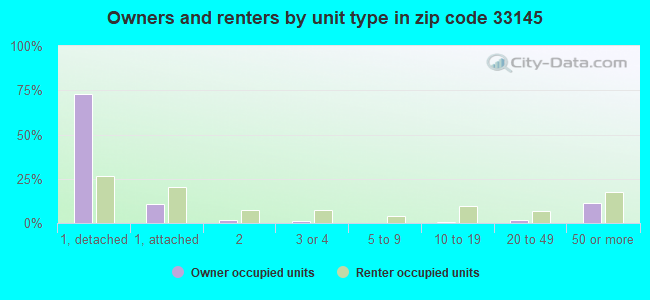
Houses and condos: 13,217 Renter-occupied apartments: 6,162
% of renters here:
50%
State:
33%
March 2022 cost of living index in zip code 33145: 107.1 (more than average, U.S. average is 100)
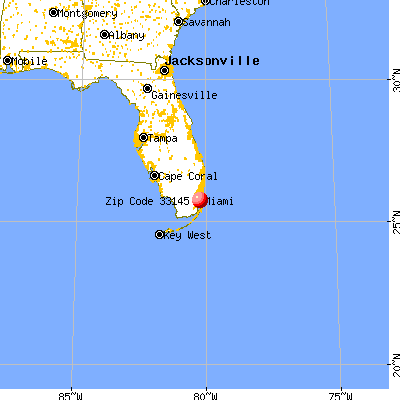
Land area: 2.5 sq. mi. Water area: 0.0 sq. mi.
Population density: 11,841 people per square mile
(high).
OSM Map
General Map
Google Map
MSN Map
OSM Map
General Map
Google Map
MSN Map
OSM Map
General Map
Google Map
MSN Map
OSM Map
General Map
Google Map
MSN Map
Please wait while loading the map...
Real estate property taxes paid for housing units in 2022:
This zip code:
0.6% ($3,714)
Florida:
0.7% ($2,529)
Median real estate property taxes paid for housing units with mortgages in 2022: $4,429 (0.8%) Median real estate property taxes paid for housing units with no mortgage in 2022: $2,893 (0.5%)
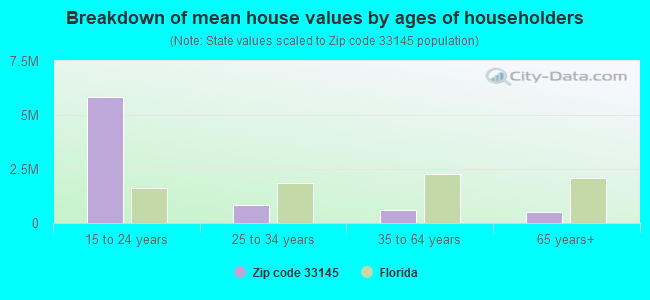
Estimated median house/condo value in 2022: $581,805
33145:
$581,805
Florida:
$354,100
According to our research of Florida and other state lists, there were 8 registered sex offenders living in 33145 zip code as of April 27, 2024. The ratio of all residents to sex offenders in zip code 33145 is 4,118 to 1. The ratio of registered sex offenders to all residents in this zip code is much lower than the state average.
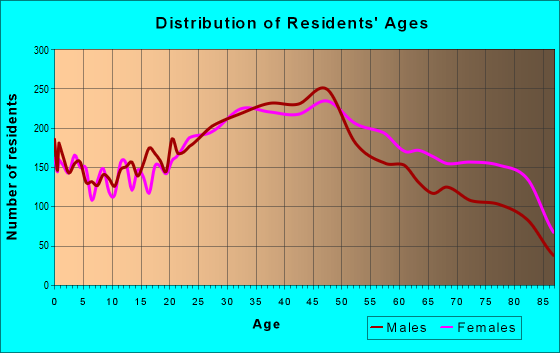
Median resident age:
This zip code:
44.6 years
Florida median age:
42.7 years
Average household size:
This zip code:
2.4 people
Florida:
2.5 people
Averages for the 2020 tax year for zip code 33145, filed in 2021:
Average Adjusted Gross Income (AGI) in 2020: $55,953 (Individual Income Tax Returns)
Here:
$55,953
State:
$82,200
Salary/wage: $55,585 (reported on 74.7% of returns)
Here:
$55,585
State:
$58,347
(% of AGI for various income ranges: 1100.7% for AGIs below $25k, 3734.3% for AGIs $25k-50k, 7018.1% for AGIs $50k-75k, 10430.3% for AGIs $75k-100k, 19944.0% for AGIs $100k-200k, 70894.5% for AGIs over 200k)
Taxable interest for individuals: $2,037 (reported on 18.6% of returns)
This zip code:
$2,037
Florida:
$4,272
(% of AGI for various income ranges: 11.2% for AGIs below $25k, 15.3% for AGIs $25k-50k, 39.4% for AGIs $50k-75k, 88.1% for AGIs $75k-100k, 143.3% for AGIs $100k-200k, 1195.0% for AGIs over 200k)
Ordinary dividends: $5,609 (reported on 11.6% of returns)
Here:
$5,609
State:
$15,863
(% of AGI for various income ranges: 11.0% for AGIs below $25k, 23.3% for AGIs $25k-50k, 46.3% for AGIs $50k-75k, 98.8% for AGIs $75k-100k, 214.9% for AGIs $100k-200k, 2667.3% for AGIs over 200k)
Net capital gain/loss in AGI: +$15,623 (reported on 12.4% of returns)
Here:
+$15,623
State:
+$62,983
(% of AGI for various income ranges: 8.2% for AGIs below $25k, 30.5% for AGIs $25k-50k, 69.4% for AGIs $50k-75k, 190.9% for AGIs $75k-100k, 667.6% for AGIs $100k-200k, 9662.3% for AGIs over 200k)
Profit/loss from business: +$7,398 (reported on 37.7% of returns)
Here:
+$7,398
State:
+$9,719
(% of AGI for various income ranges: 350.8% for AGIs below $25k, 235.5% for AGIs $25k-50k, 214.1% for AGIs $50k-75k, 357.7% for AGIs $75k-100k, 667.2% for AGIs $100k-200k, 4200.0% for AGIs over 200k)
Taxable individual retirement arrangement distribution: $15,502 (reported on 3.4% of returns)
33145:
$15,502
Florida:
$24,823
(% of AGI for various income ranges: 21.0% for AGIs below $25k, 34.0% for AGIs $25k-50k, 81.6% for AGIs $50k-75k, 149.4% for AGIs $75k-100k, 250.9% for AGIs $100k-200k, 890.5% for AGIs over 200k)
Self-employed (Keogh) retirement plans: $31,650 (reported on 0.1% of returns)
33145:
$31,650
Florida:
$29,694
(% of AGI for various income ranges: 74.5% for AGIs $100k-200k)
Total itemized deductions: $36,303 (reported on 7.6% of returns)
Here:
$36,303
State:
$45,393
(% of AGI for various income ranges: 36.4% for AGIs below $25k, 164.8% for AGIs $25k-50k, 315.2% for AGIs $50k-75k, 657.5% for AGIs $75k-100k, 1230.5% for AGIs $100k-200k, 7910.9% for AGIs over 200k)
Charity contributions: $4,841 (reported on 5.3% of returns)
Here:
$4,841
State:
$20,178
(% of AGI for various income ranges: 1.6% for AGIs below $25k, 19.4% for AGIs $25k-50k, 31.9% for AGIs $50k-75k, 78.8% for AGIs $75k-100k, 136.8% for AGIs $100k-200k, 563.6% for AGIs over 200k)
Taxes paid: $7,618 (reported on 7.2% of returns)
33145:
$7,618
State:
$6,967
(% of AGI for various income ranges: 8.8% for AGIs below $25k, 48.0% for AGIs $25k-50k, 91.0% for AGIs $50k-75k, 166.7% for AGIs $75k-100k, 294.9% for AGIs $100k-200k, 865.0% for AGIs over 200k)
Earned income credit: $1,795 (reported on 24.4% of returns)
Here:
$1,795
State:
$2,306
(% of AGI for various income ranges: 109.1% for AGIs below $25k, 57.7% for AGIs $25k-50k)
Percentage of individuals using paid preparers for their 2020 taxes: 88.7%
Here:
89%
State:
92%
(% for various income ranges: 86.0% for AGIs below $25k, 90.6% for AGIs $25k-50k, 91.3% for AGIs $50k-75k, 89.4% for AGIs $75k-100k, 91.6% for AGIs $100k-200k, 90.6% for AGIs over 200k)
Averages for the 2012 tax year for zip code 33145, filed in 2013:
Average Adjusted Gross Income (AGI) in 2012: $38,614 (Individual Income Tax Returns)
Here:
$38,614
State:
$60,316
Salary/wage: $37,889 (reported on 79.8% of returns)
Here:
$37,889
State:
$45,277
(% of AGI for various income ranges: 73.6% for AGIs below $25k, 87.6% for AGIs $25k-50k, 85.1% for AGIs $50k-75k, 84.0% for AGIs $75k-100k, 82.0% for AGIs $100k-200k, 52.9% for AGIs over 200k)
Taxable interest for individuals: $1,800 (reported on 19.4% of returns)
This zip code:
$1,800
Florida:
$3,587
(% of AGI for various income ranges: 0.7% for AGIs below $25k, 0.5% for AGIs $25k-50k, 0.8% for AGIs $50k-75k, 0.4% for AGIs $75k-100k, 0.8% for AGIs $100k-200k, 2.4% for AGIs over 200k)
Ordinary dividends: $6,071 (reported on 7.9% of returns)
Here:
$6,071
State:
$12,831
(% of AGI for various income ranges: 1.1% for AGIs below $25k, 0.9% for AGIs $25k-50k, 0.7% for AGIs $50k-75k, 0.5% for AGIs $75k-100k, 0.9% for AGIs $100k-200k, 3.5% for AGIs over 200k)
Net capital gain/loss in AGI: +$8,940 (reported on 6.4% of returns)
Here:
+$8,940
State:
+$33,493
(% of AGI for various income ranges: 0.4% for AGIs $25k-50k, 0.6% for AGIs $50k-75k, 0.1% for AGIs $75k-100k, 1.4% for AGIs $100k-200k, 7.1% for AGIs over 200k)
Profit/loss from business: +$7,752 (reported on 28.5% of returns)
Here:
+$7,752
State:
+$10,012
(% of AGI for various income ranges: 17.6% for AGIs below $25k, 3.7% for AGIs $25k-50k, 2.0% for AGIs $50k-75k, 2.4% for AGIs $75k-100k, 2.2% for AGIs $100k-200k, 5.8% for AGIs over 200k)
Taxable individual retirement arrangement distribution: $11,256 (reported on 3.7% of returns)
33145:
$11,256
Florida:
$21,544
(% of AGI for various income ranges: 0.9% for AGIs below $25k, 1.0% for AGIs $25k-50k, 1.1% for AGIs $50k-75k, 1.5% for AGIs $75k-100k, 1.3% for AGIs $100k-200k, 0.6% for AGIs over 200k)
Self-employment retirement plans: $4,629 (reported on 0.5% of returns)
33145:
$4,629
Florida:
$20,611
Total itemized deductions: $18,605 (24% of AGI, reported on 21.1% of returns)
Here:
$18,605
State:
$25,533
Here:
23.5% of AGI
State:
18.0% of AGI
(% of AGI for various income ranges: 6.6% for AGIs below $25k, 11.7% for AGIs $25k-50k, 12.8% for AGIs $50k-75k, 11.7% for AGIs $75k-100k, 10.4% for AGIs $100k-200k, 8.0% for AGIs over 200k)
Charity contributions: $2,415 (reported on 15.3% of returns)
Here:
$2,415
State:
$5,698
(% of AGI for various income ranges: 0.3% for AGIs below $25k, 0.9% for AGIs $25k-50k, 1.0% for AGIs $50k-75k, 1.2% for AGIs $75k-100k, 1.0% for AGIs $100k-200k, 1.6% for AGIs over 200k)
Taxes paid: $3,864 (reported on 19.8% of returns)
33145:
$3,864
State:
$6,203
(% of AGI for various income ranges: 0.9% for AGIs below $25k, 1.9% for AGIs $25k-50k, 2.4% for AGIs $50k-75k, 2.4% for AGIs $75k-100k, 2.4% for AGIs $100k-200k, 2.0% for AGIs over 200k)
Earned income credit: $2,079 (reported on 29.5% of returns)
Here:
$2,079
State:
$2,372
(% of AGI for various income ranges: 8.0% for AGIs below $25k, 0.9% for AGIs $25k-50k)
Percentage of individuals using paid preparers for their 2012 taxes: 66.3%
Here:
66%
State:
54%
(% for various income ranges: 66.3% for AGIs below $25k, 65.8% for AGIs $25k-50k, 65.8% for AGIs $50k-75k, 64.8% for AGIs $75k-100k, 67.1% for AGIs $100k-200k, 81.8% for AGIs over 200k)
Averages for the 2004 tax year for zip code 33145, filed in 2005:
Average Adjusted Gross Income (AGI) in 2004: $36,170 (Individual Income Tax Returns)
Here:
$36,170
State:
$50,523
Salary/wage: $31,787 (reported on 80.5% of returns)
Here:
$31,787
State:
$39,563
(% of AGI for various income ranges: 71.0% for AGIs below $10k, 81.8% for AGIs $10k-25k, 89.1% for AGIs $25k-50k, 87.2% for AGIs $50k-75k, 84.6% for AGIs $75k-100k, 41.4% for AGIs over 100k)
Taxable interest for individuals: $1,524 (reported on 30.2% of returns)
This zip code:
$1,524
Florida:
$3,211
(% of AGI for various income ranges: 4.0% for AGIs below $10k, 1.5% for AGIs $10k-25k, 1.1% for AGIs $25k-50k, 1.5% for AGIs $50k-75k, 1.2% for AGIs $75k-100k, 1.0% for AGIs over 100k)
Taxable dividends: $2,892 (reported on 9.2% of returns)
Here:
$2,892
State:
$6,129
(% of AGI for various income ranges: 1.2% for AGIs below $10k, 0.5% for AGIs $10k-25k, 0.3% for AGIs $25k-50k, 0.5% for AGIs $50k-75k, 0.4% for AGIs $75k-100k, 1.3% for AGIs over 100k)
Net capital gain/loss: +$24,203 (reported on 7.7% of returns)
Here:
+$24,203
State:
+$27,205
(% of AGI for various income ranges: 1.4% for AGIs below $10k, 0.3% for AGIs $10k-25k, 0.6% for AGIs $25k-50k, 1.5% for AGIs $50k-75k, 1.5% for AGIs $75k-100k, 13.7% for AGIs over 100k)
Profit/loss from business: +$6,972 (reported on 25.5% of returns)
Here:
+$6,972
State:
+$10,634
(% of AGI for various income ranges: 38.2% for AGIs below $10k, 10.7% for AGIs $10k-25k, 3.5% for AGIs $25k-50k, 2.3% for AGIs $50k-75k, 3.0% for AGIs $75k-100k, 2.0% for AGIs over 100k)
IRA payment deduction: $2,781 (reported on 2.2% of returns)
33145:
$2,781
Florida:
$3,082
(% of AGI for various income ranges: 0.2% for AGIs below $10k, 0.2% for AGIs $10k-25k, 0.3% for AGIs $25k-50k, 0.2% for AGIs $50k-75k, 0.2% for AGIs $75k-100k, 0.1% for AGIs over 100k)
Self-employed pension: $10,333 (reported on 0.1% of returns)
Here:
$10,333
Florida:
$15,857
Total itemized deductions: $16,960 (23% of AGI, reported on 26.7% of returns)
Here:
$16,960
State:
$20,370
Here:
22.9% of AGI
State:
20.7% of AGI
(% of AGI for various income ranges: 7.9% for AGIs below $10k, 12.2% for AGIs $10k-25k, 16.5% for AGIs $25k-50k, 17.9% for AGIs $50k-75k, 15.3% for AGIs $75k-100k, 7.1% for AGIs over 100k)
Charity contributions deductions: $1,713 (2% of AGI, reported on 21.8% of returns)
Here:
$1,713
State:
$4,064
Here:
2.1% of AGI
State:
3.8% of AGI
(% of AGI for various income ranges: 0.3% for AGIs below $10k, 0.8% for AGIs $10k-25k, 1.2% for AGIs $25k-50k, 1.5% for AGIs $50k-75k, 1.3% for AGIs $75k-100k, 0.8% for AGIs over 100k)
Total tax: $4,527 (reported on 73.3% of returns)
33145:
$4,527
State:
$9,431
(% of AGI for various income ranges: 6.9% for AGIs below $10k, 4.1% for AGIs $10k-25k, 6.6% for AGIs $25k-50k, 9.6% for AGIs $50k-75k, 11.8% for AGIs $75k-100k, 12.6% for AGIs over 100k)
Earned income credit: $1,630 (reported on 25.9% of returns)
Here:
$1,630
State:
$1,808
Percentage of individuals using paid preparers for their 2004 taxes: 68.7%
Here:
69%
State:
60%
(% for various income ranges: 67.3% for AGIs below $10k, 71.1% for AGIs $10k-25k, 66.8% for AGIs $25k-50k, 66.0% for AGIs $50k-75k, 65.9% for AGIs $75k-100k, 76.1% for AGIs over 100k)
Likely homosexual households (counted as self-reported same-sex unmarried-partner households)
Lesbian couples: 0.3% of all households
Gay men: 0.4% of all households
Household received Food Stamps/SNAP in the past 12 months: 2,084 Household did not receive Food Stamps/SNAP in the past 12 months: 10,355
Women who had a birth in the past 12 months: 250 (238 now married, 21 unmarried) Women who did not have a birth in the past 12 months: 6,739 (2,158 now married, 4,579 unmarried)
Housing units in zip code 33145 with a mortgage: 3,140 (147 second mortgage, 116 both second mortgage and home equity loan) Houses without a mortgage: 103
Median monthly owner costs for units with a mortgage: $2,437 Median monthly owner costs for units without a mortgage: $603
Residents with income below the poverty level in 2022:
This zip code:
12.0%
Whole state:
12.7%
Residents with income below 50% of the poverty level in 2022:
This zip code:
5.2%
Whole state:
6.6%
Median number of rooms in houses and condos:
Here:
5.7
State:
5.9
Median number of rooms in apartments:
Here:
3.9
State:
4.2
Notable locations in this zip code not listed on our city pages
Notable locations in zip code 33145: Caring Community Center (A), Shenandoah Library (B), Shenandoah Park Day Care Center (C), Rodriguez Day Care Center (D), Miami Coral Way Network Police Station (E), La Premiere Ecole (F), Aurora Medina Family Day Care Home (G), City of Miami Department of Fire Rescue Station 14 (H), Museo Historico Cubano (I). Display/hide their locations on the map
Churches in zip code 33145 include: Calvary Church (A), Shenandoah Church (B), Saint Basil Catholic Church Byzantine Rite (C). Display/hide their locations on the map
2,722 married couples with children.
1,703 single-parent households (175 men, 1,528 women).
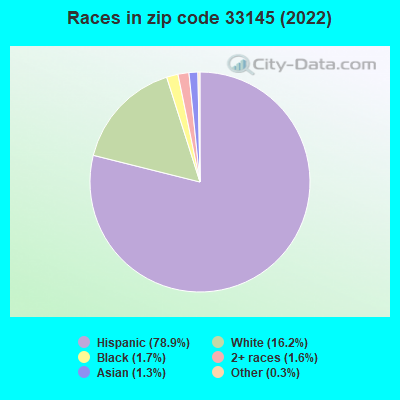
14.5% of residents of 33145 zip code speak English at home.
81.2% of residents speak Spanish at home (55% very well, 16% well, 15% not well, 14% not at all).
3.4% of residents speak other Indo-European language at home (80% very well, 3% well, 17% not well).
1.3% of residents speak Asian or Pacific Island language at home (50% very well, 22% well, 22% not well, 5% not at all).
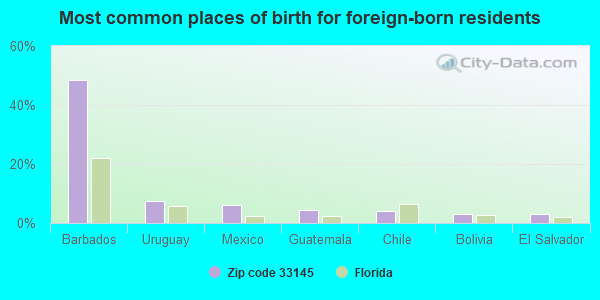
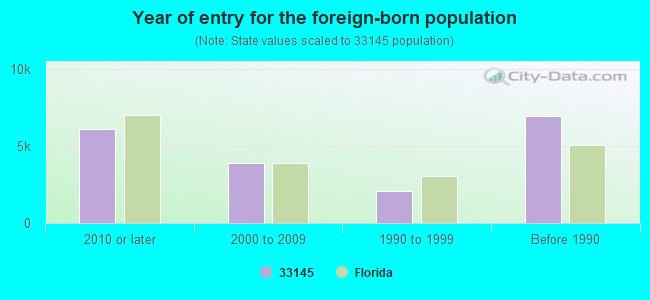
Foreign born population: 18,108 (60.2%) (66.1% of them are naturalized citizens)
Major facilities with environmental interests located in this zip code:
CORAL WAY ELEMENTARY SCHOOL (1950 S.W. 13TH AVENUE in MIAMI, FL)
(Geographic Names Information System) (National Center for Education Statistics) - STATE ID-1121 Small Quantity Generators, between 100 kg and 1000 kg of hazardous waste/month (Resource Conservation and Recovery Act (tracking hazardous waste)) - notification Organizations: MIGDANIA VEGA, PRINCIPAL (CONTACT/OWNER)
, DADE COUNTY SCHOOL DISTRICT (SCHOOL DISTRICT)
Alternative names: DADE CO CORAL WAY ELEMENTARY
SHENANDOAH MIDDLE SCHOOL (1950 S.W. 19TH STREET in MIAMI, FL)
(National Center for Education Statistics) - STATE ID-6841 Organizations: DADE COUNTY SCHOOL DISTRICT (SCHOOL DISTRICT)
A&J CORPORATION (2255 SW 32ND AVE in MIAMI, FL)
AIR MINOR (AIRS/AFS) Small Quantity Generators, between 100 kg and 1000 kg of hazardous waste/month (Resource Conservation and Recovery Act (tracking hazardous waste)) - notification Business SIC classification: DRYCLEANING PLANTS, EXCEPT RUG CLEANING Organizations: ALBERTO LLAMAZARES, PRES (CONTACT/OWNER)
Alternative names: BEST DRY CLEANERS
K.G.B. CLEANERS INC (2241 SW 22ND STREET in MIAMI, FL)
AIR MINOR (AIRS/AFS) Small Quantity Generators, between 100 kg and 1000 kg of hazardous waste/month (Resource Conservation and Recovery Act (tracking hazardous waste)) - notification Business SIC classification: DRYCLEANING PLANTS, EXCEPT RUG CLEANING Organizations: RAFAEL JIMENEZ, OWNER (CONTACT/OWNER)
Alternative names: MIAMI SUPER CLEANERS, MIAMI SUPER CLEANERS INC
LADY LIBERTY INC (2271 CORAL WAY in MIAMI, FL)
AIR MINOR (AIRS/AFS) Small Quantity Generators, between 100 kg and 1000 kg of hazardous waste/month (Resource Conservation and Recovery Act (tracking hazardous waste)) - notification Business SIC classification: DRYCLEANING PLANTS, EXCEPT RUG CLEANING Organizations: RENE RAFFO, OWNER (CONTACT/OWNER)
Alternative names: LADY LIBERTY DRY CLEANER
MAXWELL CLEANERS (1689 SW 27 AVENUE in MIAMI, FL)
AIR MINOR (AIRS/AFS) Small Quantity Generators, between 100 kg and 1000 kg of hazardous waste/month (Resource Conservation and Recovery Act (tracking hazardous waste)) - notification Business SIC classification: DRYCLEANING PLANTS, EXCEPT RUG CLEANING Organizations: RICHARD DIAZ (CONTACT/OWNER)
PARIS CLEANERS OF MIAMI LLC (2922 CORAL WAY in MIAMI, FL)
AIR MINOR (AIRS/AFS) Small Quantity Generators, between 100 kg and 1000 kg of hazardous waste/month (Resource Conservation and Recovery Act (tracking hazardous waste)) - notification Business SIC classification: DRYCLEANING PLANTS, EXCEPT RUG CLEANING Organizations: HEREDIA AGUSTIN, SEC (CONTACT/OWNER)
Alternative names: PARIS DRY CLEANERS
CORAL GATE CLEANERS (2151 CORAL GABLES DR in MIAMI, FL)
AIR MINOR (AIRS/AFS) Small Quantity Generators, between 100 kg and 1000 kg of hazardous waste/month (Resource Conservation and Recovery Act (tracking hazardous waste)) - notification Business SIC classification: DRYCLEANING PLANTS, EXCEPT RUG CLEANING Organizations: EDUARDO MACCONNELL, PRES (CONTACT/OWNER)
5 POINT CLEANERS INC (2231 SW 13TH AVE in MIAMI, FL)
(Resource Conservation and Recovery Act (tracking hazardous waste)) Organizations: MICHAEL BUDWIG, PRES (CONTACT/OWNER)
AST TRANSMISSION INC (1670 SW 27TH AVE in MIAMI, FL)
(Resource Conservation and Recovery Act (tracking hazardous waste)) Organizations: JOSE SANCHEZ (CONTACT/OWNER)
RIVER RUN SOUTH (2415 NW 16 ST ROAD in MIAMI, FL)
National Pollutant Discharge Elimination System NON-MAJOR (Tracking pollutant discharge elimination systems) - permit Organizations: HUMBERTO SANCHEZ (CONTACT/OWNER)
ALL LAUNDRY SERVICE INC (2341 SW 32ND AVENUE in MIAMI, FL)
AIR MINOR (AIRS/AFS) Business SIC classification: DRYCLEANING PLANTS, EXCEPT RUG CLEANING
ANTOINE CLEANING INC (1689 SW 27 AVE in MIAMI, FL)
AIR MINOR (AIRS/AFS) Business SIC classification: DRYCLEANING PLANTS, EXCEPT RUG CLEANING
Housing units lacking complete plumbing facilities: 0.1% Housing units lacking complete kitchen facilities: 1.2%
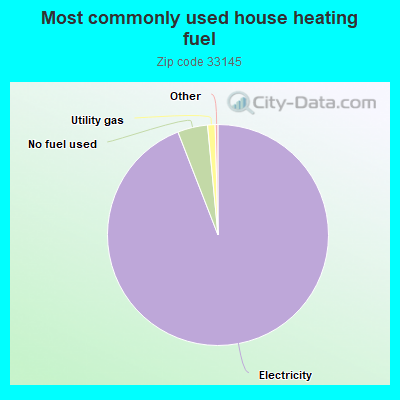
94.1%Electricity
4.4%No fuel used
1.1%Utility gas
Population in 1990: 28,170. Population change in the 1990s: +751 (+2.7%).
Place of birth for U.S.-born residents:
This state: 8,465
Northeast: 1,079
Midwest: 262
South: 700
West: 479
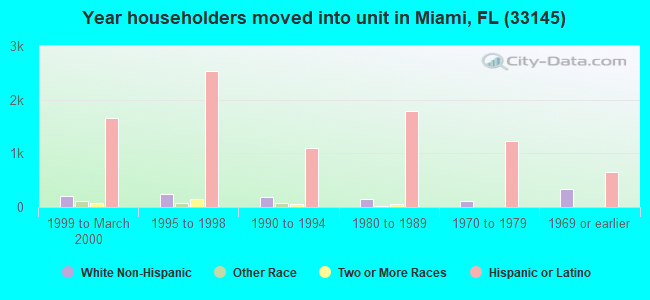
64% of the 33145 zip code residents lived in the same house 5 years ago. Out of people who lived in different houses, 89% lived in this county. Out of people who lived in different counties, 50% lived in Florida.
90% of the 33145 zip code residents lived in the same house 1 year ago. Out of people who lived in different houses, 64% moved from this county. Out of people who lived in different houses, 6% moved from different county within same state. Out of people who lived in different houses, 12% moved from different state. Out of people who lived in different houses, 16% moved from abroad.
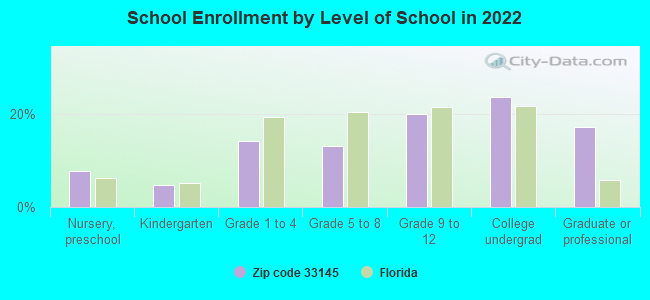
Private vs. public school enrollment:
Students in private schools in grades 1 to 8 (elementary and middle school): 201
Here:
9.6%
Florida:
15.8%
Students in private schools in grades 9 to 12 (high school): 69
Here:
4.5%
Florida:
12.9%
Students in private undergraduate colleges: 143
Here:
8.0%
Florida:
23.6%
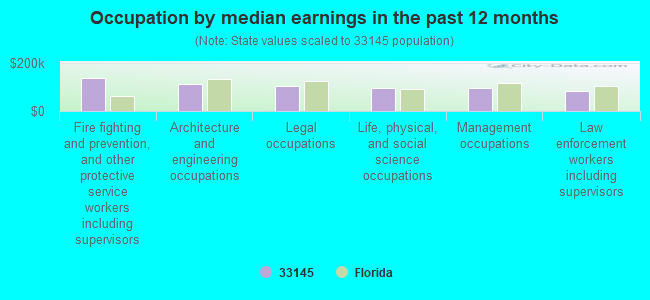
Occupation by median earnings in the past 12 months ($)
139,356Fire fighting and prevention, and other protective service workers including supervisors
110,922Architecture and engineering occupations
104,159Legal occupations
97,421Life, physical, and social science occupations
96,273Management occupations
84,411Law enforcement workers including supervisors
Companies with federal contracts located in this zip code:
INTERNATIONAL DEVELOPMENT ADVI (3134 CORAL WAY, SUITE B in MIAMI, FL; small business)
$79,710 with Air Force for ADP Components. Signed on 2001-07-27. Completion date: 2001-07-13.
AUDICOM, INC (2427 SW 23RD STREET in MIAMI, FL; small business) : $45,697 in 9 contractsfrom 2004 to 2005
Contracts for Translation and Interpreting Services(Including Sign Language), Education Services, Headsets, Handsets, Microphones and Speakers by Navy, Army Signed by year:2000: $0; 2001: $0; 2002: $0; 2003: $0; 2004: $15,413; 2005: $30,284; 2006: $0.
Biggest contracts:
$11,250 with Navy for Translation and Interpreting Services(Including Sign Language). Signed on 2005-08-25. Completion date: 2005-09-01.
$10,060 with Army for Translation and Interpreting Services(Including Sign Language). Signed on 2005-03-08. Completion date: 2005-04-07.
$6,895 with Army for Education Services. Signed on 2004-03-12. Completion date: 2004-03-18.
$6,000 with Army for Translation and Interpreting Services(Including Sign Language). Signed on 2005-02-04. Completion date: 2005-02-11.
KMA CONTRACTING INC (1936 SW 14 TERRACE in MIAMI, FL; small business) : $12,694 in 6 contractsin 2004
Contracts for Other Cargo and Freight Services, Metal Finishing Equipment by Army Signed by year:2000: $0; 2001: $0; 2002: $0; 2003: $0; 2004: $12,694; 2005: $0; 2006: $0.
Biggest contracts:
$15,400 with Army for Other Cargo and Freight Services. Signed on 2004-06-01. Completion date: 2004-11-30.
$11,725, same as above.Signed on 2004-09-23. Completion date: 2004-11-30.
$1,400, same as above.Signed on 2004-07-19. Completion date: 2004-11-30.
$0 with Army for Metal Finishing Equipment. Signed on 2004-01-12. Completion date: 2003-11-30.
vondracek enterprise inc (1671 sw 32 pl in Miami, fl; small business)
$7,144 with Employment and Training Administration for Operation of Government-Owned Facilities -- Other Educational Buildings. Taking place in GA. Signed on 2005-04-20. Completion date: 2005-04-20.
Top industries in this zip code by the number of employees in 2005:
2005 - 2018 National Fire Incident Reporting System (NFIRS) incidents
Based on the data from the years 2005 - 2018 the average number of fire incidents per year is 48. The highest number of reported fire incidents - 70 took place in 2006, and the least - 27 in 2017. The data has a decreasing trend.
When looking into fire subcategories, the most incidents belonged to: Structure Fires (59.7%), and Mobile Property/Vehicle Fires (17.1%).
Fire incident types reported to NFIRS in Zip Code 33145


 Nearest zip codes: 33135, 33133, 33125, 33130, 33134, 33128.


 Based on the data from the years 2005 - 2018 the average number of fire incidents per year is 48. The highest number of reported fire incidents - 70 took place in 2006, and the least - 27 in 2017. The data has a decreasing trend.
 When looking into fire subcategories, the most incidents belonged to: Structure Fires (59.7%), and Mobile Property/Vehicle Fires (17.1%).