Estimated zip code population in 2022: 50,226 Zip code population in 2010: 43,453 Zip code population in 2000: 41,349
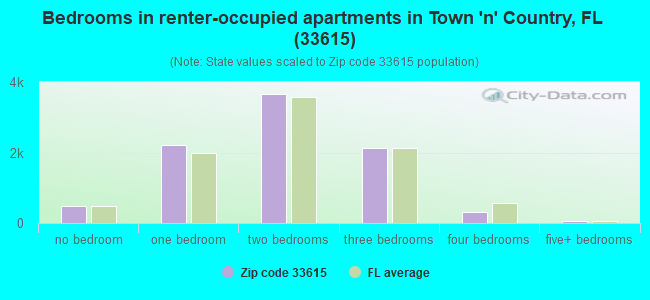
Houses and condos: 21,130 Renter-occupied apartments: 8,830
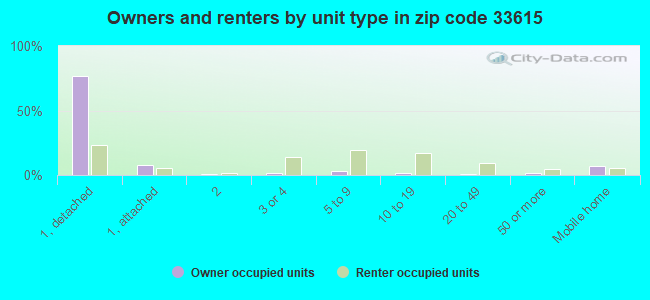
% of renters here:
45%
State:
33%
March 2022 cost of living index in zip code 33615: 99.0 (near average, U.S. average is 100)
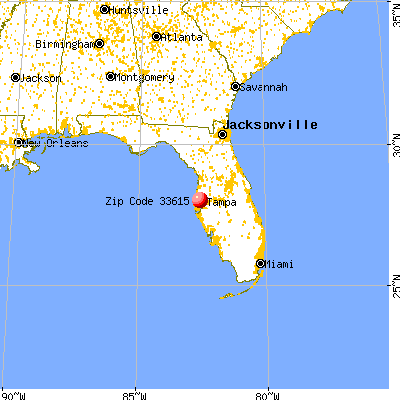
Land area: 8.6 sq. mi. Water area: 1.0 sq. mi.
Population density: 5,825 people per square mile
(average).
OSM Map
General Map
Google Map
MSN Map
OSM Map
General Map
Google Map
MSN Map
OSM Map
General Map
Google Map
MSN Map
OSM Map
General Map
Google Map
MSN Map
Please wait while loading the map...
Real estate property taxes paid for housing units in 2022:
This zip code:
0.6% ($2,014)
Florida:
0.7% ($2,529)
Median real estate property taxes paid for housing units with mortgages in 2022: $2,133 (0.7%) Median real estate property taxes paid for housing units with no mortgage in 2022: $1,588 (0.5%)
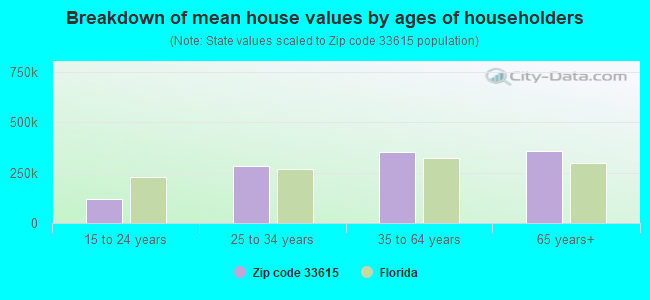
Estimated median house/condo value in 2022: $317,624
33615:
$317,624
Florida:
$354,100
According to our research of Florida and other state lists, there were 34 registered sex offenders living in 33615 zip code as of April 27, 2024. The ratio of all residents to sex offenders in zip code 33615 is 1,381 to 1. The ratio of registered sex offenders to all residents in this zip code is lower than the state average.
Median resident age:
This zip code:
38.8 years
Florida median age:
42.7 years
Average household size:
This zip code:
2.5 people
Florida:
2.5 people
Averages for the 2020 tax year for zip code 33615, filed in 2021:
Average Adjusted Gross Income (AGI) in 2020: $48,918 (Individual Income Tax Returns)
Here:
$48,918
State:
$82,200
Salary/wage: $44,491 (reported on 80.5% of returns)
Here:
$44,491
State:
$58,347
(% of AGI for various income ranges: 1213.4% for AGIs below $25k, 3704.8% for AGIs $25k-50k, 6935.1% for AGIs $50k-75k, 9796.0% for AGIs $75k-100k, 18462.2% for AGIs $100k-200k, 96891.7% for AGIs over 200k)
Taxable interest for individuals: $1,766 (reported on 14.6% of returns)
This zip code:
$1,766
Florida:
$4,272
(% of AGI for various income ranges: 5.1% for AGIs below $25k, 8.8% for AGIs $25k-50k, 22.5% for AGIs $50k-75k, 62.7% for AGIs $75k-100k, 116.0% for AGIs $100k-200k, 1951.1% for AGIs over 200k)
Ordinary dividends: $5,456 (reported on 8.9% of returns)
Here:
$5,456
State:
$15,863
(% of AGI for various income ranges: 6.1% for AGIs below $25k, 12.2% for AGIs $25k-50k, 37.0% for AGIs $50k-75k, 96.3% for AGIs $75k-100k, 271.1% for AGIs $100k-200k, 3935.6% for AGIs over 200k)
Net capital gain/loss in AGI: +$22,651 (reported on 8.9% of returns)
Here:
+$22,651
State:
+$62,983
(% of AGI for various income ranges: 3.4% for AGIs below $25k, 14.8% for AGIs $25k-50k, 58.3% for AGIs $50k-75k, 125.4% for AGIs $75k-100k, 616.1% for AGIs $100k-200k, 23625.0% for AGIs over 200k)
Profit/loss from business: +$6,249 (reported on 30.7% of returns)
Here:
+$6,249
State:
+$9,719
(% of AGI for various income ranges: 211.3% for AGIs below $25k, 210.3% for AGIs $25k-50k, 319.9% for AGIs $50k-75k, 298.5% for AGIs $75k-100k, 457.0% for AGIs $100k-200k, 2066.1% for AGIs over 200k)
Taxable individual retirement arrangement distribution: $17,822 (reported on 4.1% of returns)
33615:
$17,822
Florida:
$24,823
(% of AGI for various income ranges: 18.3% for AGIs below $25k, 32.4% for AGIs $25k-50k, 111.0% for AGIs $50k-75k, 266.4% for AGIs $75k-100k, 739.5% for AGIs $100k-200k, 2006.7% for AGIs over 200k)
Self-employed (Keogh) retirement plans: $19,660 (reported on 0.2% of returns)
33615:
$19,660
Florida:
$29,694
(% of AGI for various income ranges: 14.9% for AGIs $50k-75k, 366.1% for AGIs over 200k)
Total itemized deductions: $29,577 (reported on 4.3% of returns)
Here:
$29,577
State:
$45,393
(% of AGI for various income ranges: 16.0% for AGIs below $25k, 81.8% for AGIs $25k-50k, 207.5% for AGIs $50k-75k, 328.3% for AGIs $75k-100k, 810.1% for AGIs $100k-200k, 6225.6% for AGIs over 200k)
Charity contributions: $7,929 (reported on 3.2% of returns)
Here:
$7,929
State:
$20,178
(% of AGI for various income ranges: 1.3% for AGIs below $25k, 11.0% for AGIs $25k-50k, 32.5% for AGIs $50k-75k, 60.9% for AGIs $75k-100k, 134.8% for AGIs $100k-200k, 1836.7% for AGIs over 200k)
Taxes paid: $6,226 (reported on 4.1% of returns)
33615:
$6,226
State:
$6,967
(% of AGI for various income ranges: 2.5% for AGIs below $25k, 16.3% for AGIs $25k-50k, 39.4% for AGIs $50k-75k, 65.1% for AGIs $75k-100k, 178.2% for AGIs $100k-200k, 1281.7% for AGIs over 200k)
Earned income credit: $2,144 (reported on 28.4% of returns)
Here:
$2,144
State:
$2,306
(% of AGI for various income ranges: 126.6% for AGIs below $25k, 72.5% for AGIs $25k-50k, 0.6% for AGIs $50k-75k)
Percentage of individuals using paid preparers for their 2020 taxes: 87.5%
Here:
88%
State:
92%
(% for various income ranges: 83.8% for AGIs below $25k, 90.1% for AGIs $25k-50k, 90.8% for AGIs $50k-75k, 91.3% for AGIs $75k-100k, 91.2% for AGIs $100k-200k, 90.6% for AGIs over 200k)
Averages for the 2012 tax year for zip code 33615, filed in 2013:
Average Adjusted Gross Income (AGI) in 2012: $42,897 (Individual Income Tax Returns)
Here:
$42,897
State:
$60,316
Salary/wage: $37,708 (reported on 85.2% of returns)
Here:
$37,708
State:
$45,277
(% of AGI for various income ranges: 78.3% for AGIs below $25k, 88.2% for AGIs $25k-50k, 82.6% for AGIs $50k-75k, 78.8% for AGIs $75k-100k, 77.8% for AGIs $100k-200k, 47.7% for AGIs over 200k)
Taxable interest for individuals: $1,594 (reported on 17.8% of returns)
This zip code:
$1,594
Florida:
$3,587
(% of AGI for various income ranges: 0.5% for AGIs below $25k, 0.4% for AGIs $25k-50k, 0.6% for AGIs $50k-75k, 0.5% for AGIs $75k-100k, 0.7% for AGIs $100k-200k, 1.1% for AGIs over 200k)
Ordinary dividends: $6,153 (reported on 10.3% of returns)
Here:
$6,153
State:
$12,831
(% of AGI for various income ranges: 1.6% for AGIs below $25k, 0.8% for AGIs $25k-50k, 1.1% for AGIs $50k-75k, 0.9% for AGIs $75k-100k, 1.8% for AGIs $100k-200k, 2.5% for AGIs over 200k)
Net capital gain/loss in AGI: +$34,511 (reported on 7.0% of returns)
Here:
+$34,511
State:
+$33,493
(% of AGI for various income ranges: 0.4% for AGIs $50k-75k, 0.6% for AGIs $75k-100k, 0.8% for AGIs $100k-200k, 26.0% for AGIs over 200k)
Profit/loss from business: +$7,688 (reported on 18.8% of returns)
Here:
+$7,688
State:
+$10,012
(% of AGI for various income ranges: 11.4% for AGIs below $25k, 1.9% for AGIs $25k-50k, 1.9% for AGIs $50k-75k, 1.9% for AGIs $75k-100k, 1.8% for AGIs $100k-200k, 2.3% for AGIs over 200k)
Taxable individual retirement arrangement distribution: $16,159 (reported on 5.3% of returns)
33615:
$16,159
Florida:
$21,544
(% of AGI for various income ranges: 1.3% for AGIs below $25k, 1.0% for AGIs $25k-50k, 2.3% for AGIs $50k-75k, 2.7% for AGIs $75k-100k, 3.1% for AGIs $100k-200k, 2.3% for AGIs over 200k)
Self-employment retirement plans: $14,250 (reported on 0.2% of returns)
33615:
$14,250
Florida:
$20,611
Total itemized deductions: $19,331 (20% of AGI, reported on 19.3% of returns)
Here:
$19,331
State:
$25,533
Here:
19.7% of AGI
State:
18.0% of AGI
(% of AGI for various income ranges: 6.8% for AGIs below $25k, 9.8% for AGIs $25k-50k, 9.7% for AGIs $50k-75k, 8.8% for AGIs $75k-100k, 10.5% for AGIs $100k-200k, 6.7% for AGIs over 200k)
Charity contributions: $3,061 (reported on 14.1% of returns)
Here:
$3,061
State:
$5,698
(% of AGI for various income ranges: 0.4% for AGIs below $25k, 0.9% for AGIs $25k-50k, 1.1% for AGIs $50k-75k, 1.1% for AGIs $75k-100k, 1.5% for AGIs $100k-200k, 1.1% for AGIs over 200k)
Taxes paid: $3,930 (reported on 18.2% of returns)
33615:
$3,930
State:
$6,203
(% of AGI for various income ranges: 1.0% for AGIs below $25k, 1.3% for AGIs $25k-50k, 1.6% for AGIs $50k-75k, 1.6% for AGIs $75k-100k, 2.5% for AGIs $100k-200k, 2.0% for AGIs over 200k)
Earned income credit: $2,314 (reported on 30.3% of returns)
Here:
$2,314
State:
$2,372
(% of AGI for various income ranges: 9.0% for AGIs below $25k, 1.2% for AGIs $25k-50k)
Percentage of individuals using paid preparers for their 2012 taxes: 44.4%
Here:
44%
State:
54%
(% for various income ranges: 45.0% for AGIs below $25k, 39.4% for AGIs $25k-50k, 44.1% for AGIs $50k-75k, 46.4% for AGIs $75k-100k, 55.4% for AGIs $100k-200k, 74.3% for AGIs over 200k)
Averages for the 2004 tax year for zip code 33615, filed in 2005:
Average Adjusted Gross Income (AGI) in 2004: $37,832 (Individual Income Tax Returns)
Here:
$37,832
State:
$50,523
Salary/wage: $34,523 (reported on 88.8% of returns)
Here:
$34,523
State:
$39,563
(% of AGI for various income ranges: 109.6% for AGIs below $10k, 86.5% for AGIs $10k-25k, 89.7% for AGIs $25k-50k, 84.7% for AGIs $50k-75k, 83.6% for AGIs $75k-100k, 64.6% for AGIs over 100k)
Taxable interest for individuals: $1,235 (reported on 30.0% of returns)
This zip code:
$1,235
Florida:
$3,211
(% of AGI for various income ranges: 2.8% for AGIs below $10k, 0.9% for AGIs $10k-25k, 0.7% for AGIs $25k-50k, 0.8% for AGIs $50k-75k, 1.0% for AGIs $75k-100k, 1.2% for AGIs over 100k)
Taxable dividends: $2,300 (reported on 13.1% of returns)
Here:
$2,300
State:
$6,129
(% of AGI for various income ranges: 2.0% for AGIs below $10k, 0.4% for AGIs $10k-25k, 0.4% for AGIs $25k-50k, 0.5% for AGIs $50k-75k, 0.7% for AGIs $75k-100k, 1.5% for AGIs over 100k)
Net capital gain/loss: +$9,083 (reported on 11.0% of returns)
Here:
+$9,083
State:
+$27,205
(% of AGI for various income ranges: 2.0% for AGIs below $10k, 0.1% for AGIs $10k-25k, 0.3% for AGIs $25k-50k, 0.9% for AGIs $50k-75k, 1.8% for AGIs $75k-100k, 7.7% for AGIs over 100k)
Profit/loss from business: +$7,567 (reported on 14.4% of returns)
Here:
+$7,567
State:
+$10,634
(% of AGI for various income ranges: 10.3% for AGIs below $10k, 5.1% for AGIs $10k-25k, 1.4% for AGIs $25k-50k, 2.1% for AGIs $50k-75k, 2.0% for AGIs $75k-100k, 3.5% for AGIs over 100k)
IRA payment deduction: $2,784 (reported on 2.0% of returns)
33615:
$2,784
Florida:
$3,082
(% of AGI for various income ranges: 0.2% for AGIs below $10k, 0.1% for AGIs $10k-25k, 0.2% for AGIs $25k-50k, 0.2% for AGIs $50k-75k, 0.2% for AGIs $75k-100k, 0.1% for AGIs over 100k)
Self-employed pension: $11,018 (reported on 0.3% of returns)
Here:
$11,018
Florida:
$15,857
(% of AGI for various income ranges: 0.0% for AGIs $10k-25k, 0.0% for AGIs $50k-75k, 0.2% for AGIs over 100k)
Total itemized deductions: $16,063 (22% of AGI, reported on 25.0% of returns)
Here:
$16,063
State:
$20,370
Here:
22.4% of AGI
State:
20.7% of AGI
(% of AGI for various income ranges: 14.4% for AGIs below $10k, 8.4% for AGIs $10k-25k, 10.3% for AGIs $25k-50k, 12.3% for AGIs $50k-75k, 12.3% for AGIs $75k-100k, 9.9% for AGIs over 100k)
Charity contributions deductions: $2,417 (3% of AGI, reported on 20.4% of returns)
Here:
$2,417
State:
$4,064
Here:
3.1% of AGI
State:
3.8% of AGI
(% of AGI for various income ranges: 0.4% for AGIs below $10k, 0.6% for AGIs $10k-25k, 1.0% for AGIs $25k-50k, 1.5% for AGIs $50k-75k, 1.7% for AGIs $75k-100k, 1.7% for AGIs over 100k)
Total tax: $5,791 (reported on 72.4% of returns)
33615:
$5,791
State:
$9,431
(% of AGI for various income ranges: 3.6% for AGIs below $10k, 3.7% for AGIs $10k-25k, 6.8% for AGIs $25k-50k, 9.4% for AGIs $50k-75k, 11.4% for AGIs $75k-100k, 20.4% for AGIs over 100k)
Earned income credit: $1,784 (reported on 22.3% of returns)
Here:
$1,784
State:
$1,808
Percentage of individuals using paid preparers for their 2004 taxes: 50.4%
Here:
50%
State:
60%
(% for various income ranges: 47.8% for AGIs below $10k, 53.2% for AGIs $10k-25k, 47.3% for AGIs $25k-50k, 49.3% for AGIs $50k-75k, 51.9% for AGIs $75k-100k, 61.8% for AGIs over 100k)
Likely homosexual households (counted as self-reported same-sex unmarried-partner households)
Lesbian couples: 0.2% of all households
Gay men: 0.6% of all households
Household received Food Stamps/SNAP in the past 12 months: 2,518 Household did not receive Food Stamps/SNAP in the past 12 months: 17,213
Women who had a birth in the past 12 months: 803 (749 now married, 83 unmarried) Women who did not have a birth in the past 12 months: 12,428 (4,707 now married, 7,719 unmarried)
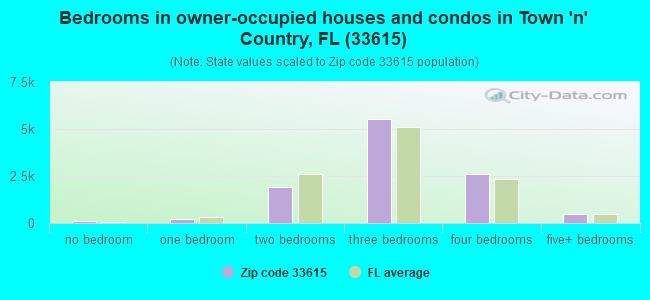
Housing units in zip code 33615 with a mortgage: 7,029 (510 second mortgage, 34 home equity loan, 368 both second mortgage and home equity loan) Houses without a mortgage: 48
Median monthly owner costs for units with a mortgage: $1,566 Median monthly owner costs for units without a mortgage: $597
Residents with income below the poverty level in 2022:
This zip code:
13.3%
Whole state:
12.7%
Residents with income below 50% of the poverty level in 2022:
This zip code:
5.8%
Whole state:
6.6%
Median number of rooms in houses and condos:
Here:
5.7
State:
5.9
Median number of rooms in apartments:
Here:
4.1
State:
4.2
Notable locations in this zip code not listed on our city pages
Notable locations in zip code 33615: Hillsborough Plaza (A), Town And Country Professional Center (B), Memorial Plaza (C), Tarpon Junction (D), West Gate Plaza (E), Hillsborough County Fire Rescue Station 31 West Hillsborough (F), Hillsborough County Sheriff's Office Community Substation Town and Country (G). Display/hide their locations on the map
Churches in zip code 33615 include: Chapel in the Pine Presbyterian Church (A), Iglesia de Dios Camino al Cielo (B), Iglesia de Dios Resugio Etereno (C), Incarnation Catholic Church (D), Lutheran Church of Our Saviour (E), Rocky Creek Baptist Church (F), Sheldon Road Baptist Church (G). Display/hide their locations on the map
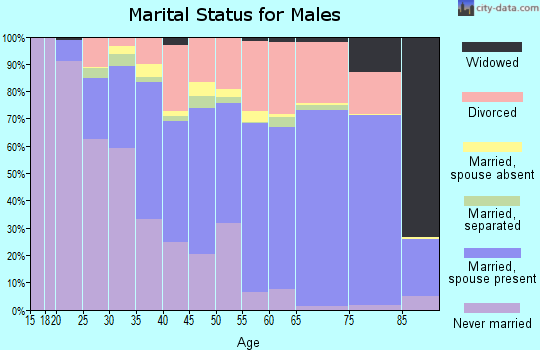
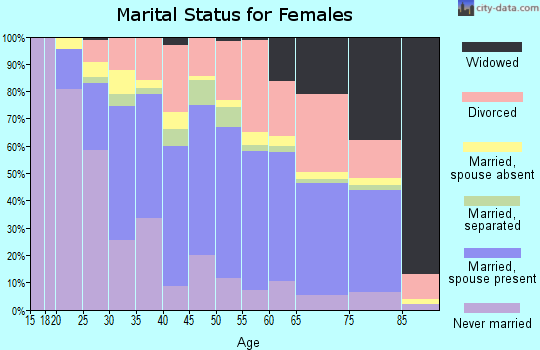
5,142 married couples with children.
3,766 single-parent households (1,139 men, 2,627 women).
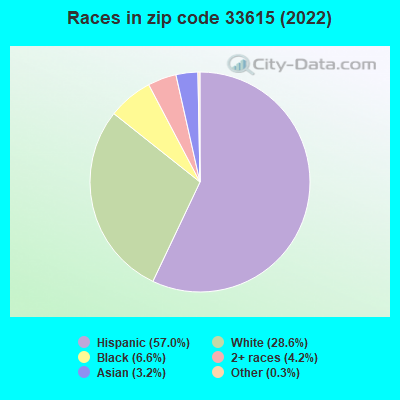
43.0% of residents of 33615 zip code speak English at home.
50.0% of residents speak Spanish at home (44% very well, 21% well, 23% not well, 12% not at all).
3.3% of residents speak other Indo-European language at home (80% very well, 9% well, 10% not well, 2% not at all).
2.9% of residents speak Asian or Pacific Island language at home (52% very well, 25% well, 19% not well, 5% not at all).
0.9% of residents speak other language at home (61% very well, 33% well, 3% not well, 3% not at all).
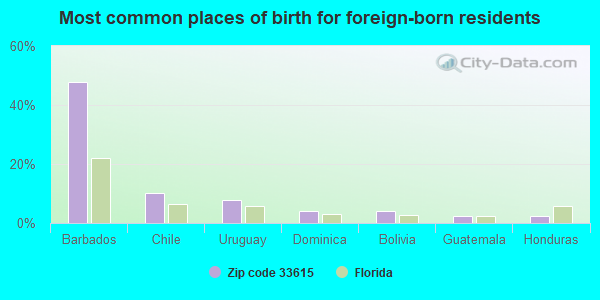
Foreign born population: 18,944 (37.7%) (45.5% of them are naturalized citizens)
This zip code:
37.7%
Whole state:
21.7%
48%Barbados
10%Chile
8%Uruguay
4%Dominica
4%Bolivia
2%Guatemala
2%Honduras
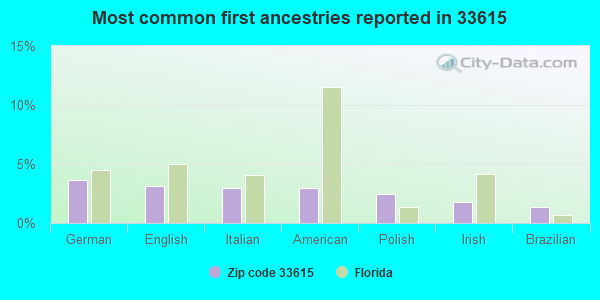
4%German
3%English
3%Italian
3%American
2%Polish
2%Irish
1%Brazilian
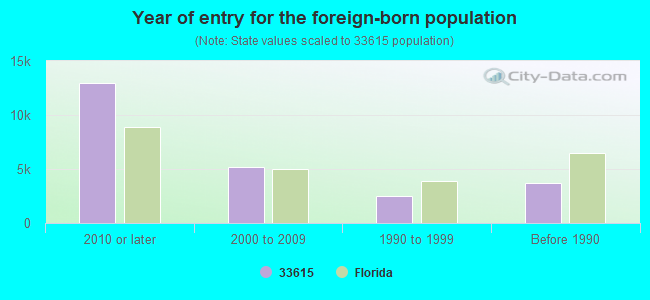
Year of entry for the foreign-born population
12,9462010 or later
5,1402000 to 2009
2,5151990 to 1999
3,680Before 1990
Major facilities with environmental interests located in this zip code:
HILLSBOROUGH COUNTY RIVER OAKS AWWTF (8425 SHELDON ROAD NORTH in TAMPA, FL)
STATE MASTER (FDM) - WAFR-FL0027821, DOMESTIC WASTEWATER PROGRAM, WAFR-FLR05E283, NPDES STORMWATER PROGRAM, NPDES STORMWATER PERMIT (Integrated Compliance Information System) - ICIS-04-1986-0070, FORMAL ENFORCEMENT ACTION CRITERIA AND HAZARDOUS AIR POLLUTANT INVENTORY (Inventory of air pollution sources) National Pollutant Discharge Elimination System MAJOR (Tracking pollutant discharge elimination systems) - permit National Pollutant Discharge Elimination System NON-MAJOR (Tracking pollutant discharge elimination systems) - permit Business SIC classification: SEWERAGE SYSTEMS Business NAICS classification: SEWAGE TREATMENT FACILITIES. Organizations: HILLSBOROUGH COUNTY WATER DEPT., HILLSBOROUGH COUNTY WATER DEPT (VALRICO RESIDUALS MGT. FAC. (CONTACT/APPLICANT)
, RIVER OAKS AWWTP (CONTACT/FACILITY)
, MICHAEL MCWEENY (CONTACT/OWNER)
, HILLSBOROUGH COUNTY WATER DEPT (VALRICO RESIDUALS MGT. FAC. (CONTACT/PERMIT)
, HILLSBOROUGH COUNTY WATER DEPARTMENT (CONTACT/PERMIT)
Alternative names: HILLSBORO CO - RIVER OAKS STP, RIVER OAKS ADVANCED WASTEWATER TREATMENT PLANT, RIVER OAKS AWWTP, RIVIER OAKS ADVANCED WWTP
CITY OF TAMPA (107 NORTH 34TH STREET in TAMPA, FL)
AIR MAJOR (AIRS/AFS) SUPERFUND (Superfund database) (Integrated Compliance Information System) - ICIS-04-1977-0011, FORMAL ENFORCEMENT ACTION CRITERIA AND HAZARDOUS AIR POLLUTANT INVENTORY (Inventory of air pollution sources) National Pollutant Discharge Elimination System NON-MAJOR (Tracking pollutant discharge elimination systems) - permit National Pollutant Discharge Elimination System NON-MAJOR (Tracking pollutant discharge elimination systems) - permit AIR MAJOR ("Best Available" air pollution technologies tracking) Business SIC classification: ELECTRIC SERVICES; REFUSE SYSTEMS Organizations: NANCY MCCANN (CONTACT/OWNER)
Alternative names: CITY OF TAMPA MCKAY BAY REFUSE-TO-ENERGY FACILITY, CITY OF TAMPA MCKAY BAY REFUSE-TO-ENERGY FACILITY, CITY OF TAMPA, SLUDGE DRYER, MCKAY BAY REFUSE TO ENERGY, MCKAY BAY REFUSE-TO-ENERGY COM, MCKAY BAY REFUSE-TO-ENERGY FACILITY, MCKAY BAY REFUSE-TO-ENERGY PROJECT, MCKAY BAY REFUSE-TO-ENERGY FACILITY, MCKAY BAY REFUSE-TO-ENERGY PROJECT, MCKAY BAY REF, TAMPA MUNICIPAL INCINERATOR, THE WHITING-TURNER CONTRACTING
ALLIED TIRES AND SERVICE #2539 (7655 W HILLSBOROUGH in TAMPA, FL)
STATE MASTER (FDM) - CHAZ-FL0000365007, HAZARDOUS WASTE REGULATION PROGRAM Small Quantity Generators, between 100 kg and 1000 kg of hazardous waste/month (Resource Conservation and Recovery Act (tracking hazardous waste)) - notification Business SIC classification: AUTO AND HOME SUPPLY STORES Organizations: ALLIED TIRE SALES INC #22, ANGIE MUCCI, PARALEGAL (CONTACT/OWNER)
, GOODYEAR TIRE AND RUBBER CO (CONTACT/OWNER)
Alternative names: ALLIED TIRE SALES INC #22
PARKHILL SCHOOL - EXCEPTIONAL CENTER (10909 MEMORIAL HWY in TAMPA, FL)
(National Center for Education Statistics) - STATE ID-0782 Organizations: HILLSBOROUGH COUNTY SCHOOL DISTRICT (SCHOOL DISTRICT)
AMOCO SERVICE STATION #935 (7906 W HILLSBOROUGH AVE in TAMPA, FL)
Small Quantity Generators, between 100 kg and 1000 kg of hazardous waste/month (Resource Conservation and Recovery Act (tracking hazardous waste)) - notification (Resource Conservation and Recovery Act (tracking hazardous waste)) Organizations: BRUNO MACIEJEWSKI, DEALER (CONTACT/OWNER)
Alternative names: BUTCHS AMOCO INC
PIPERS MARINE (8888 W HILLSBOROUGH AVE in TAMPA, FL)
Small Quantity Generators, between 100 kg and 1000 kg of hazardous waste/month (Resource Conservation and Recovery Act (tracking hazardous waste)) - notification (Resource Conservation and Recovery Act (tracking hazardous waste)) Organizations: PIPER RON OWNER (CONTACT/OWNER)
, PIPER RON (CONTACT/OWNER)
PERSONAL TOUCH CLEANERS (10075 W HILLSBOROUGH AVE in TAMPA, FL)
AIR MINOR (AIRS/AFS) Business SIC classification: DRYCLEANING PLANTS, EXCEPT RUG CLEANING
KURJI INC (7756 W HILLSBOROUGH AVE in TAMPA, FL)
AIR MINOR (AIRS/AFS) Small Quantity Generators, between 100 kg and 1000 kg of hazardous waste/month (Resource Conservation and Recovery Act (tracking hazardous waste)) - notification Business SIC classification: DRYCLEANING PLANTS, EXCEPT RUG CLEANING Alternative names: TENDER TOUCH CLEANERS
7-ELEVEN STORE #22836 (W. HILLSBOROUGH AVENUE in TAMPA, FL)
National Pollutant Discharge Elimination System NON-MAJOR (Tracking pollutant discharge elimination systems) - permit Organizations: WILLO SMITH (CONTACT/OWNER)
PRESTIGE CLEANERS AND LAUNDRY (7509 W HILLSBOROUGH AVE in TAMPA, FL)
AIR MINOR (AIRS/AFS) Small Quantity Generators, between 100 kg and 1000 kg of hazardous waste/month (Resource Conservation and Recovery Act (tracking hazardous waste)) - notification Business SIC classification: DRYCLEANING PLANTS, EXCEPT RUG CLEANING Organizations: JOE D STINSON (CONTACT/OWNER)
Alternative names: PRESTIGE LAUNDRY SERVICE CORPORATION
SPINNAKER COVE TOWNHOMES (BAY POINTE DRIVE SOUTH OF MEMO in TAMPA, FL)
National Pollutant Discharge Elimination System NON-MAJOR (Tracking pollutant discharge elimination systems) - permit Organizations: MICHAEL WILLENBACHER (CONTACT/OWNER)
SHELDON ROAD DENTAL CENTER (EAST SIDE OF SHELDON ROAD AT 2 in TAMPA, FL)
National Pollutant Discharge Elimination System NON-MAJOR (Tracking pollutant discharge elimination systems) - permit Organizations: JASON LESSER (CONTACT/OWNER)
Alternative names: GREATER BR AIRPORT DISTRICT
Housing units lacking complete plumbing facilities: 0.6% Housing units lacking complete kitchen facilities: 1.5%
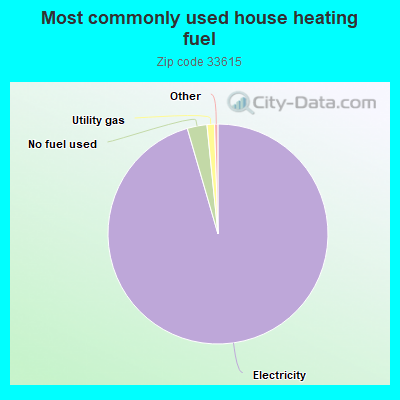
95.6%Electricity
2.9%No fuel used
1.1%Utility gas
Population in 1990: 36,532. Population change in the 1990s: +4,817 (+13.2%).
Place of birth for U.S.-born residents:
This state: 12,914
Northeast: 6,428
Midwest: 3,143
South: 3,646
West: 1,142
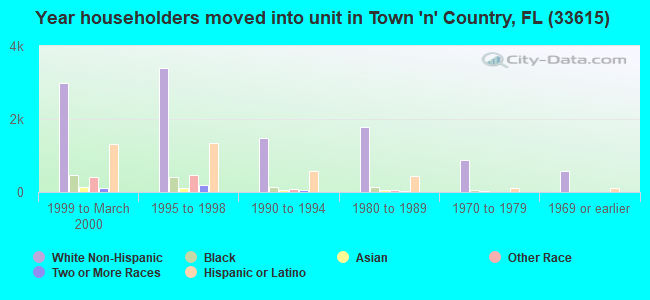
46% of the 33615 zip code residents lived in the same house 5 years ago. Out of people who lived in different houses, 55% lived in this county. Out of people who lived in different counties, 50% lived in Florida.
83% of the 33615 zip code residents lived in the same house 1 year ago. Out of people who lived in different houses, 46% moved from this county. Out of people who lived in different houses, 24% moved from different county within same state. Out of people who lived in different houses, 13% moved from different state. Out of people who lived in different houses, 15% moved from abroad.
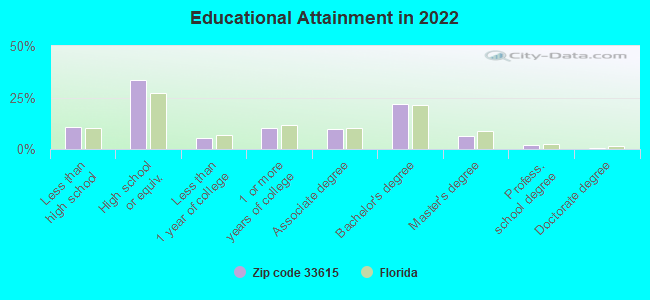
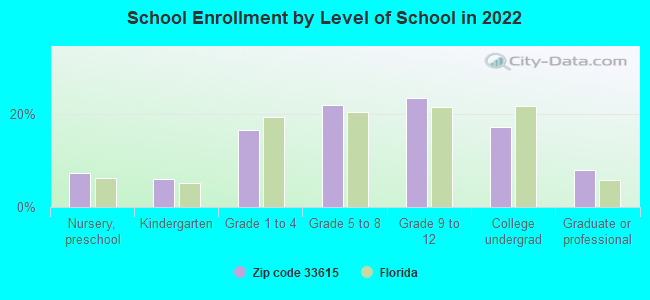
Private vs. public school enrollment:
Students in private schools in grades 1 to 8 (elementary and middle school): 341
Here:
8.6%
Florida:
15.8%
Students in private schools in grades 9 to 12 (high school): 131
Here:
5.4%
Florida:
12.9%
Students in private undergraduate colleges: 688
Here:
37.8%
Florida:
23.6%
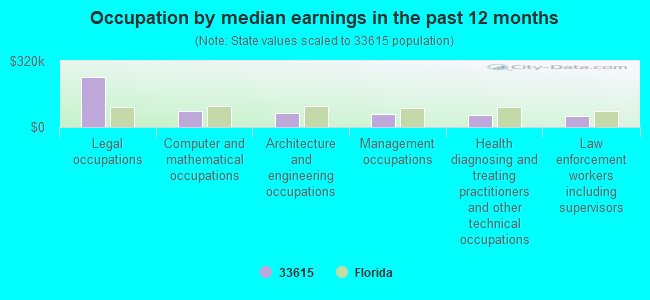
Occupation by median earnings in the past 12 months ($)
244,029Legal occupations
77,326Computer and mathematical occupations
69,214Architecture and engineering occupations
65,255Management occupations
58,546Health diagnosing and treating practitioners and other technical occupations
54,577Law enforcement workers including supervisors
Companies with federal contracts located in this zip code (TAMPA, FL):
J J SOSA & ASSOCIATES INC (6911 PISTOL RANGE ROAD, SU; small business) : $34,413,117 in 276 contractsfrom 2000 to 2006
Contracts for Maintenance, Repair or Alteration of Real Property -- Other Non-Building Facilities, Maintenance, Repair or Alteration of Real Property -- Highways, Roads, Streets, Bridges, and Railways (includes resurfacing), Construction of Structures and Facilities -- Miscellaneous Buildings, Construction of Structures and Facilities -- Other Non-Building Facilities, and moreby Navy, Army, United States Coast Guard (disused code: now 7008), Air Force, and others Signed by year:2000: $889,213; 2001: $6,636,903; 2002: $9,794,657; 2003: $9,753,241; 2004: $1,893,124; 2005: $5,110,225; 2006: $335,754.
Biggest contracts:
$2,764,706 with Navy for Maintenance, Repair or Alteration of Real Property -- Other Non-Building Facilities. Taking place in GA. Signed on 2001-09-28. Completion date: 2002-09-28.
$2,129,811 with Navy for Maintenance, Repair or Alteration of Real Property -- Highways, Roads, Streets, Bridges, and Railways (includes resurfacing). Signed on 2003-09-29. Completion date: 2004-04-19.
$1,825,788 with Army for Construction of Structures and Facilities -- Miscellaneous Buildings. Signed on 2002-09-21. Completion date: 2003-09-29.
$1,700,000 with United States Coast Guard (disused code: now 7008) for Construction of Structures and Facilities -- Other Non-Building Facilities. Signed on 2002-07-15. Completion date: 2003-08-15.
U B CORP (9829 WILSKY BLVD; small business) : $3,716,741 in 90 contractsfrom 1999 to 2006
Contracts for Antennas, Waveguides, and Related Equipment, Radio and Television Communication Equipment, Airborne, Radio and Television Communication Equipment, Except Airborne, Radio Navigation Equipment, Airborne, and moreby Defense Logistics Agency, Navy Signed by year:2000: $628,699; 2001: $819,444; 2002: $440,275; 2003: $161,847; 2004: $471,078; 2005: $665,909; 2006: $436,261.
Biggest contracts:
$201,000 with Defense Logistics Agency for Antennas, Waveguides, and Related Equipment. Signed on 2006-05-18. Completion date: 2006-11-16.
$175,187, same as above.Signed on 2000-03-08. Completion date: 2000-09-04.
$145,730, same as above.Signed on 2004-03-04. Completion date: 2004-08-07.
$125,700, same as above.Signed on 2001-09-17. Completion date: 2002-07-14.
AMERICAN DATA & COMPUTER PRODU (4505 TOWN N COUNTRY BLVD; small business) : $158,120 in 8 contractsfrom 2002 to 2005
Contracts for ADP Input/Output and Storage Devices, ADP Supplies, ADP Components, Mini and Micro Computer Control Devices, and moreby Department of Defense, Air Force, Geological Survey, Army, and others Signed by year:2000: $0; 2001: $0; 2002: $3,155; 2003: $3,462; 2004: $27,258; 2005: $124,245; 2006: $0.
Biggest contracts:
$42,302 with Department of Defense for ADP Input/Output and Storage Devices. Signed on 2005-03-03. Completion date: 2005-04-04.
$35,618, same as above.Signed on 2005-03-03. Completion date: 2005-04-04.
$25,536, same as above.Signed on 2005-03-03. Completion date: 2005-03-03.
$22,711 with Air Force for ADP Supplies. Signed on 2004-10-26. Completion date: 2004-11-24.
TEKMETHODS, LLC (8466 FLAGSTONE DR; small business)
$34,889 with Air Force for Systems Engineering Services. Signed on 2004-10-01. Completion date: 2005-09-30.
R COOPER ENGINEERING, P A (7113 SHENANDOAH CT; small business)
-$1,179 with Air Force for Other Professional Services. Signed on 2005-02-24. Completion date: 2002-05-31.
Top industries in this zip code by the number of employees in 2005:
Health Care and Social Assistance: General Medical and Surgical Hospitals (500-999 employees: 1 establishment)
2007 - 2018 National Fire Incident Reporting System (NFIRS) incidents
Based on the data from the years 2007 - 2018 the average number of fires per year is 36. The highest number of fires - 89 took place in 2011, and the least - 0 in 2008. The data has an increasing trend.
When looking into fire subcategories, the most incidents belonged to: Structure Fires (43.0%), and Outside Fires (35.2%).
Fire incident types reported to NFIRS in Zip Code 33615


 Nearest zip codes: 33634, 33635, 33625, 33626, 33614, 33609.


 Based on the data from the years 2007 - 2018 the average number of fires per year is 36. The highest number of fires - 89 took place in 2011, and the least - 0 in 2008. The data has an increasing trend.
 When looking into fire subcategories, the most incidents belonged to: Structure Fires (43.0%), and Outside Fires (35.2%).