Estimated zip code population in 2022: 18,000 Zip code population in 2010: 15,351 Zip code population in 2000: 12,534
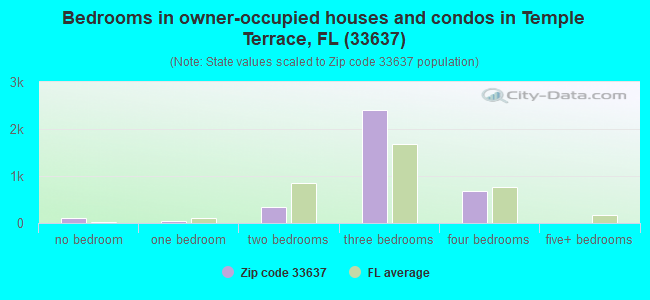
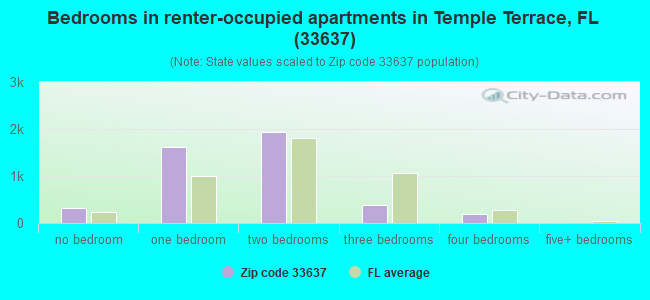
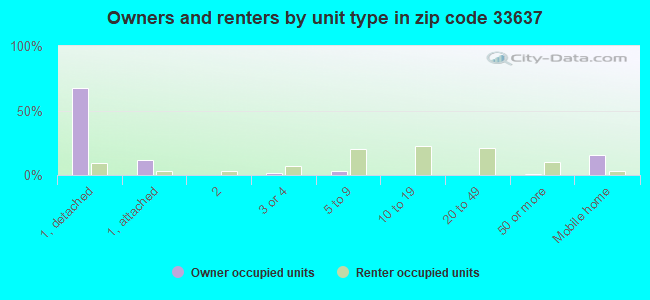
Houses and condos: 8,402 Renter-occupied apartments: 4,392
% of renters here:
55%
State:
33%
March 2022 cost of living index in zip code 33637: 98.1 (near average, U.S. average is 100)
Land area: 7.8 sq. mi. Water area: 0.5 sq. mi.
Population density: 2,318 people per square mile
(low).
OSM Map
General Map
Google Map
MSN Map
OSM Map
General Map
Google Map
MSN Map
OSM Map
General Map
Google Map
MSN Map
OSM Map
General Map
Google Map
MSN Map
Please wait while loading the map...
Real estate property taxes paid for housing units in 2022:
This zip code:
0.7% ($1,739)
Florida:
0.7% ($2,529)
Median real estate property taxes paid for housing units with mortgages in 2022: $1,836 (0.7%) Median real estate property taxes paid for housing units with no mortgage in 2022: $1,262 (0.6%)
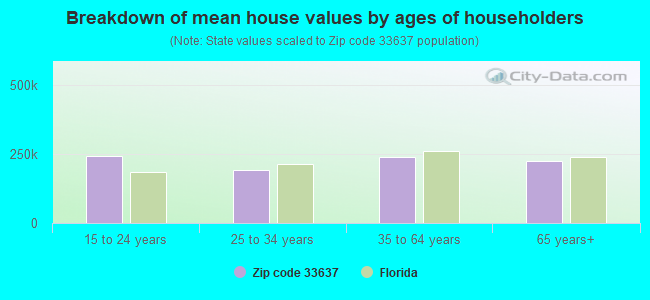
Estimated median house/condo value in 2022: $251,942
33637:
$251,942
Florida:
$354,100
According to our research of Florida and other state lists, there were 13 registered sex offenders living in 33637 zip code as of April 27, 2024. The ratio of all residents to sex offenders in zip code 33637 is 1,218 to 1. The ratio of registered sex offenders to all residents in this zip code is lower than the state average.
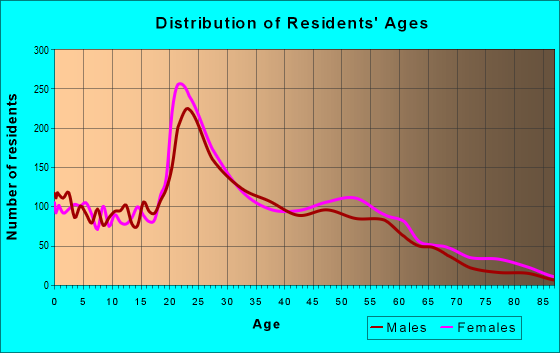
Median resident age:
This zip code:
34.0 years
Florida median age:
42.7 years
Average household size:
This zip code:
2.3 people
Florida:
2.5 people
Averages for the 2020 tax year for zip code 33637, filed in 2021:
Average Adjusted Gross Income (AGI) in 2020: $45,003 (Individual Income Tax Returns)
Here:
$45,003
State:
$82,200
Salary/wage: $41,226 (reported on 87.4% of returns)
Here:
$41,226
State:
$58,347
(% of AGI for various income ranges: 1291.8% for AGIs below $25k, 3841.7% for AGIs $25k-50k, 6901.9% for AGIs $50k-75k, 10299.5% for AGIs $75k-100k, 17247.1% for AGIs $100k-200k, 63716.7% for AGIs over 200k)
Taxable interest for individuals: $1,119 (reported on 12.9% of returns)
This zip code:
$1,119
Florida:
$4,272
(% of AGI for various income ranges: 5.1% for AGIs below $25k, 11.2% for AGIs $25k-50k, 17.9% for AGIs $50k-75k, 18.6% for AGIs $75k-100k, 120.3% for AGIs $100k-200k, 673.3% for AGIs over 200k)
Ordinary dividends: $2,692 (reported on 8.3% of returns)
Here:
$2,692
State:
$15,863
(% of AGI for various income ranges: 5.4% for AGIs below $25k, 7.7% for AGIs $25k-50k, 19.0% for AGIs $50k-75k, 28.2% for AGIs $75k-100k, 202.0% for AGIs $100k-200k, 2223.3% for AGIs over 200k)
Net capital gain/loss in AGI: +$6,292 (reported on 8.8% of returns)
Here:
+$6,292
State:
+$62,983
(% of AGI for various income ranges: 1.1% for AGIs below $25k, 19.2% for AGIs $25k-50k, 16.1% for AGIs $50k-75k, 63.4% for AGIs $75k-100k, 540.0% for AGIs $100k-200k, 7306.7% for AGIs over 200k)
Profit/loss from business: +$4,709 (reported on 18.6% of returns)
Here:
+$4,709
State:
+$9,719
(% of AGI for various income ranges: 94.5% for AGIs below $25k, 51.2% for AGIs $25k-50k, 110.3% for AGIs $50k-75k, 201.4% for AGIs $75k-100k, 239.1% for AGIs $100k-200k, 3590.0% for AGIs over 200k)
Taxable individual retirement arrangement distribution: $17,881 (reported on 4.0% of returns)
33637:
$17,881
Florida:
$24,823
(% of AGI for various income ranges: 25.8% for AGIs below $25k, 32.1% for AGIs $25k-50k, 110.4% for AGIs $50k-75k, 194.1% for AGIs $75k-100k, 875.7% for AGIs $100k-200k)
Total itemized deductions: $33,233 (reported on 3.0% of returns)
Here:
$33,233
State:
$45,393
(% of AGI for various income ranges: 11.8% for AGIs below $25k, 71.4% for AGIs $25k-50k, 167.5% for AGIs $50k-75k, 272.5% for AGIs $75k-100k, 541.7% for AGIs $100k-200k, 6776.7% for AGIs over 200k)
Charity contributions: $13,665 (reported on 2.2% of returns)
Here:
$13,665
State:
$20,178
(% of AGI for various income ranges: 10.7% for AGIs $25k-50k, 47.3% for AGIs $50k-75k, 76.1% for AGIs $75k-100k, 153.4% for AGIs $100k-200k, 3693.3% for AGIs over 200k)
Taxes paid: $4,354 (reported on 2.8% of returns)
33637:
$4,354
State:
$6,967
(% of AGI for various income ranges: 11.5% for AGIs $25k-50k, 24.6% for AGIs $50k-75k, 34.8% for AGIs $75k-100k, 68.0% for AGIs $100k-200k, 673.3% for AGIs over 200k)
Earned income credit: $2,479 (reported on 25.2% of returns)
Here:
$2,479
State:
$2,306
(% of AGI for various income ranges: 131.2% for AGIs below $25k, 72.6% for AGIs $25k-50k, 1.6% for AGIs $50k-75k)
Percentage of individuals using paid preparers for their 2020 taxes: 92.8%
Here:
93%
State:
92%
(% for various income ranges: 91.9% for AGIs below $25k, 93.9% for AGIs $25k-50k, 93.2% for AGIs $50k-75k, 91.9% for AGIs $75k-100k, 93.1% for AGIs $100k-200k, 90.0% for AGIs over 200k)
Averages for the 2012 tax year for zip code 33637, filed in 2013:
Average Adjusted Gross Income (AGI) in 2012: $36,854 (Individual Income Tax Returns)
Here:
$36,854
State:
$60,316
Salary/wage: $35,058 (reported on 86.6% of returns)
Here:
$35,058
State:
$45,277
(% of AGI for various income ranges: 78.7% for AGIs below $25k, 89.0% for AGIs $25k-50k, 85.7% for AGIs $50k-75k, 83.2% for AGIs $75k-100k, 79.2% for AGIs $100k-200k, 49.8% for AGIs over 200k)
Taxable interest for individuals: $1,134 (reported on 16.7% of returns)
This zip code:
$1,134
Florida:
$3,587
(% of AGI for various income ranges: 1.0% for AGIs below $25k, 0.3% for AGIs $25k-50k, 0.5% for AGIs $50k-75k, 0.3% for AGIs $75k-100k, 0.6% for AGIs $100k-200k, 0.9% for AGIs over 200k)
Ordinary dividends: $6,349 (reported on 10.2% of returns)
Here:
$6,349
State:
$12,831
(% of AGI for various income ranges: 4.2% for AGIs below $25k, 1.8% for AGIs $25k-50k, 1.3% for AGIs $50k-75k, 0.5% for AGIs $75k-100k, 1.2% for AGIs $100k-200k)
Net capital gain/loss in AGI: +$4,270 (reported on 6.4% of returns)
Here:
+$4,270
State:
+$33,493
(% of AGI for various income ranges: 0.3% for AGIs below $25k, 0.2% for AGIs $25k-50k, 0.7% for AGIs $50k-75k, 0.2% for AGIs $75k-100k, 2.9% for AGIs $100k-200k)
Profit/loss from business: +$6,289 (reported on 14.2% of returns)
Here:
+$6,289
State:
+$10,012
(% of AGI for various income ranges: 7.6% for AGIs below $25k, 1.0% for AGIs $25k-50k, 0.2% for AGIs $50k-75k, 2.9% for AGIs $75k-100k, 2.8% for AGIs $100k-200k)
Taxable individual retirement arrangement distribution: $13,188 (reported on 4.7% of returns)
33637:
$13,188
Florida:
$21,544
(% of AGI for various income ranges: 1.3% for AGIs below $25k, 1.2% for AGIs $25k-50k, 1.9% for AGIs $50k-75k, 1.7% for AGIs $75k-100k, 3.3% for AGIs $100k-200k)
Total itemized deductions: $17,307 (25% of AGI, reported on 16.7% of returns)
Here:
$17,307
State:
$25,533
Here:
24.7% of AGI
State:
18.0% of AGI
(% of AGI for various income ranges: 4.7% for AGIs below $25k, 6.8% for AGIs $25k-50k, 9.0% for AGIs $50k-75k, 9.9% for AGIs $75k-100k, 10.5% for AGIs $100k-200k, 6.4% for AGIs over 200k)
Charity contributions: $4,384 (reported on 12.7% of returns)
Here:
$4,384
State:
$5,698
(% of AGI for various income ranges: 0.5% for AGIs below $25k, 1.1% for AGIs $25k-50k, 1.6% for AGIs $50k-75k, 2.0% for AGIs $75k-100k, 2.8% for AGIs $100k-200k, 1.6% for AGIs over 200k)
Taxes paid: $2,625 (reported on 15.8% of returns)
33637:
$2,625
State:
$6,203
(% of AGI for various income ranges: 0.4% for AGIs below $25k, 0.8% for AGIs $25k-50k, 1.1% for AGIs $50k-75k, 1.6% for AGIs $75k-100k, 2.0% for AGIs $100k-200k, 1.8% for AGIs over 200k)
Earned income credit: $2,391 (reported on 26.0% of returns)
Here:
$2,391
State:
$2,372
(% of AGI for various income ranges: 7.8% for AGIs below $25k, 1.2% for AGIs $25k-50k)
Percentage of individuals using paid preparers for their 2012 taxes: 39.8%
Here:
40%
State:
54%
(% for various income ranges: 40.0% for AGIs below $25k, 37.2% for AGIs $25k-50k, 38.4% for AGIs $50k-75k, 42.1% for AGIs $75k-100k, 52.9% for AGIs $100k-200k, 75.0% for AGIs over 200k)
Averages for the 2004 tax year for zip code 33637, filed in 2005:
Average Adjusted Gross Income (AGI) in 2004: $33,905 (Individual Income Tax Returns)
Here:
$33,905
State:
$50,523
Salary/wage: $32,292 (reported on 92.0% of returns)
Here:
$32,292
State:
$39,563
(% of AGI for various income ranges: 104.8% for AGIs below $10k, 88.1% for AGIs $10k-25k, 92.7% for AGIs $25k-50k, 89.1% for AGIs $50k-75k, 87.9% for AGIs $75k-100k, 71.2% for AGIs over 100k)
Taxable interest for individuals: $1,218 (reported on 28.1% of returns)
This zip code:
$1,218
Florida:
$3,211
(% of AGI for various income ranges: 2.0% for AGIs below $10k, 0.9% for AGIs $10k-25k, 0.4% for AGIs $25k-50k, 0.6% for AGIs $50k-75k, 1.3% for AGIs $75k-100k, 2.7% for AGIs over 100k)
Taxable dividends: $1,485 (reported on 10.8% of returns)
Here:
$1,485
State:
$6,129
(% of AGI for various income ranges: 1.2% for AGIs below $10k, 0.5% for AGIs $10k-25k, 0.3% for AGIs $25k-50k, 0.6% for AGIs $50k-75k, 0.5% for AGIs $75k-100k, 0.7% for AGIs over 100k)
Net capital gain/loss: +$3,861 (reported on 8.6% of returns)
Here:
+$3,861
State:
+$27,205
(% of AGI for various income ranges: -1.4% for AGIs below $10k, 0.1% for AGIs $10k-25k, 0.0% for AGIs $25k-50k, 0.7% for AGIs $50k-75k, -0.0% for AGIs $75k-100k, 5.6% for AGIs over 100k)
Profit/loss from business: +$6,589 (reported on 10.7% of returns)
Here:
+$6,589
State:
+$10,634
(% of AGI for various income ranges: 4.2% for AGIs below $10k, 4.0% for AGIs $10k-25k, 0.8% for AGIs $25k-50k, 1.9% for AGIs $50k-75k, 2.7% for AGIs $75k-100k, 2.3% for AGIs over 100k)
IRA payment deduction: $2,421 (reported on 2.0% of returns)
33637:
$2,421
Florida:
$3,082
(% of AGI for various income ranges: 0.1% for AGIs $10k-25k, 0.2% for AGIs $25k-50k, 0.2% for AGIs $50k-75k, 0.2% for AGIs over 100k)
Total itemized deductions: $14,839 (26% of AGI, reported on 21.7% of returns)
Here:
$14,839
State:
$20,370
Here:
25.5% of AGI
State:
20.7% of AGI
(% of AGI for various income ranges: 8.0% for AGIs below $10k, 6.4% for AGIs $10k-25k, 8.5% for AGIs $25k-50k, 10.4% for AGIs $50k-75k, 11.6% for AGIs $75k-100k, 11.9% for AGIs over 100k)
Charity contributions deductions: $3,148 (5% of AGI, reported on 17.4% of returns)
Here:
$3,148
State:
$4,064
Here:
5.1% of AGI
State:
3.8% of AGI
(% of AGI for various income ranges: 0.2% for AGIs below $10k, 0.8% for AGIs $10k-25k, 1.2% for AGIs $25k-50k, 1.9% for AGIs $50k-75k, 2.4% for AGIs $75k-100k, 2.4% for AGIs over 100k)
Total tax: $4,214 (reported on 72.3% of returns)
33637:
$4,214
State:
$9,431
(% of AGI for various income ranges: 2.3% for AGIs below $10k, 4.0% for AGIs $10k-25k, 6.9% for AGIs $25k-50k, 9.6% for AGIs $50k-75k, 11.3% for AGIs $75k-100k, 16.8% for AGIs over 100k)
Earned income credit: $1,767 (reported on 20.2% of returns)
Here:
$1,767
State:
$1,808
Percentage of individuals using paid preparers for their 2004 taxes: 47.4%
Here:
47%
State:
60%
(% for various income ranges: 44.1% for AGIs below $10k, 51.3% for AGIs $10k-25k, 44.6% for AGIs $25k-50k, 45.9% for AGIs $50k-75k, 50.3% for AGIs $75k-100k, 58.1% for AGIs over 100k)
Likely homosexual households (counted as self-reported same-sex unmarried-partner households)
Lesbian couples: 0.1% of all households
Gay men: 0.4% of all households
Household received Food Stamps/SNAP in the past 12 months: 1,138 Household did not receive Food Stamps/SNAP in the past 12 months: 6,851
Women who had a birth in the past 12 months: 26 (0 now married, 23 unmarried) Women who did not have a birth in the past 12 months: 4,740 (1,856 now married, 2,883 unmarried)
Housing units in zip code 33637 with a mortgage: 2,241 (66 second mortgage, 3 home equity loan, 55 both second mortgage and home equity loan) Houses without a mortgage: 78
Median monthly owner costs for units with a mortgage: $1,292 Median monthly owner costs for units without a mortgage: $556
Residents with income below the poverty level in 2022:
This zip code:
15.3%
Whole state:
12.7%
Residents with income below 50% of the poverty level in 2022:
This zip code:
8.4%
Whole state:
6.6%
Median number of rooms in houses and condos:
Here:
5.7
State:
5.9
Median number of rooms in apartments:
Here:
3.9
State:
4.2
Notable locations in this zip code not listed on our city pages
Notable locations in zip code 33637: Zammit Industrial Park (A), United States Highway 301 Industrial Park (B), Telecom Gardens Center (C), Tampa Telecom Park (D), Long Industrial Park (E), L A M Industrial Park (F), Hidden River Corporate Park (G), Temple Terrace Fire Department Station 2 (H). Display/hide their locations on the map
Churches in zip code 33637 include: Saint Marks Marthoma Church (A), Terrace Palms Community Church (B), Unitarian Universalist Church (C), Calvary Temple Church (D). Display/hide their locations on the map
1,967 married couples with children.
1,543 single-parent households (198 men, 1,345 women).
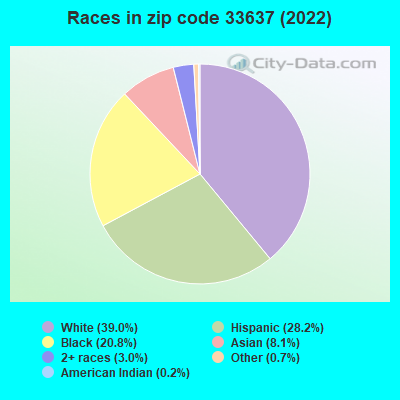
65.0% of residents of 33637 zip code speak English at home.
19.3% of residents speak Spanish at home (66% very well, 12% well, 12% not well, 10% not at all).
4.3% of residents speak other Indo-European language at home (71% very well, 18% well, 12% not well).
5.5% of residents speak Asian or Pacific Island language at home (49% very well, 23% well, 19% not well, 9% not at all).
5.9% of residents speak other language at home (61% very well, 18% well, 12% not well, 9% not at all).
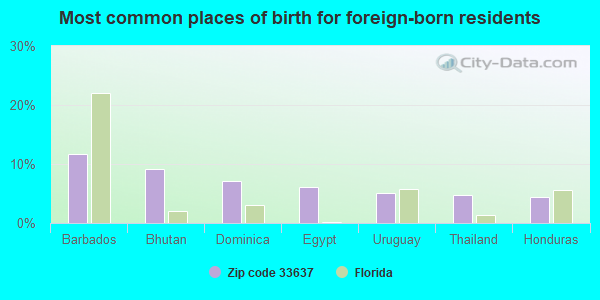
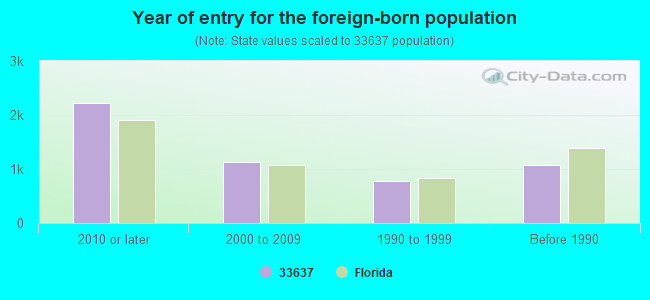
Foreign born population: 4,053 (22.5%) (52.3% of them are naturalized citizens)
Major facilities with environmental interests located in this zip code:
COWHOUSE GROVE (MORRIS BRIDGE RD in TAMPA, FL)
National Pollutant Discharge Elimination System NON-MAJOR (Tracking pollutant discharge elimination systems) - permit National Pollutant Discharge Elimination System NON-MAJOR (Tracking pollutant discharge elimination systems) - permit National Pollutant Discharge Elimination System NON-MAJOR (Tracking pollutant discharge elimination systems) - permit National Pollutant Discharge Elimination System NON-MAJOR (Tracking pollutant discharge elimination systems) - permit Alternative names: DEEB CONSTRUCTION & DEVELOPMNT, SKYLAND DEVELOPMENT INC, TRI FOLIATA DEVELOPMENT INC, TRI FOLIATA PROPERTY, TRIFOLIATA PROPERTY
JLM MARKETING INC (8675 HIDDEN RIVER PKWY in TAMPA, FL)
(Integrated Compliance Information System) - ICIS-04-2000-0230, FORMAL ENFORCEMENT ACTION COMPLIANCE ACTIVITY (Tracking inspections of insecticide, fungicide, and rodenticide, and toxic substances) Business SIC classification: GUM AND WOOD CHEMICALS; CYCLIC ORGANIC CRUDES AND INTERMEDIATES, AND ORGANIC DYES AND PIGMENTS; CHEMICALS AND ALLIED PRODUCTS
LESLIE CONTROLS INC. (12501 TELECOM DR in TAMPA, FL)
National Pollutant Discharge Elimination System NON-MAJOR (Tracking pollutant discharge elimination systems) - permit Small Quantity Generators, between 100 kg and 1000 kg of hazardous waste/month (Resource Conservation and Recovery Act (tracking hazardous waste)) - notification TRI REPORTER (Tracking of toxic chemicals releasing facilities) Business SIC classification: INDUSTRIAL VALVES Organizations: ROBERT GILSKI (CONTACT/OWNER)
, CHARLES WOLLEY, DIR (CONTACT/OWNER)
AAA COOPER TRANSPORTATION (8818 INDUSTRIAL DRIVE in TAMPA, FL)
National Pollutant Discharge Elimination System NON-MAJOR (Tracking pollutant discharge elimination systems) - permit Organizations: JAMES BARKLEY (CONTACT/OWNER)
AIR MINOR (AIRS/AFS) Small Quantity Generators, between 100 kg and 1000 kg of hazardous waste/month (Resource Conservation and Recovery Act (tracking hazardous waste)) - notification Business SIC classification: DRYCLEANING PLANTS, EXCEPT RUG CLEANING Organizations: HELEN GROVES, MGR (CONTACT/OWNER)
Alternative names: SHYROSE TENDER TOUCH CLEANERS, TENDER TOUCH CLEANERS
ARISTAR MGT INC (8900 GRAND OAK CIRCLE in TAMPA, FL)
(Resource Conservation and Recovery Act (tracking hazardous waste)) Organizations: BARBARA WARNER (CONTACT/OWNER)
ARISTAR MGT INC (3802 D SUGAR PALM DR in TAMPA, FL)
(Resource Conservation and Recovery Act (tracking hazardous waste)) Organizations: BARBARA WARNER (CONTACT/OWNER)
HIDDEN OAKS (13055 TERRACE SPRINGS DR in TEMPLE TERRACE, FL)
National Pollutant Discharge Elimination System NON-MAJOR (Tracking pollutant discharge elimination systems) - permit Organizations: THOMAS SPENCER (CONTACT/OWNER)
INDUSTRIAL STORAGE WAREHOUSE (7604 INDUSTRIAL LN in TAMPA, FL)
National Pollutant Discharge Elimination System NON-MAJOR (Tracking pollutant discharge elimination systems) - permit Organizations: DONALD PATTERSON (CONTACT/OWNER)
LANGSTON'S USED AUTO PARTS (8011 N HWY 301 in TAMPA, FL)
National Pollutant Discharge Elimination System NON-MAJOR (Tracking pollutant discharge elimination systems) - permit Organizations: DENNIS LANGSTON (CONTACT/OWNER)
PROPOSED BUILDING FOR ST. MARK (11029 DAVIS RD. in TAMPA, FL)
National Pollutant Discharge Elimination System NON-MAJOR (Tracking pollutant discharge elimination systems) - permit Organizations: MATHEW VERGHESE (CONTACT/OWNER)
RELIABLE COURIER SERVICE, INC. (7796 PROFESSIONAL PLACE in TAMPA, FL)
National Pollutant Discharge Elimination System NON-MAJOR (Tracking pollutant discharge elimination systems) - permit Organizations: DAVID MCGUOIRK (CONTACT/OWNER)
SAFE COMMUNICATIONS INC (7913 PROFESSIONAL PLACE in TAMPA, FL)
(Resource Conservation and Recovery Act (tracking hazardous waste)) Organizations: GEORGE TESTON (CONTACT/OWNER)
Housing units lacking complete plumbing facilities: 0.3% Housing units lacking complete kitchen facilities: 0.5%
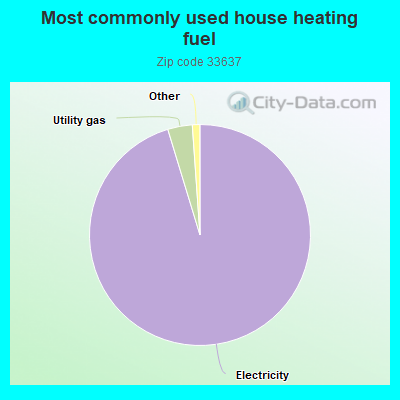
95.3%Electricity
3.6%Utility gas
Population in 1990: 9,673. Population change in the 1990s: +2,861 (+29.6%).
Place of birth for U.S.-born residents:
This state: 6,797
Northeast: 2,058
Midwest: 1,277
South: 2,178
West: 557
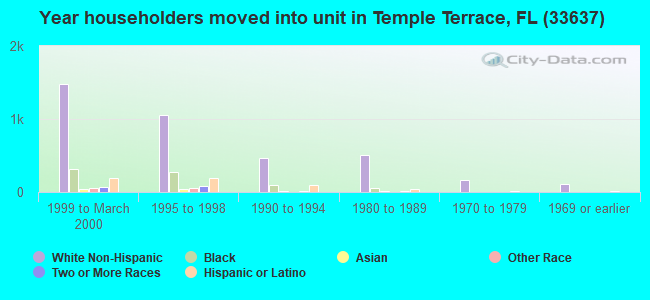
38% of the 33637 zip code residents lived in the same house 5 years ago. Out of people who lived in different houses, 61% lived in this county. Out of people who lived in different counties, 50% lived in Florida.
78% of the 33637 zip code residents lived in the same house 1 year ago. Out of people who lived in different houses, 37% moved from this county. Out of people who lived in different houses, 20% moved from different county within same state. Out of people who lived in different houses, 35% moved from different state. Out of people who lived in different houses, 8% moved from abroad.
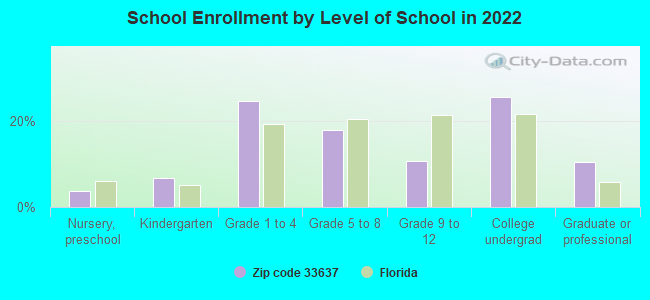
Private vs. public school enrollment:
Students in private schools in grades 1 to 8 (elementary and middle school): 496
Here:
24.4%
Florida:
15.8%
Students in private schools in grades 9 to 12 (high school): 91
Here:
17.9%
Florida:
12.9%
Students in private undergraduate colleges: 309
Here:
25.3%
Florida:
23.6%
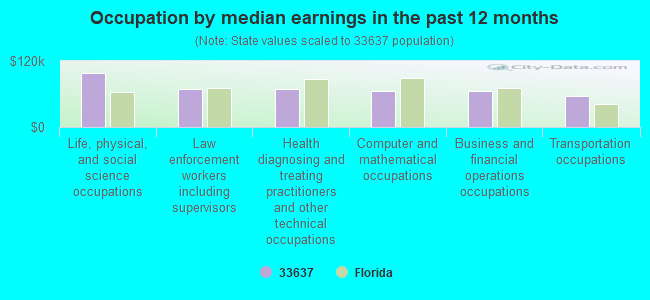
Occupation by median earnings in the past 12 months ($)
97,552Life, physical, and social science occupations
68,625Law enforcement workers including supervisors
68,482Health diagnosing and treating practitioners and other technical occupations
65,862Computer and mathematical occupations
65,209Business and financial operations occupations
57,144Transportation occupations
Companies with federal contracts located in this zip code (TAMPA, FL):
ACHIEVEGLOBAL INC (8875 HDDEN RVER PKWY FL 4) 425 employees, $14300000 revenue. : $34,126,571 in 213 contractsfrom 1999 to 2006
Contracts for Other Management Support Services, Educational Services, Other Education and Training Services, Other ADP and Telecommunications Services (includes data storage on tapes, compact disks, etc.), and moreby Navy, Air Force, Army, Federal Technology Service, and others Signed by year:2000: $7,552,725; 2001: $5,732,310; 2002: $3,018,199; 2003: $10,023,854; 2004: $3,522,362; 2005: $1,381,573; 2006: $2,352,458.
Biggest contracts:
$6,118,854 with Navy for Other Management Support Services. Taking place in VA. Signed on 2003-01-10. Completion date: 2001-09-30.
$2,150,000 with Navy for Other Management Support Services. Signed on 2000-01-11. Completion date: 2000-09-30.
$1,756,140 with Navy for Educational Services. Taking place in CA. Signed on 2006-02-27. Completion date: 2005-09-30.
$1,745,123, same as above.Signed on 2004-11-03. Completion date: 2005-09-30.
LESLIE CONTROLS INC (12501 TELECOM DR) : $17,150,876 in 608 contractsfrom 1999 to 2006
Contracts for Valves, Nonpowered, Hose, Pipe, Tube, Lubrication, and Railing Fittings, Valves, Powered, Power and Hand Pumps, and moreby Defense Logistics Agency, Navy, U.S. Coast Guard, Army, and others Signed by year:2000: $850,361; 2001: $747,226; 2002: $1,687,582; 2003: $6,446,607; 2004: $3,097,590; 2005: $2,929,020; 2006: $1,204,690.
Biggest contracts:
$5,320,848 with Defense Logistics Agency for Valves, Nonpowered. Signed on 2003-12-01. Completion date: 2004-07-13.
$357,978, same as above.Signed on 2004-06-07. Completion date: 2004-11-22.
$234,000 with Navy for Valves, Nonpowered. Signed on 2003-03-25. Completion date: 2003-10-30.
$207,124 with Defense Logistics Agency for Valves, Nonpowered. Signed on 2004-02-12. Completion date: 2004-07-23.
ICONIX INTERNATIONAL INCORPORA (12409 TELECOM DRIVE; small business) : $1,640,049 in 5 contractsfrom 2002 to 2003
Contracts for Miscellaneous Vessels by Navy Signed by year:2000: $0; 2001: $0; 2002: $1,537,378; 2003: $102,671; 2004: $0; 2005: $0; 2006: $0.
Biggest contracts:
$1,402,432 with Navy for Miscellaneous Vessels. Signed on 2002-09-27. Completion date: 2003-03-27.
$80,424, same as above.Signed on 2002-12-16. Completion date: 2003-03-27.
$67,807, same as above.Signed on 2003-09-11. Completion date: 2003-03-27.
$54,522, same as above.Signed on 2002-12-05. Completion date: 2003-03-27.
BUILDING INDUSTRY CONSULTING S (8610 HIDDEN RIVER PKWY) : $963,849 in 26 contractsfrom 2001 to 2006
Contracts for ADP Software, Equipment, and Telecommunications Training, Education Services, Communications Services, Other Education and Training Services, and moreby Army, Navy, Federal Technology Service, Air Force, and others Signed by year:2000: $0; 2001: $125,533; 2002: $193,712; 2003: $221,157; 2004: $194,540; 2005: $195,577; 2006: $33,330.
Biggest contracts:
$188,360 with Army for ADP Software, Equipment, and Telecommunications Training. Taking place in MD. Signed on 2004-06-08. Completion date: 2004-08-28.
$187,442 with Navy for ADP Software, Equipment, and Telecommunications Training. Signed on 2002-07-25. Completion date: 2002-09-30.
$154,825 with Army for ADP Software, Equipment, and Telecommunications Training. Signed on 2003-09-26. Completion date: 2004-10-31.
$115,920 with Army for Education Services. Taking place in LA. Signed on 2005-06-23. Completion date: 2005-07-15.
BLASTERS INC (7813 PROFESSIONAL PL; small business) : $169,558 in 4 contractsfrom 2004 to 2005
$72,500 with Navy for Miscellaneous Maintenance and Repair Shop Specialized Equipment. Signed on 2004-04-06. Completion date: 2004-08-10.
$51,558, same as above.Signed on 2004-05-12. Completion date: 2004-05-25.
$22,850 with Navy for Abrasive Materials. Signed on 2005-03-09. Completion date: 2005-04-08.
$22,650 with Navy for Miscellaneous Maintenance and Repair Shop Specialized Equipment. Signed on 2004-03-30. Completion date: 2004-04-19.
KULWICKI AIR, INC (7610H INDUSTRIAL LN; small business)
$11,700 with Air Force for Maintenance, Repair and Rebuilding of Equipment -- Plumbing, Heating, and Waste Disposal Equipment. Signed on 2005-10-01. Completion date: 2006-09-30.
MASTER COLLISON REPAIR INC (9816 HIGHWAY 301 N; small business) : $1,741 in 3 contractsin 2005
$4,856 with Air Force for Miscellaneous Items. Signed on 2005-09-30. Completion date: 2005-10-31.
$3,443 with Air Force for Maintenance, Repair and Rebuilding of Equipment -- Construction and Building Materials. Signed on 2005-01-31. Completion date: 2005-02-19.
-$6,558 with Air Force for Miscellaneous Service and Trade Equipment. Signed on 2005-08-10. Completion date: 2003-09-13.
Top industries in this zip code by the number of employees in 2005:
2002 - 2018 National Fire Incident Reporting System (NFIRS) incidents
Based on the data from the years 2002 - 2018 the average number of fires per year is 22. The highest number of reported fire incidents - 33 took place in 2007, and the least - 9 in 2017. The data has a declining trend.
When looking into fire subcategories, the most reports belonged to: Structure Fires (53.4%), and Mobile Property/Vehicle Fires (23.5%).
Fire incident types reported to NFIRS in Zip Code 33637
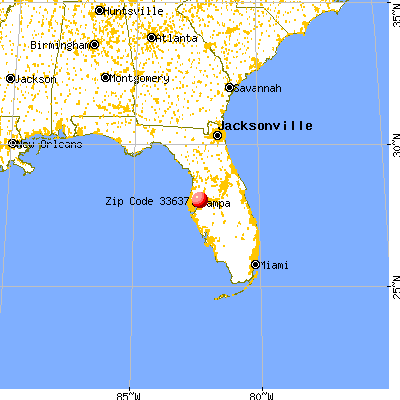


 Nearest zip codes: 33617, 33610, 33620, 33612, 33584, 33647.
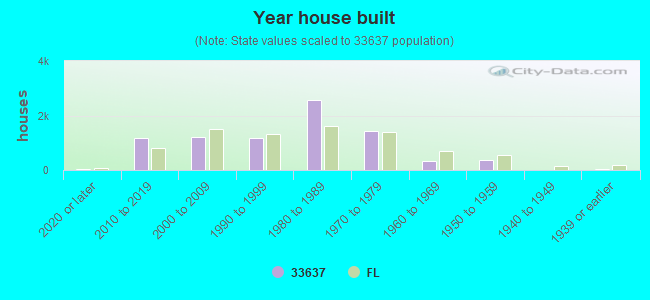


 Based on the data from the years 2002 - 2018 the average number of fires per year is 22. The highest number of reported fire incidents - 33 took place in 2007, and the least - 9 in 2017. The data has a declining trend.
 When looking into fire subcategories, the most reports belonged to: Structure Fires (53.4%), and Mobile Property/Vehicle Fires (23.5%).