Estimated zip code population in 2022: 28,648 Zip code population in 2010: 25,392 Zip code population in 2000: 20,490
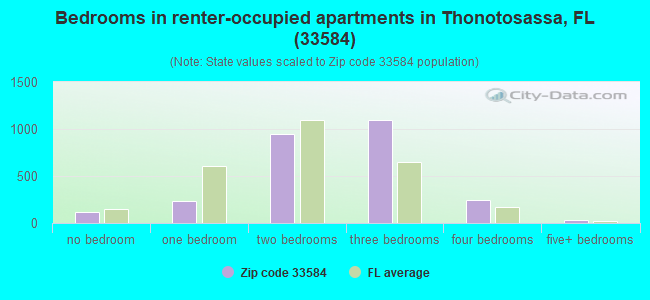
Houses and condos: 11,035 Renter-occupied apartments: 2,709
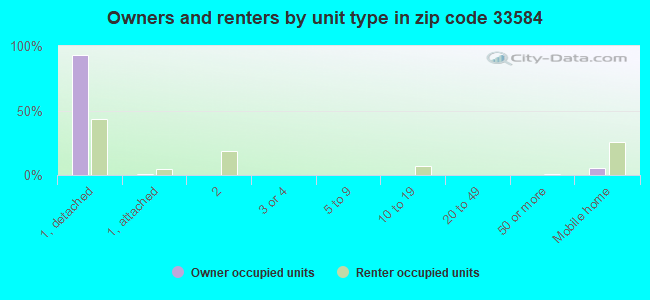
% of renters here:
26%
State:
33%
March 2022 cost of living index in zip code 33584: 98.2 (near average, U.S. average is 100)
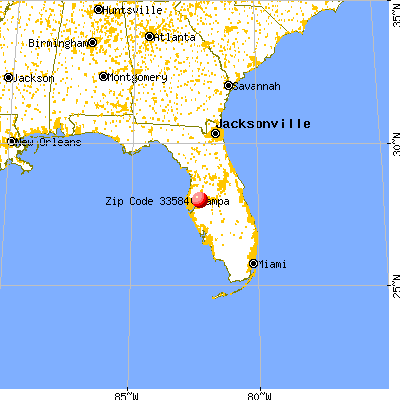
Land area: 21.4 sq. mi. Water area: 0.8 sq. mi.
Population density: 1,339 people per square mile
(low).
OSM Map
General Map
Google Map
MSN Map
OSM Map
General Map
Google Map
MSN Map
OSM Map
General Map
Google Map
MSN Map
OSM Map
General Map
Google Map
MSN Map
Please wait while loading the map...
Real estate property taxes paid for housing units in 2022:
This zip code:
0.7% ($2,078)
Florida:
0.7% ($2,529)
Median real estate property taxes paid for housing units with mortgages in 2022: $2,207 (0.7%) Median real estate property taxes paid for housing units with no mortgage in 2022: $1,812 (0.6%)
Averages for the 2020 tax year for zip code 33584, filed in 2021:
Average Adjusted Gross Income (AGI) in 2020: $53,188 (Individual Income Tax Returns)
Here:
$53,188
State:
$82,200
Salary/wage: $48,295 (reported on 84.3% of returns)
Here:
$48,295
State:
$58,347
(% of AGI for various income ranges: 1207.2% for AGIs below $25k, 3730.7% for AGIs $25k-50k, 6602.1% for AGIs $50k-75k, 9382.3% for AGIs $75k-100k, 17447.2% for AGIs $100k-200k, 69120.0% for AGIs over 200k)
Taxable interest for individuals: $1,083 (reported on 18.5% of returns)
This zip code:
$1,083
Florida:
$4,272
(% of AGI for various income ranges: 6.2% for AGIs below $25k, 10.3% for AGIs $25k-50k, 17.4% for AGIs $50k-75k, 39.5% for AGIs $75k-100k, 78.4% for AGIs $100k-200k, 973.3% for AGIs over 200k)
Ordinary dividends: $3,202 (reported on 10.5% of returns)
Here:
$3,202
State:
$15,863
(% of AGI for various income ranges: 8.0% for AGIs below $25k, 19.9% for AGIs $25k-50k, 38.9% for AGIs $50k-75k, 48.0% for AGIs $75k-100k, 141.5% for AGIs $100k-200k, 1564.4% for AGIs over 200k)
Net capital gain/loss in AGI: +$12,409 (reported on 9.5% of returns)
Here:
+$12,409
State:
+$62,983
(% of AGI for various income ranges: 1.2% for AGIs below $25k, 22.0% for AGIs $25k-50k, 37.2% for AGIs $50k-75k, 53.6% for AGIs $75k-100k, 432.8% for AGIs $100k-200k, 11533.3% for AGIs over 200k)
Profit/loss from business: +$6,437 (reported on 18.1% of returns)
Here:
+$6,437
State:
+$9,719
(% of AGI for various income ranges: 124.7% for AGIs below $25k, 82.9% for AGIs $25k-50k, 76.9% for AGIs $50k-75k, 182.2% for AGIs $75k-100k, 299.0% for AGIs $100k-200k, 3244.4% for AGIs over 200k)
Taxable individual retirement arrangement distribution: $16,427 (reported on 5.8% of returns)
33584:
$16,427
Florida:
$24,823
(% of AGI for various income ranges: 28.7% for AGIs below $25k, 48.7% for AGIs $25k-50k, 136.2% for AGIs $50k-75k, 260.7% for AGIs $75k-100k, 511.4% for AGIs $100k-200k, 1885.6% for AGIs over 200k)
Total itemized deductions: $34,189 (reported on 5.4% of returns)
Here:
$34,189
State:
$45,393
(% of AGI for various income ranges: 22.5% for AGIs below $25k, 97.6% for AGIs $25k-50k, 206.2% for AGIs $50k-75k, 367.7% for AGIs $75k-100k, 890.5% for AGIs $100k-200k, 8023.3% for AGIs over 200k)
Charity contributions: $12,656 (reported on 4.4% of returns)
Here:
$12,656
State:
$20,178
(% of AGI for various income ranges: 1.9% for AGIs below $25k, 13.5% for AGIs $25k-50k, 43.1% for AGIs $50k-75k, 92.5% for AGIs $75k-100k, 285.2% for AGIs $100k-200k, 3424.4% for AGIs over 200k)
Taxes paid: $5,825 (reported on 5.1% of returns)
33584:
$5,825
State:
$6,967
(% of AGI for various income ranges: 2.8% for AGIs below $25k, 14.7% for AGIs $25k-50k, 38.0% for AGIs $50k-75k, 68.0% for AGIs $75k-100k, 165.0% for AGIs $100k-200k, 993.3% for AGIs over 200k)
Earned income credit: $2,449 (reported on 24.2% of returns)
Here:
$2,449
State:
$2,306
(% of AGI for various income ranges: 135.0% for AGIs below $25k, 82.0% for AGIs $25k-50k, 0.9% for AGIs $50k-75k)
Percentage of individuals using paid preparers for their 2020 taxes: 92.8%
Here:
93%
State:
92%
(% for various income ranges: 91.9% for AGIs below $25k, 93.7% for AGIs $25k-50k, 93.3% for AGIs $50k-75k, 93.6% for AGIs $75k-100k, 91.9% for AGIs $100k-200k, 93.8% for AGIs over 200k)
Averages for the 2012 tax year for zip code 33584, filed in 2013:
Average Adjusted Gross Income (AGI) in 2012: $44,214 (Individual Income Tax Returns)
Here:
$44,214
State:
$60,316
Salary/wage: $41,295 (reported on 83.9% of returns)
Here:
$41,295
State:
$45,277
(% of AGI for various income ranges: 72.1% for AGIs below $25k, 83.9% for AGIs $25k-50k, 80.0% for AGIs $50k-75k, 82.7% for AGIs $75k-100k, 79.9% for AGIs $100k-200k, 59.1% for AGIs over 200k)
Taxable interest for individuals: $1,249 (reported on 22.2% of returns)
This zip code:
$1,249
Florida:
$3,587
(% of AGI for various income ranges: 0.9% for AGIs below $25k, 0.7% for AGIs $25k-50k, 0.9% for AGIs $50k-75k, 0.4% for AGIs $75k-100k, 0.4% for AGIs $100k-200k, 0.5% for AGIs over 200k)
Ordinary dividends: $7,122 (reported on 13.4% of returns)
Here:
$7,122
State:
$12,831
(% of AGI for various income ranges: 7.0% for AGIs below $25k, 2.1% for AGIs $25k-50k, 1.8% for AGIs $50k-75k, 0.5% for AGIs $75k-100k, 1.0% for AGIs $100k-200k, 1.9% for AGIs over 200k)
Net capital gain/loss in AGI: +$4,219 (reported on 7.9% of returns)
Here:
+$4,219
State:
+$33,493
(% of AGI for various income ranges: 0.6% for AGIs below $25k, 0.3% for AGIs $25k-50k, 0.7% for AGIs $50k-75k, 0.3% for AGIs $75k-100k, 0.4% for AGIs $100k-200k, 4.2% for AGIs over 200k)
Profit/loss from business: +$7,658 (reported on 13.5% of returns)
Here:
+$7,658
State:
+$10,012
(% of AGI for various income ranges: 7.9% for AGIs below $25k, 1.7% for AGIs $25k-50k, 1.4% for AGIs $50k-75k, 1.2% for AGIs $75k-100k, 2.3% for AGIs $100k-200k)
Taxable individual retirement arrangement distribution: $13,243 (reported on 6.3% of returns)
33584:
$13,243
Florida:
$21,544
(% of AGI for various income ranges: 1.8% for AGIs below $25k, 1.3% for AGIs $25k-50k, 1.7% for AGIs $50k-75k, 2.7% for AGIs $75k-100k, 2.8% for AGIs $100k-200k)
Total itemized deductions: $18,717 (22% of AGI, reported on 21.1% of returns)
Here:
$18,717
State:
$25,533
Here:
22.2% of AGI
State:
18.0% of AGI
(% of AGI for various income ranges: 5.6% for AGIs below $25k, 7.6% for AGIs $25k-50k, 9.2% for AGIs $50k-75k, 11.2% for AGIs $75k-100k, 10.7% for AGIs $100k-200k, 8.5% for AGIs over 200k)
Charity contributions: $4,146 (reported on 16.2% of returns)
Here:
$4,146
State:
$5,698
(% of AGI for various income ranges: 0.5% for AGIs below $25k, 0.9% for AGIs $25k-50k, 1.3% for AGIs $50k-75k, 2.1% for AGIs $75k-100k, 2.4% for AGIs $100k-200k, 1.9% for AGIs over 200k)
Taxes paid: $3,383 (reported on 20.5% of returns)
33584:
$3,383
State:
$6,203
(% of AGI for various income ranges: 0.8% for AGIs below $25k, 1.1% for AGIs $25k-50k, 1.5% for AGIs $50k-75k, 1.9% for AGIs $75k-100k, 2.1% for AGIs $100k-200k, 2.2% for AGIs over 200k)
Earned income credit: $2,428 (reported on 24.5% of returns)
Here:
$2,428
State:
$2,372
(% of AGI for various income ranges: 8.1% for AGIs below $25k, 1.4% for AGIs $25k-50k)
Percentage of individuals using paid preparers for their 2012 taxes: 41.9%
Here:
42%
State:
54%
(% for various income ranges: 42.0% for AGIs below $25k, 38.3% for AGIs $25k-50k, 41.8% for AGIs $50k-75k, 44.9% for AGIs $75k-100k, 47.7% for AGIs $100k-200k, 66.7% for AGIs over 200k)
Averages for the 2004 tax year for zip code 33584, filed in 2005:
Average Adjusted Gross Income (AGI) in 2004: $39,908 (Individual Income Tax Returns)
Here:
$39,908
State:
$50,523
Salary/wage: $37,274 (reported on 90.3% of returns)
Here:
$37,274
State:
$39,563
(% of AGI for various income ranges: 92.9% for AGIs below $10k, 83.2% for AGIs $10k-25k, 88.3% for AGIs $25k-50k, 87.8% for AGIs $50k-75k, 87.5% for AGIs $75k-100k, 73.2% for AGIs over 100k)
Taxable interest for individuals: $800 (reported on 35.3% of returns)
This zip code:
$800
Florida:
$3,211
(% of AGI for various income ranges: 2.1% for AGIs below $10k, 1.1% for AGIs $10k-25k, 0.7% for AGIs $25k-50k, 0.4% for AGIs $50k-75k, 0.5% for AGIs $75k-100k, 0.8% for AGIs over 100k)
Taxable dividends: $1,169 (reported on 13.7% of returns)
Here:
$1,169
State:
$6,129
(% of AGI for various income ranges: 0.9% for AGIs below $10k, 0.7% for AGIs $10k-25k, 0.3% for AGIs $25k-50k, 0.3% for AGIs $50k-75k, 0.3% for AGIs $75k-100k, 0.5% for AGIs over 100k)
Net capital gain/loss: +$5,982 (reported on 9.8% of returns)
Here:
+$5,982
State:
+$27,205
(% of AGI for various income ranges: -1.1% for AGIs below $10k, 0.3% for AGIs $10k-25k, 0.3% for AGIs $25k-50k, 0.5% for AGIs $50k-75k, 0.9% for AGIs $75k-100k, 5.2% for AGIs over 100k)
Profit/loss from business: +$6,695 (reported on 12.6% of returns)
Here:
+$6,695
State:
+$10,634
(% of AGI for various income ranges: 6.2% for AGIs below $10k, 5.0% for AGIs $10k-25k, 1.6% for AGIs $25k-50k, 1.9% for AGIs $50k-75k, 0.7% for AGIs $75k-100k, 2.2% for AGIs over 100k)
IRA payment deduction: $2,691 (reported on 2.4% of returns)
33584:
$2,691
Florida:
$3,082
(% of AGI for various income ranges: 0.2% for AGIs $10k-25k, 0.2% for AGIs $25k-50k, 0.1% for AGIs $50k-75k, 0.1% for AGIs $75k-100k, 0.2% for AGIs over 100k)
Self-employed pension: $7,875 (reported on 0.2% of returns)
Here:
$7,875
Florida:
$15,857
Total itemized deductions: $15,240 (23% of AGI, reported on 29.8% of returns)
Here:
$15,240
State:
$20,370
Here:
23.1% of AGI
State:
20.7% of AGI
(% of AGI for various income ranges: 8.5% for AGIs below $10k, 8.1% for AGIs $10k-25k, 11.4% for AGIs $25k-50k, 12.7% for AGIs $50k-75k, 12.4% for AGIs $75k-100k, 11.0% for AGIs over 100k)
Charity contributions deductions: $2,869 (4% of AGI, reported on 23.9% of returns)
Here:
$2,869
State:
$4,064
Here:
4.1% of AGI
State:
3.8% of AGI
(% of AGI for various income ranges: 0.5% for AGIs below $10k, 0.8% for AGIs $10k-25k, 1.3% for AGIs $25k-50k, 1.8% for AGIs $50k-75k, 2.2% for AGIs $75k-100k, 2.3% for AGIs over 100k)
Total tax: $5,059 (reported on 74.3% of returns)
33584:
$5,059
State:
$9,431
(% of AGI for various income ranges: 2.6% for AGIs below $10k, 4.0% for AGIs $10k-25k, 6.5% for AGIs $25k-50k, 8.5% for AGIs $50k-75k, 10.2% for AGIs $75k-100k, 16.8% for AGIs over 100k)
Earned income credit: $1,722 (reported on 18.7% of returns)
Here:
$1,722
State:
$1,808
Percentage of individuals using paid preparers for their 2004 taxes: 51.6%
Here:
52%
State:
60%
(% for various income ranges: 44.1% for AGIs below $10k, 56.1% for AGIs $10k-25k, 52.5% for AGIs $25k-50k, 50.5% for AGIs $50k-75k, 48.3% for AGIs $75k-100k, 58.6% for AGIs over 100k)
Likely homosexual households (counted as self-reported same-sex unmarried-partner households)
Lesbian couples: 0.0% of all households
Gay men: 0.0% of all households
Household received Food Stamps/SNAP in the past 12 months: 1,627 Household did not receive Food Stamps/SNAP in the past 12 months: 8,900
Women who had a birth in the past 12 months: 399 (263 now married, 136 unmarried) Women who did not have a birth in the past 12 months: 6,014 (2,772 now married, 3,243 unmarried)
Housing units in zip code 33584 with a mortgage: 4,798 (237 second mortgage, 170 both second mortgage and home equity loan) Houses without a mortgage: 36
Median monthly owner costs for units with a mortgage: $1,546 Median monthly owner costs for units without a mortgage: $452
Residents with income below the poverty level in 2022:
This zip code:
16.5%
Whole state:
12.7%
Residents with income below 50% of the poverty level in 2022:
This zip code:
9.1%
Whole state:
6.6%
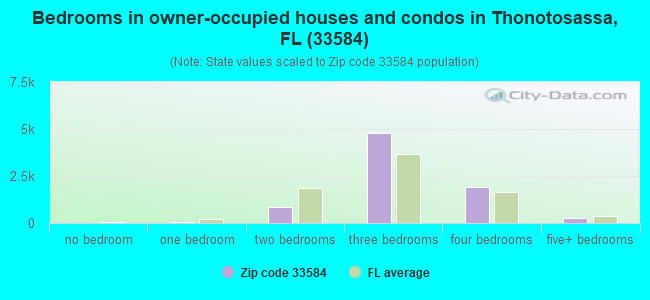
Median number of rooms in houses and condos:
Here:
6.2
State:
5.9
Median number of rooms in apartments:
Here:
5.1
State:
4.2
Notable locations in this zip code not listed on our city pages
Notable locations in zip code 33584: Tampa Gateway Park (A), Parsons Village Square (B), Seffner Mango Volunteer Engine 18 (C), Hillsborough County Fire Rescue Station 4 Armwood (D), Americare Ambulance Service (E), Hillsborough County Sheriff's Office Community Substation Seffner (F), Sefner Mango Branch Library (G). Display/hide their locations on the map
Churches in zip code 33584 include: Bethel Church (A), Oak Grove Church (B), Sanders Chapel (C), Mission Church (D), Iglesia Cristiana la Nueva Jerusalem (E), Life Fellowship Church (F), Faith City Church (G), First Assembly of God Church of Seffner (H), Oak Grove Church of God (I). Display/hide their locations on the map
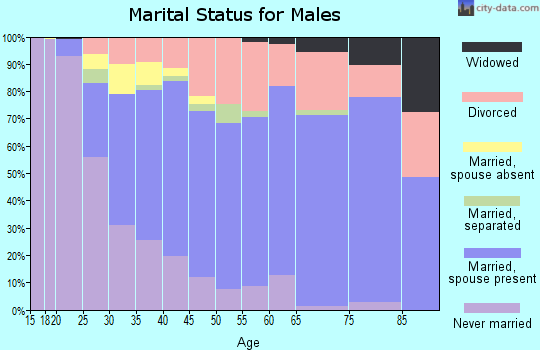
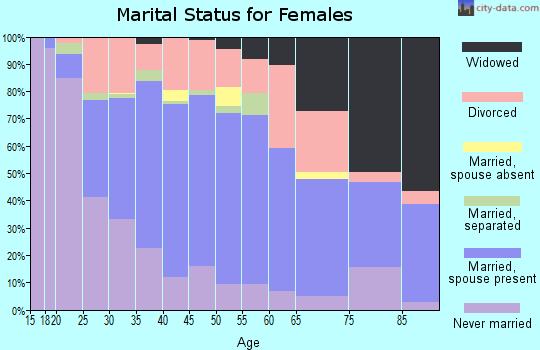
3,814 married couples with children.
1,709 single-parent households (610 men, 1,099 women).
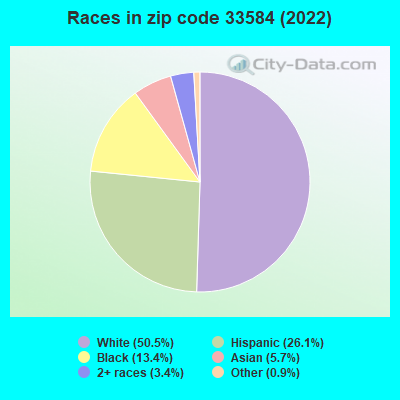
72.1% of residents of 33584 zip code speak English at home.
18.7% of residents speak Spanish at home (68% very well, 13% well, 11% not well, 8% not at all).
6.0% of residents speak other Indo-European language at home (66% very well, 8% well, 15% not well, 11% not at all).
1.3% of residents speak Asian or Pacific Island language at home (63% very well, 26% well, 3% not well, 8% not at all).
1.4% of residents speak other language at home (85% very well, 9% well, 6% not well).
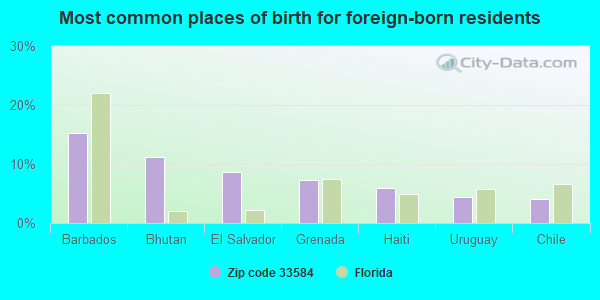
Foreign born population: 3,632 (12.7%) (65.5% of them are naturalized citizens)
This zip code:
12.7%
Whole state:
21.7%
15%Barbados
11%Bhutan
9%El Salvador
7%Grenada
6%Haiti
4%Uruguay
4%Chile
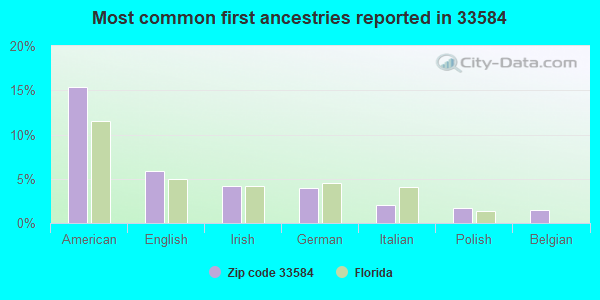
15%American
6%English
4%Irish
4%German
2%Italian
2%Polish
1%Belgian
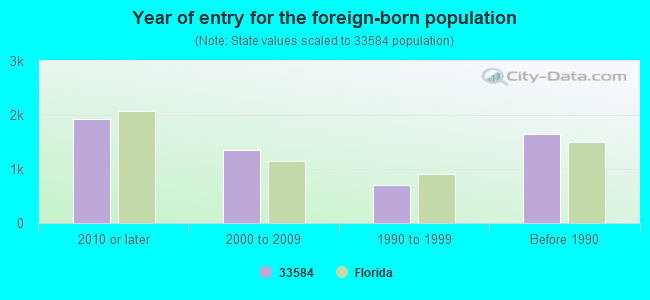
Year of entry for the foreign-born population
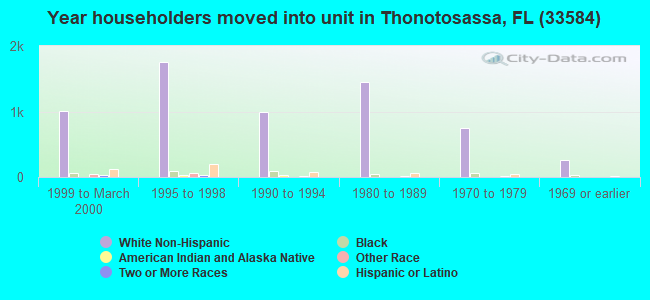
1,9242010 or later
1,3512000 to 2009
7111990 to 1999
1,639Before 1990
Major facilities with environmental interests located in this zip code:
PRECISION COLLISION & AUTO PAINTING (11719 US HWY 92 E in SEFFNER, FL)
STATE MASTER (FDM) - CHAZ-FLD984219345, HAZARDOUS WASTE REGULATION PROGRAM (Resource Conservation and Recovery Act (tracking hazardous waste)) Business SIC classification: TOP, BODY, AND UPHOLSTERY REPAIR SHOPS AND PAINT SHOPS Business NAICS classification: AUTOMOTIVE BODY, PAINT, AND INTERIOR REPAIR AND MAINTENANCE. Organizations: AURELIO MARTINEZ (CONTACT/OWNER)
Alternative names: SEFFNER AUTOMOTIVE
ARMWOOD HIGH SCHOOL (1200 US HIGHWAY 92 EAST in SEFFNER, FL)
(Geographic Names Information System) (National Center for Education Statistics) - STATE ID-0131 Small Quantity Generators, between 100 kg and 1000 kg of hazardous waste/month (Resource Conservation and Recovery Act (tracking hazardous waste)) - notification Organizations: LUCIEN SHELTON, ENV TECH (CONTACT/OWNER)
, HILLSBOROUGH COUNTY SCHOOL DISTRICT (SCHOOL DISTRICT)
Alternative names: HILLSBOROUGH CO ARMWOOD HIGH SCHOOL
LOPEZ ELEMENTARY SCHOOL (200 N KINGSWAY RD in SEFFNER, FL)
(Geographic Names Information System) (National Center for Education Statistics) - STATE ID-2531 Organizations: HILLSBOROUGH COUNTY SCHOOL DISTRICT (SCHOOL DISTRICT)
SEFFNER ELEMENTARY SCHOOL (109 CACTUS RD in SEFFNER, FL)
(Geographic Names Information System) (National Center for Education Statistics) - STATE ID-3881 Organizations: HILLSBOROUGH COUNTY SCHOOL DISTRICT (SCHOOL DISTRICT)
MANGO ELEMENTARY SCHOOL (4220 HWY 579 in SEFFNER, FL)
(Geographic Names Information System) (National Center for Education Statistics) - STATE ID-2721 Organizations: HILLSBOROUGH COUNTY SCHOOL DISTRICT (SCHOOL DISTRICT)
COLSON ELEMENTARY SCHOOL (1520 LAKEVIEW AVE in SEFFNER, FL)
(National Center for Education Statistics) - STATE ID-0931 Organizations: HILLSBOROUGH COUNTY SCHOOL DISTRICT (SCHOOL DISTRICT)
GORDON BURNETT MIDDLE SCHOOL (1010 NORTH KINGSWAY ROAD in SEFFNER, FL)
(National Center for Education Statistics) - STATE ID-0631 Organizations: HILLSBOROUGH COUNTY SCHOOL DISTRICT (SCHOOL DISTRICT)
HILLSBOROUGH GROUP TREATMENT HOME #1 (6612 STARK ROAD in SEFFNER, FL)
(National Center for Education Statistics) - STATE ID-5045 Organizations: HILLSBOROUGH COUNTY SCHOOL DISTRICT (SCHOOL DISTRICT)
HILLSBOROUGH GROUP TREATMENT HOME #2 (6612 STARK ROAD in SEFFNER, FL)
(National Center for Education Statistics) - STATE ID-5050 Organizations: HILLSBOROUGH COUNTY SCHOOL DISTRICT (SCHOOL DISTRICT)
MCDONALD ELEMENTARY SCHOOL (501 W PRUITT RD in SEFFNER, FL)
(National Center for Education Statistics) - STATE ID-2871 Organizations: HILLSBOROUGH COUNTY SCHOOL DISTRICT (SCHOOL DISTRICT)
SUPERFUND (Superfund database) - ICIS-04-2005-3780, ENFORCEMENT/COMPLIANCE ACTIVITY Alternative names: LEWIS FERTIC DISPOSAL SITE
MIRROR LAKE TOWNHOMES (MLK BLVD AT HIGHVIEW RD in SEFFNER, FL)
National Pollutant Discharge Elimination System NON-MAJOR (Tracking pollutant discharge elimination systems) - permit Organizations: RICH LEATHAM (CONTACT/OWNER)
SAGAMORE TRACE (WEST SIDE OF SOUTH KINGSWAY RD in SEFFNER, FL)
National Pollutant Discharge Elimination System NON-MAJOR (Tracking pollutant discharge elimination systems) - permit Organizations: LAURIE BURCAW (CONTACT/OWNER)
Housing units lacking complete plumbing facilities: 1.3% Housing units lacking complete kitchen facilities: 1.3%
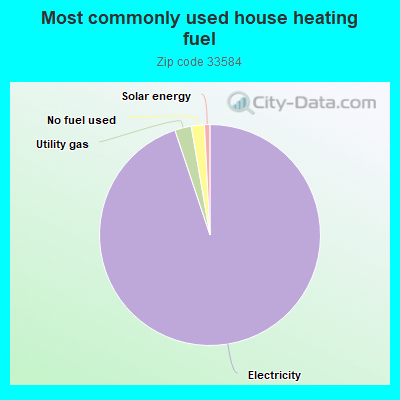
94.2%Electricity
2.4%Utility gas
1.9%No fuel used
0.8%Solar energy
Population in 1990: 20,956.
Place of birth for U.S.-born residents:
This state: 12,253
Northeast: 3,872
Midwest: 3,203
South: 2,383
West: 1,199
55% of the 33584 zip code residents lived in the same house 5 years ago. Out of people who lived in different houses, 70% lived in this county. Out of people who lived in different counties, 50% lived in Florida.
89% of the 33584 zip code residents lived in the same house 1 year ago. Out of people who lived in different houses, 57% moved from this county. Out of people who lived in different houses, 13% moved from different county within same state. Out of people who lived in different houses, 13% moved from different state. Out of people who lived in different houses, 15% moved from abroad.
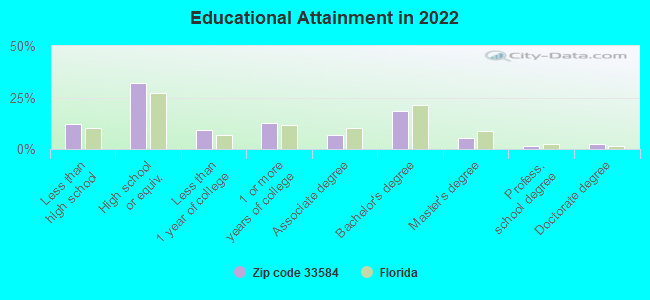
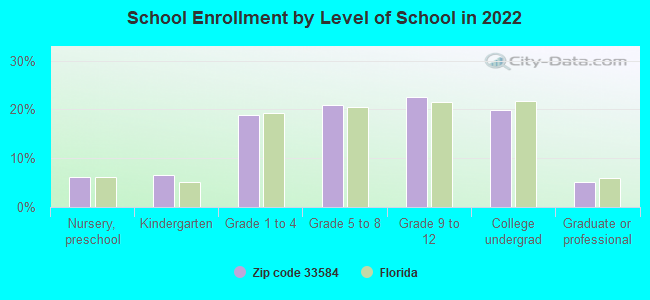
Private vs. public school enrollment:
Students in private schools in grades 1 to 8 (elementary and middle school): 353
Here:
14.9%
Florida:
15.8%
Students in private schools in grades 9 to 12 (high school): 348
Here:
25.6%
Florida:
12.9%
Students in private undergraduate colleges: 292
Here:
24.6%
Florida:
23.6%
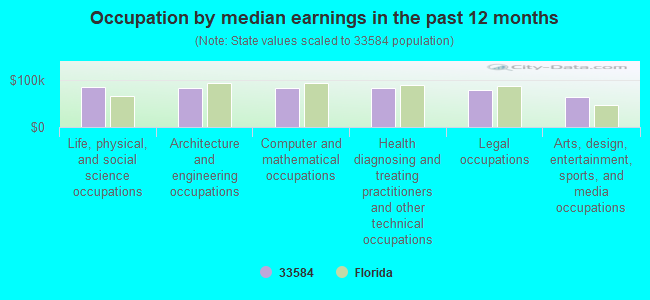
Occupation by median earnings in the past 12 months ($)
84,845Life, physical, and social science occupations
83,842Architecture and engineering occupations
83,562Computer and mathematical occupations
82,502Health diagnosing and treating practitioners and other technical occupations
79,555Legal occupations
63,554Arts, design, entertainment, sports, and media occupations
Companies with federal contracts located in this zip code:
TAMPA BAY WHOLESALE FOLIAGE (9107 TAYLOR ROAD in SEFFNER, FL; small business) : $2,102,163 in 18 contractsfrom 2003 to 2006
Contracts for Non-Food Items For Resale by Defense Commissary Agency Signed by year:2000: $0; 2001: $0; 2002: $0; 2003: $52,627; 2004: $677,738; 2005: $961,017; 2006: $410,781.
Biggest contracts:
$431,050 with Defense Commissary Agency for Non-Food Items For Resale. Signed on 2004-10-01. Completion date: 2005-03-31.
$315,843, same as above.Signed on 2006-01-01. Completion date: 2006-03-31.
$246,688, same as above.Signed on 2004-10-01. Completion date: 2005-03-31.
$229,951, same as above.Signed on 2005-04-01. Completion date: 2005-06-30.
R T G FURNITURE CORPORATION (11540 E US HWY 92 in SEFFNER, FL)
$9,997 with Air Force for Household Furnishings. Signed on 2006-05-18. Completion date: 2006-06-01.
Top industries in this zip code by the number of employees in 2005:
Management of Companies and Enterprises: Corporate, Subsidiary, and Regional Managing Offices (500-999 employees: 1 establishment, 50-99 employees: 1 establishment)
Administrative and Support and Waste Management and Remediation Services: Temporary Help Services (250-499: 1, 50-99: 1)
2010 - 2018 National Fire Incident Reporting System (NFIRS) incidents
Based on the data from the years 2010 - 2018 the average number of fires per year is 59. The highest number of fires - 101 took place in 2010, and the least - 0 in 2016. The data has a decreasing trend.
When looking into fire subcategories, the most incidents belonged to: Outside Fires (36.7%), and Structure Fires (35.2%).
Fire incident types reported to NFIRS in Zip Code 33584


 Nearest zip codes: 33510, 33594, 33527, 33637, 33610, 33592.
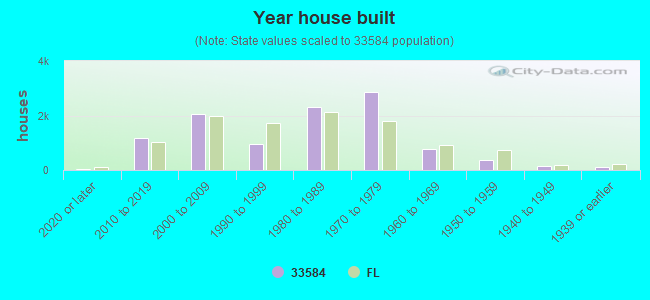


 Based on the data from the years 2010 - 2018 the average number of fires per year is 59. The highest number of fires - 101 took place in 2010, and the least - 0 in 2016. The data has a decreasing trend.
 When looking into fire subcategories, the most incidents belonged to: Outside Fires (36.7%), and Structure Fires (35.2%).