Estimated zip code population in 2022: 25,765 Zip code population in 2010: 24,599 Zip code population in 2000: 26,542
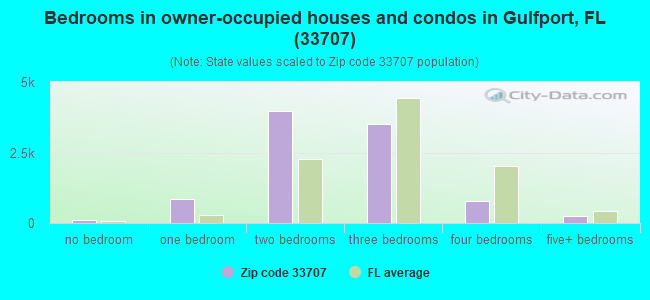
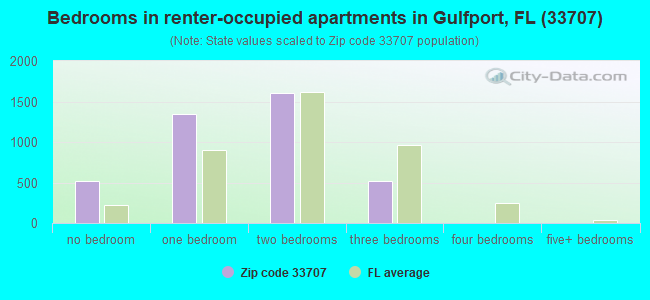
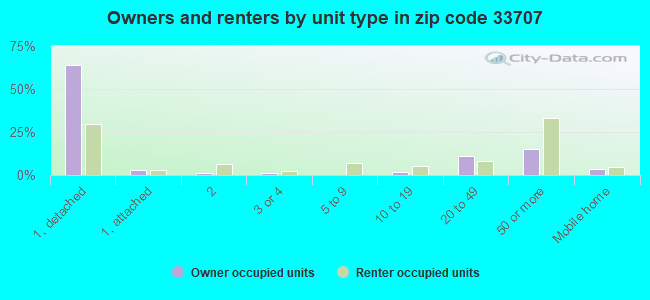
Houses and condos: 17,390 Renter-occupied apartments: 3,938
% of renters here:
29%
State:
33%
March 2022 cost of living index in zip code 33707: 99.7 (near average, U.S. average is 100)
Land area: 5.3 sq. mi. Water area: 2.2 sq. mi.
Population density: 4,892 people per square mile
(average).
OSM Map
General Map
Google Map
MSN Map
OSM Map
General Map
Google Map
MSN Map
OSM Map
General Map
Google Map
MSN Map
OSM Map
General Map
Google Map
MSN Map
Please wait while loading the map...
Real estate property taxes paid for housing units in 2022:
This zip code:
0.6% ($2,353)
Florida:
0.7% ($2,529)
Median real estate property taxes paid for housing units with mortgages in 2022: $2,431 (0.6%) Median real estate property taxes paid for housing units with no mortgage in 2022: $2,273 (0.6%)
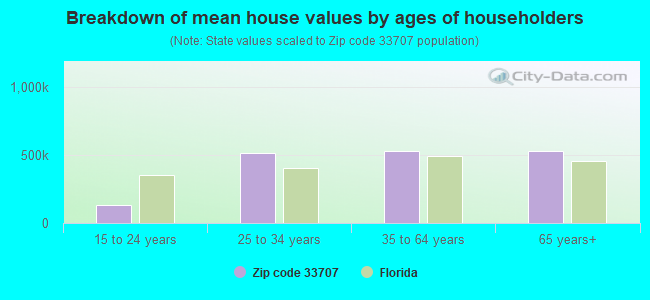
Estimated median house/condo value in 2022: $369,975
33707:
$369,975
Florida:
$354,100
According to our research of Florida and other state lists, there were 33 registered sex offenders living in 33707 zip code as of April 27, 2024. The ratio of all residents to sex offenders in zip code 33707 is 763 to 1. The ratio of registered sex offenders to all residents in this zip code is lower than the state average.
Median resident age:
This zip code:
59.6 years
Florida median age:
42.7 years
Average household size:
This zip code:
1.8 people
Florida:
2.5 people
Averages for the 2020 tax year for zip code 33707, filed in 2021:
Average Adjusted Gross Income (AGI) in 2020: $99,844 (Individual Income Tax Returns)
Here:
$99,844
State:
$82,200
Salary/wage: $65,235 (reported on 66.6% of returns)
Here:
$65,235
State:
$58,347
(% of AGI for various income ranges: 1096.9% for AGIs below $25k, 3380.5% for AGIs $25k-50k, 5834.7% for AGIs $50k-75k, 8345.1% for AGIs $75k-100k, 15527.6% for AGIs $100k-200k, 102348.6% for AGIs over 200k)
Taxable interest for individuals: $3,477 (reported on 37.3% of returns)
This zip code:
$3,477
Florida:
$4,272
(% of AGI for various income ranges: 41.4% for AGIs below $25k, 51.7% for AGIs $25k-50k, 128.4% for AGIs $50k-75k, 216.1% for AGIs $75k-100k, 453.4% for AGIs $100k-200k, 3799.1% for AGIs over 200k)
Ordinary dividends: $10,895 (reported on 30.8% of returns)
Here:
$10,895
State:
$15,863
(% of AGI for various income ranges: 74.7% for AGIs below $25k, 108.5% for AGIs $25k-50k, 255.4% for AGIs $50k-75k, 594.4% for AGIs $75k-100k, 1330.6% for AGIs $100k-200k, 10234.5% for AGIs over 200k)
Net capital gain/loss in AGI: +$50,535 (reported on 29.2% of returns)
Here:
+$50,535
State:
+$62,983
(% of AGI for various income ranges: 40.0% for AGIs below $25k, 81.3% for AGIs $25k-50k, 237.1% for AGIs $50k-75k, 639.2% for AGIs $75k-100k, 2007.5% for AGIs $100k-200k, 76282.7% for AGIs over 200k)
Profit/loss from business: +$15,445 (reported on 17.9% of returns)
Here:
+$15,445
State:
+$9,719
(% of AGI for various income ranges: 145.3% for AGIs below $25k, 183.4% for AGIs $25k-50k, 327.7% for AGIs $50k-75k, 405.8% for AGIs $75k-100k, 705.6% for AGIs $100k-200k, 7433.6% for AGIs over 200k)
Taxable individual retirement arrangement distribution: $23,206 (reported on 16.2% of returns)
33707:
$23,206
Florida:
$24,823
(% of AGI for various income ranges: 134.2% for AGIs below $25k, 221.9% for AGIs $25k-50k, 476.4% for AGIs $50k-75k, 1001.7% for AGIs $75k-100k, 1841.8% for AGIs $100k-200k, 6683.2% for AGIs over 200k)
Self-employed (Keogh) retirement plans: $23,762 (reported on 0.6% of returns)
33707:
$23,762
Florida:
$29,694
(% of AGI for various income ranges: 85.7% for AGIs $100k-200k, 556.4% for AGIs over 200k)
Total itemized deductions: $38,354 (reported on 9.6% of returns)
Here:
$38,354
State:
$45,393
(% of AGI for various income ranges: 73.0% for AGIs below $25k, 166.6% for AGIs $25k-50k, 354.8% for AGIs $50k-75k, 662.2% for AGIs $75k-100k, 1179.6% for AGIs $100k-200k, 11533.6% for AGIs over 200k)
Charity contributions: $11,301 (reported on 7.7% of returns)
Here:
$11,301
State:
$20,178
(% of AGI for various income ranges: 4.1% for AGIs below $25k, 22.5% for AGIs $25k-50k, 37.2% for AGIs $50k-75k, 72.7% for AGIs $75k-100k, 202.9% for AGIs $100k-200k, 3745.5% for AGIs over 200k)
Taxes paid: $6,975 (reported on 9.4% of returns)
33707:
$6,975
State:
$6,967
(% of AGI for various income ranges: 10.3% for AGIs below $25k, 26.6% for AGIs $25k-50k, 57.1% for AGIs $50k-75k, 145.4% for AGIs $75k-100k, 276.5% for AGIs $100k-200k, 1825.9% for AGIs over 200k)
Earned income credit: $1,612 (reported on 11.6% of returns)
Here:
$1,612
State:
$2,306
(% of AGI for various income ranges: 62.7% for AGIs below $25k, 31.3% for AGIs $25k-50k)
Percentage of individuals using paid preparers for their 2020 taxes: 90.7%
Here:
91%
State:
92%
(% for various income ranges: 89.3% for AGIs below $25k, 92.2% for AGIs $25k-50k, 91.2% for AGIs $50k-75k, 88.2% for AGIs $75k-100k, 91.2% for AGIs $100k-200k, 93.9% for AGIs over 200k)
Averages for the 2012 tax year for zip code 33707, filed in 2013:
Average Adjusted Gross Income (AGI) in 2012: $62,435 (Individual Income Tax Returns)
Here:
$62,435
State:
$60,316
Salary/wage: $49,924 (reported on 69.7% of returns)
Here:
$49,924
State:
$45,277
(% of AGI for various income ranges: 64.1% for AGIs below $25k, 68.5% for AGIs $25k-50k, 59.2% for AGIs $50k-75k, 55.0% for AGIs $75k-100k, 55.3% for AGIs $100k-200k, 48.0% for AGIs over 200k)
Taxable interest for individuals: $3,281 (reported on 38.8% of returns)
This zip code:
$3,281
Florida:
$3,587
(% of AGI for various income ranges: 2.5% for AGIs below $25k, 1.5% for AGIs $25k-50k, 1.7% for AGIs $50k-75k, 2.1% for AGIs $75k-100k, 2.8% for AGIs $100k-200k, 1.9% for AGIs over 200k)
Ordinary dividends: $9,969 (reported on 27.6% of returns)
Here:
$9,969
State:
$12,831
(% of AGI for various income ranges: 4.2% for AGIs below $25k, 3.3% for AGIs $25k-50k, 3.3% for AGIs $50k-75k, 4.3% for AGIs $75k-100k, 4.8% for AGIs $100k-200k, 5.0% for AGIs over 200k)
Net capital gain/loss in AGI: +$18,142 (reported on 24.0% of returns)
Here:
+$18,142
State:
+$33,493
(% of AGI for various income ranges: 0.4% for AGIs $25k-50k, 1.2% for AGIs $50k-75k, 1.6% for AGIs $75k-100k, 4.0% for AGIs $100k-200k, 16.1% for AGIs over 200k)
Profit/loss from business: +$13,223 (reported on 15.2% of returns)
Here:
+$13,223
State:
+$10,012
(% of AGI for various income ranges: 8.2% for AGIs below $25k, 3.0% for AGIs $25k-50k, 2.0% for AGIs $50k-75k, 1.3% for AGIs $75k-100k, 2.7% for AGIs $100k-200k, 3.3% for AGIs over 200k)
Taxable individual retirement arrangement distribution: $16,906 (reported on 16.3% of returns)
33707:
$16,906
Florida:
$21,544
(% of AGI for various income ranges: 5.6% for AGIs below $25k, 3.7% for AGIs $25k-50k, 4.4% for AGIs $50k-75k, 6.7% for AGIs $75k-100k, 6.2% for AGIs $100k-200k, 2.9% for AGIs over 200k)
Self-employment retirement plans: $24,460 (reported on 0.4% of returns)
33707:
$24,460
Florida:
$20,611
Total itemized deductions: $24,733 (18% of AGI, reported on 26.3% of returns)
Here:
$24,733
State:
$25,533
Here:
17.7% of AGI
State:
18.0% of AGI
(% of AGI for various income ranges: 12.1% for AGIs below $25k, 9.0% for AGIs $25k-50k, 10.6% for AGIs $50k-75k, 10.8% for AGIs $75k-100k, 12.6% for AGIs $100k-200k, 9.3% for AGIs over 200k)
Charity contributions: $4,332 (reported on 21.4% of returns)
Here:
$4,332
State:
$5,698
(% of AGI for various income ranges: 0.8% for AGIs below $25k, 0.9% for AGIs $25k-50k, 1.3% for AGIs $50k-75k, 1.7% for AGIs $75k-100k, 1.6% for AGIs $100k-200k, 1.8% for AGIs over 200k)
Taxes paid: $6,853 (reported on 25.6% of returns)
33707:
$6,853
State:
$6,203
(% of AGI for various income ranges: 2.0% for AGIs below $25k, 1.6% for AGIs $25k-50k, 2.2% for AGIs $50k-75k, 2.4% for AGIs $75k-100k, 3.8% for AGIs $100k-200k, 3.3% for AGIs over 200k)
Earned income credit: $1,859 (reported on 15.7% of returns)
Here:
$1,859
State:
$2,372
(% of AGI for various income ranges: 4.6% for AGIs below $25k, 0.5% for AGIs $25k-50k)
Percentage of individuals using paid preparers for their 2012 taxes: 51.7%
Here:
52%
State:
54%
(% for various income ranges: 46.2% for AGIs below $25k, 47.4% for AGIs $25k-50k, 53.0% for AGIs $50k-75k, 60.9% for AGIs $75k-100k, 65.7% for AGIs $100k-200k, 84.6% for AGIs over 200k)
Averages for the 2004 tax year for zip code 33707, filed in 2005:
Average Adjusted Gross Income (AGI) in 2004: $51,518 (Individual Income Tax Returns)
Here:
$51,518
State:
$50,523
Salary/wage: $40,136 (reported on 69.4% of returns)
Here:
$40,136
State:
$39,563
(% of AGI for various income ranges: 103.4% for AGIs below $10k, 63.8% for AGIs $10k-25k, 68.4% for AGIs $25k-50k, 59.5% for AGIs $50k-75k, 56.4% for AGIs $75k-100k, 44.0% for AGIs over 100k)
Taxable interest for individuals: $3,923 (reported on 50.6% of returns)
This zip code:
$3,923
Florida:
$3,211
(% of AGI for various income ranges: 15.7% for AGIs below $10k, 6.0% for AGIs $10k-25k, 3.4% for AGIs $25k-50k, 3.2% for AGIs $50k-75k, 3.8% for AGIs $75k-100k, 3.5% for AGIs over 100k)
Taxable dividends: $5,791 (reported on 33.4% of returns)
Here:
$5,791
State:
$6,129
(% of AGI for various income ranges: 11.7% for AGIs below $10k, 3.7% for AGIs $10k-25k, 2.8% for AGIs $25k-50k, 3.9% for AGIs $50k-75k, 3.6% for AGIs $75k-100k, 3.9% for AGIs over 100k)
Net capital gain/loss: +$20,217 (reported on 29.0% of returns)
Here:
+$20,217
State:
+$27,205
(% of AGI for various income ranges: 7.0% for AGIs below $10k, 0.6% for AGIs $10k-25k, 0.8% for AGIs $25k-50k, 3.1% for AGIs $50k-75k, 3.9% for AGIs $75k-100k, 20.8% for AGIs over 100k)
Profit/loss from business: +$14,220 (reported on 14.2% of returns)
Here:
+$14,220
State:
+$10,634
(% of AGI for various income ranges: 11.0% for AGIs below $10k, 5.3% for AGIs $10k-25k, 2.7% for AGIs $25k-50k, 3.1% for AGIs $50k-75k, 3.1% for AGIs $75k-100k, 4.3% for AGIs over 100k)
Profit/loss from farming: +$2,091 (reported on 0.1% of returns)
Here:
+$2,091
State:
-$6,005
IRA payment deduction: $3,116 (reported on 2.9% of returns)
33707:
$3,116
Florida:
$3,082
(% of AGI for various income ranges: 0.6% for AGIs below $10k, 0.3% for AGIs $10k-25k, 0.3% for AGIs $25k-50k, 0.2% for AGIs $50k-75k, 0.2% for AGIs $75k-100k, 0.1% for AGIs over 100k)
Self-employed pension: $16,620 (reported on 0.7% of returns)
Here:
$16,620
Florida:
$15,857
Total itemized deductions: $19,448 (19% of AGI, reported on 29.8% of returns)
Here:
$19,448
State:
$20,370
Here:
18.7% of AGI
State:
20.7% of AGI
(% of AGI for various income ranges: 25.8% for AGIs below $10k, 11.1% for AGIs $10k-25k, 12.0% for AGIs $25k-50k, 13.4% for AGIs $50k-75k, 14.3% for AGIs $75k-100k, 9.5% for AGIs over 100k)
Charity contributions deductions: $3,476 (3% of AGI, reported on 24.9% of returns)
Here:
$3,476
State:
$4,064
Here:
3.1% of AGI
State:
3.8% of AGI
(% of AGI for various income ranges: 1.6% for AGIs below $10k, 0.9% for AGIs $10k-25k, 1.2% for AGIs $25k-50k, 1.7% for AGIs $50k-75k, 2.1% for AGIs $75k-100k, 1.9% for AGIs over 100k)
Total tax: $9,570 (reported on 77.0% of returns)
33707:
$9,570
State:
$9,431
(% of AGI for various income ranges: 4.3% for AGIs below $10k, 4.4% for AGIs $10k-25k, 7.7% for AGIs $25k-50k, 10.2% for AGIs $50k-75k, 11.5% for AGIs $75k-100k, 20.3% for AGIs over 100k)
Earned income credit: $1,501 (reported on 13.1% of returns)
Here:
$1,501
State:
$1,808
Percentage of individuals using paid preparers for their 2004 taxes: 58.1%
Here:
58%
State:
60%
(% for various income ranges: 54.7% for AGIs below $10k, 57.1% for AGIs $10k-25k, 54.3% for AGIs $25k-50k, 59.1% for AGIs $50k-75k, 60.6% for AGIs $75k-100k, 76.6% for AGIs over 100k)
Likely homosexual households (counted as self-reported same-sex unmarried-partner households)
Lesbian couples: 0.4% of all households
Gay men: 0.9% of all households
Household received Food Stamps/SNAP in the past 12 months: 961 Household did not receive Food Stamps/SNAP in the past 12 months: 12,552
Women who had a birth in the past 12 months: 171 (114 now married, 57 unmarried) Women who did not have a birth in the past 12 months: 3,708 (1,091 now married, 2,615 unmarried)
Housing units in zip code 33707 with a mortgage: 4,337 (475 second mortgage, 6 home equity loan, 453 both second mortgage and home equity loan) Houses without a mortgage: 88
Median monthly owner costs for units with a mortgage: $1,737 Median monthly owner costs for units without a mortgage: $733
Residents with income below the poverty level in 2022:
This zip code:
12.0%
Whole state:
12.7%
Residents with income below 50% of the poverty level in 2022:
This zip code:
5.1%
Whole state:
6.6%
Median number of rooms in houses and condos:
Here:
5.4
State:
5.9
Median number of rooms in apartments:
Here:
3.9
State:
4.2
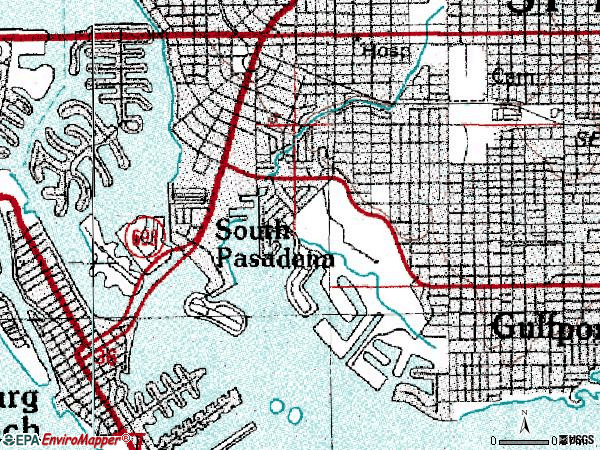
Notable locations in this zip code not listed on our city pages
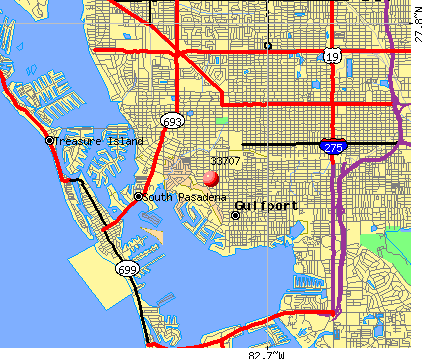
Notable locations in zip code 33707: Treasure Island Plaza (A), Gulfport Fire Department (B), South Pasadena Fire Department (C), Gulfport Police Department (D), Gulfport Recreation Center (E). Display/hide their locations on the map
Shopping Centers: Pasadena Square Shopping Center (1), Pasadena Shopping Center (2), Gulfpost Plaza-Disston Shopping Center (3). Display/hide their locations on the map
Churches in zip code 33707 include: Pasadena Baptist Church (A), First United methodist Church of Gulfport (B), Saint Andrew Lutheran Church (C), Bethel Lutheran Church (D), Grace Bible Church (E), Bay Point Christian Church (F). Display/hide their locations on the map
Cemeteries: Woodlawn Cemetery (1), Lincoln Cemetery (2), Royal Palm of Saint Petersburg (3), Royal Palm Cemetery (4). Display/hide their locations on the map
Parks in zip code 33707 include: Duryea Park (1), Gulfport Beach Area (2), Huffman Way Mini Park (3), Island Drive Mini Park (4), Hoyt Park (5), Circle Park (6), Sunset Park (7), Coconut Park (8), Pasadena Circle (9). Display/hide their locations on the map
In group quarters: 952 (-1 institutionalized population)
Size of family households: 4,510 2-persons, 1,184 3-persons, 432 4-persons, 146 5-persons, 62 6-persons, 7 7-or-more-persons
Size of nonfamily households: 5,811 1-person, 1,225 2-persons, 89 3-persons
882 married couples with children.
980 single-parent households (330 men, 650 women).
90.1% of residents of 33707 zip code speak English at home.
5.4% of residents speak Spanish at home (60% very well, 16% well, 19% not well, 4% not at all).
3.4% of residents speak other Indo-European language at home (74% very well, 15% well, 11% not well).
0.4% of residents speak Asian or Pacific Island language at home (53% very well, 47% well).
0.9% of residents speak other language at home (41% very well, 20% well, 39% not well).
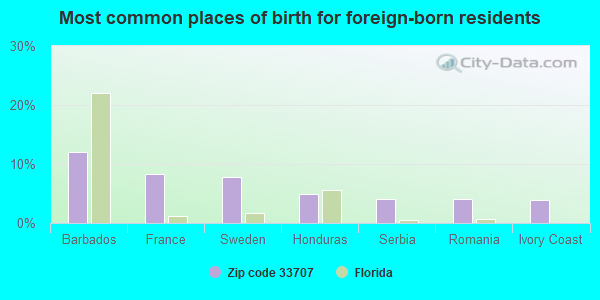
Foreign born population: 2,554 (9.9%) (65.5% of them are naturalized citizens)
This zip code:
9.9%
Whole state:
21.7%
12%Barbados
8%France
8%Sweden
5%Honduras
4%Serbia
4%Romania
4%Ivory Coast
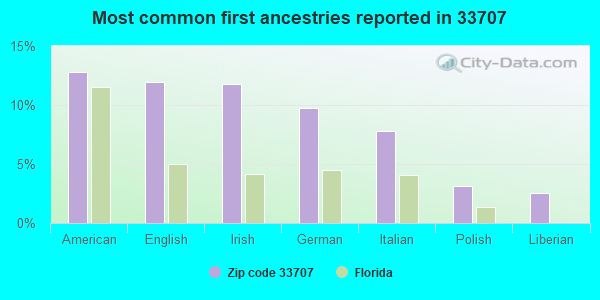
13%American
12%English
12%Irish
10%German
8%Italian
3%Polish
3%Liberian
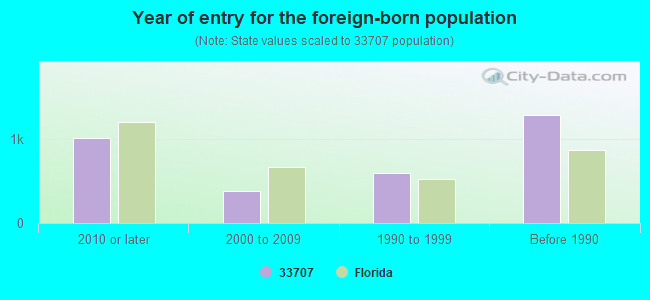
Year of entry for the foreign-born population
1,0132010 or later
3872000 to 2009
6031990 to 1999
1,292Before 1990
Major facilities with environmental interests located in this zip code:
BOCA CIEGA HIGH SCHOOL (924 58TH STREET, SOUTH in GULFPORT, FL)
(Geographic Names Information System) (National Center for Education Statistics) - STATE ID-0431 Organizations: PINELLAS COUNTY SCHOOL DISTRICT (SCHOOL DISTRICT)
HAMILTON DISSTON SCHOOL (5125 11TH AVENUE, SOUTH in GULFPORT, FL)
(National Center for Education Statistics) - STATE ID-0981 Organizations: PINELLAS COUNTY SCHOOL DISTRICT (SCHOOL DISTRICT)
AMOCO STATION NO. 355 (1601 PASADENA AVE in SOUTH PASADENA, FL)
National Pollutant Discharge Elimination System NON-MAJOR (Tracking pollutant discharge elimination systems) - permit Small Quantity Generators, between 100 kg and 1000 kg of hazardous waste/month (Resource Conservation and Recovery Act (tracking hazardous waste)) - notification Business SIC classification: GASOLINE SERVICE STATIONS Organizations: DANIEL ISSE, DEALER (CONTACT/OWNER)
Alternative names: AMOCO STATION #355, AMOCO SERVICE STATION #355, E.S. & E.
D. HARB'S INC (6708 CENTRAL AVE in SAINT PETERSBURG, FL)
AIR MINOR (AIRS/AFS) Small Quantity Generators, between 100 kg and 1000 kg of hazardous waste/month (Resource Conservation and Recovery Act (tracking hazardous waste)) - notification Business SIC classification: DRYCLEANING PLANTS, EXCEPT RUG CLEANING Organizations: DAVE HARB, OWNER (CONTACT/OWNER)
Alternative names: BILLS CLEANERS
HORIZON PACKAGING CORP (5201 8TH AVENUE SOUTH in ST PETERSBURG, FL)
(Resource Conservation and Recovery Act (tracking hazardous waste)) Organizations: CARL MILKE, MGR (CONTACT/OWNER)
INTER AMERICAS AUTO TIRES AND REPAIRS (5080 15TH AVE S in GULFPORT, FL)
(Resource Conservation and Recovery Act (tracking hazardous waste)) Business NAICS classification: GENERAL AUTOMOTIVE REPAIR. Organizations: LENNA GAYLE (CONTACT/OWNER)
PALMS OF PASADENA HOSPITAL (1501 PASADENA AVE S in ST PETERSBURG, FL)
(Resource Conservation and Recovery Act (tracking hazardous waste)) Organizations: STEVE BELIN, COMPLAINCE MGR (CONTACT/OWNER)
GREAT AMERICAN BOAT YARD (6810 GULFPORT BLVD in ST PETERSBURG, FL)
Small Quantity Generators, between 100 kg and 1000 kg of hazardous waste/month (Resource Conservation and Recovery Act (tracking hazardous waste)) - notification Organizations: GUS STAVROS (CONTACT/OWNER)
Alternative names: GREAT AMERICAN MARINE
H & H LAUNDROMAT & DRY CLEANERS (1212 S PASADENA AVE in ST PETERSBURG, FL)
Small Quantity Generators, between 100 kg and 1000 kg of hazardous waste/month (Resource Conservation and Recovery Act (tracking hazardous waste)) - notification Organizations: GARY KRADLE, OWNER (CONTACT/OWNER)
HOLIDAY CLEANERS (5000 CENTRAL AVE in ST PETERSBURG, FL)
Small Quantity Generators, between 100 kg and 1000 kg of hazardous waste/month (Resource Conservation and Recovery Act (tracking hazardous waste)) - notification Organizations: GEORGE B GUCH (CONTACT/OWNER)
K MART (950 PASASENA AVE S in ST PETERSBURG, FL)
Small Quantity Generators, between 100 kg and 1000 kg of hazardous waste/month (Resource Conservation and Recovery Act (tracking hazardous waste)) - notification Organizations: VICTOR FIALLO (CONTACT/OWNER)
Housing units lacking complete plumbing facilities: 0.8% Housing units lacking complete kitchen facilities: 2.3%
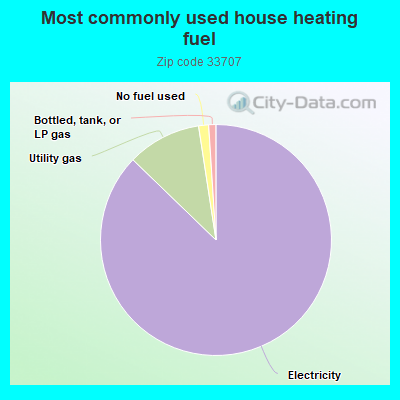
86.8%Electricity
10.3%Utility gas
1.4%No fuel used
1.0%Bottled, tank, or LP gas
Population in 1990: 23,630. Population change in the 1990s: +2,912 (+12.3%).
Place of birth for U.S.-born residents:
This state: 6,102
Northeast: 6,837
Midwest: 4,718
South: 3,506
West: 1,267
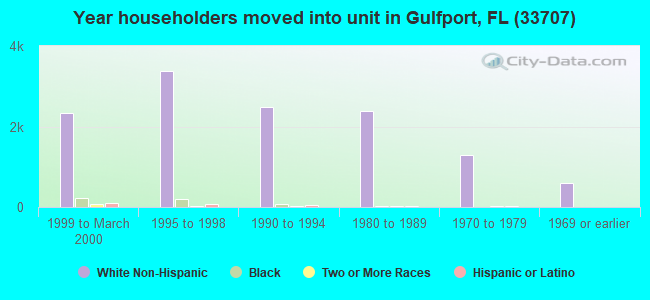
54% of the 33707 zip code residents lived in the same house 5 years ago. Out of people who lived in different houses, 61% lived in this county. Out of people who lived in different counties, 50% lived in Florida.
87% of the 33707 zip code residents lived in the same house 1 year ago. Out of people who lived in different houses, 36% moved from this county. Out of people who lived in different houses, 29% moved from different county within same state. Out of people who lived in different houses, 31% moved from different state. Out of people who lived in different houses, 6% moved from abroad.
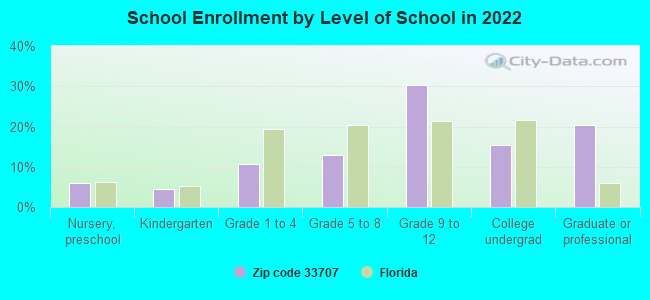
Private vs. public school enrollment:
Students in private schools in grades 1 to 8 (elementary and middle school): 157
Here:
22.2%
Florida:
15.8%
Students in private schools in grades 9 to 12 (high school): 97
Here:
10.7%
Florida:
12.9%
Students in private undergraduate colleges: 99
Here:
21.4%
Florida:
23.6%
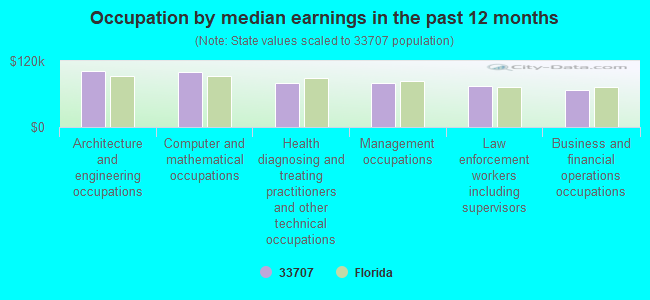
Occupation by median earnings in the past 12 months ($)
102,231Architecture and engineering occupations
100,841Computer and mathematical occupations
80,003Health diagnosing and treating practitioners and other technical occupations
79,701Management occupations
74,094Law enforcement workers including supervisors
67,902Business and financial operations occupations
Companies with federal contracts located in this zip code:
CO-OP FUELS & LUBRICANTS, INC (4911 8TH AVE S in SAINT PETERSBU, FL; small business) : $3,210,643 in 5 contractsfrom 2004 to 2005
Contracts for Fuel Oils by Defense Logistics Agency, U.S. Coast Guard Signed by year:2000: $0; 2001: $0; 2002: $0; 2003: $0; 2004: $3,148,855; 2005: $61,788; 2006: $0.
Biggest contracts:
$2,905,755 with Defense Logistics Agency for Fuel Oils. Signed on 2004-05-27. Completion date: 2006-04-30.
$243,100, same as above.Signed on 2004-06-29. Completion date: 2006-03-31.
$22,590 with U.S. Coast Guard for Fuel Oils. Signed on 2005-05-14. Completion date: 2005-06-13.
$19,950, same as above.Signed on 2005-04-27. Completion date: 2005-05-27.
TRITON ELECTRONIC ENTERPRISES (5961 BAYVIEW CIRCLE SOUTH in GULFPORT, FL; small business) : $29,676 in 3 contractsin 2004
$93,534 with Navy for Electrical Control Equipment. Taking place in IL. Signed on 2004-04-21. Completion date: 2004-08-18.
$29,676 with Defense Logistics Agency for Hardware, Commercial. Signed on 2004-04-01. Completion date: 2004-07-15.
-$93,534 with Navy for Electrical Control Equipment. Taking place in IL. Signed on 2004-11-15. Completion date: 2004-08-18.
HERVISH, LEA (1241 79TH STREET SOUTH in SAINT PETERSBU, FL; small business) : $6,944 in 2 contractsin 2004
$4,398 with Defense Logistics Agency for Hardware, Commercial. Taking place in TN. Signed on 2004-11-09. Completion date: 2005-03-10.
$2,546 with Defense Logistics Agency for Hardware, Commercial. Taking place in PA. Signed on 2004-11-09. Completion date: 2005-03-10.
ASSURED ELECTRONICS CORP (6036 CENTRAL AVE in SAINT PETERSBU, FL; small business)
$2,700 with Defense Logistics Agency for Microcircuits, Electronic. Signed on 2006-06-30. Completion date: 2006-07-24.
Top industries in this zip code by the number of employees in 2005:
Health Care and Social Assistance: Nursing Care Facilities (100-249 employees: 4 establishments, 50-99 employees: 2 establishments)
Finance and Insurance: Real Estate Credit (250-499: 1, 100-249: 2, 50-99: 1, 10-19: 1, 1-4: 4)
Health Care and Social Assistance: General Medical and Surgical Hospitals (500-999: 1)
2002 - 2018 National Fire Incident Reporting System (NFIRS) incidents
Based on the data from the years 2002 - 2018 the average number of fires per year is 115. The highest number of reported fire incidents - 179 took place in 2005, and the least - 78 in 2003. The data has a rising trend.
When looking into fire subcategories, the most reports belonged to: Structure Fires (48.1%), and Outside Fires (27.4%).
Fire incident types reported to NFIRS in Zip Code 33707


+$2,091
-$6,005
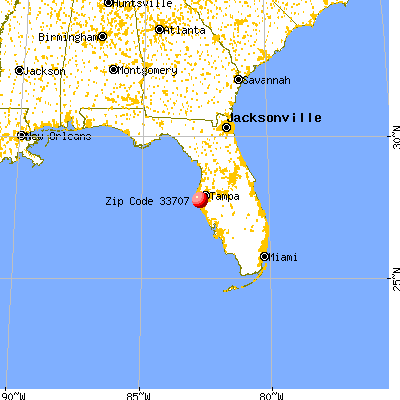
 Nearest zip codes: 33706, 33710, 33711, 33713, 33712, 33709.


 Based on the data from the years 2002 - 2018 the average number of fires per year is 115. The highest number of reported fire incidents - 179 took place in 2005, and the least - 78 in 2003. The data has a rising trend.
 When looking into fire subcategories, the most reports belonged to: Structure Fires (48.1%), and Outside Fires (27.4%).