Estimated zip code population in 2022: 31,768 Zip code population in 2010: 28,929 Zip code population in 2000: 28,855
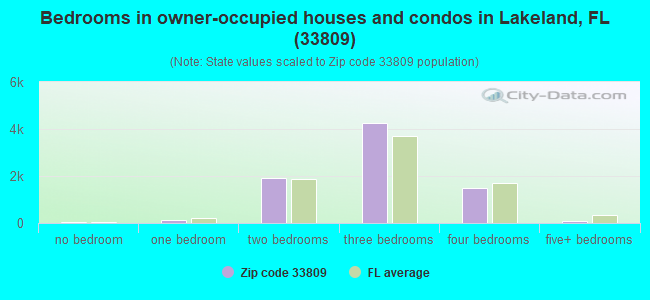
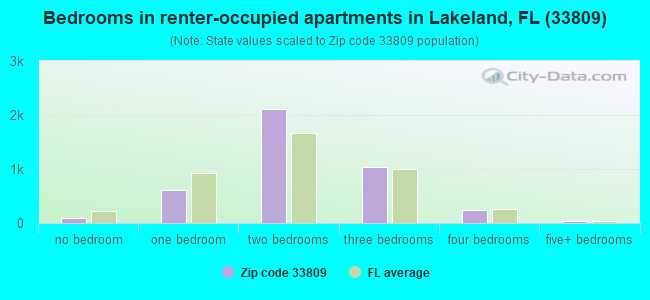
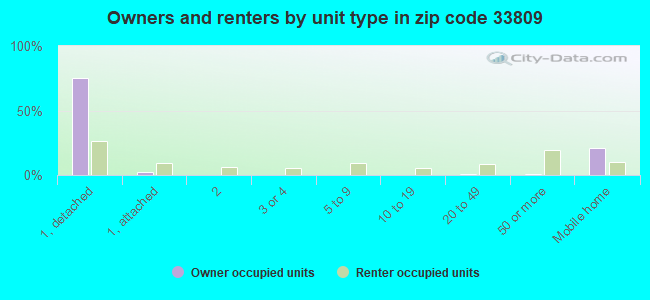
Houses and condos: 12,932 Renter-occupied apartments: 4,132
% of renters here:
34%
State:
33%
March 2022 cost of living index in zip code 33809: 87.7 (less than average, U.S. average is 100)
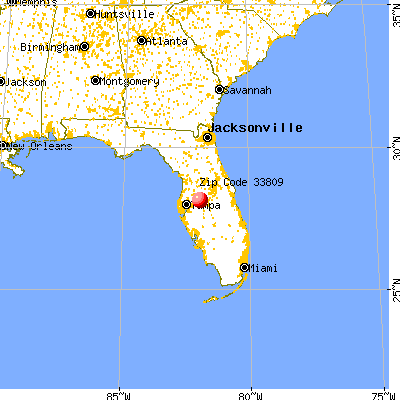
Land area: 88.3 sq. mi. Water area: 1.5 sq. mi.
Population density: 360 people per square mile
(very low).
OSM Map
General Map
Google Map
MSN Map
OSM Map
General Map
Google Map
MSN Map
OSM Map
General Map
Google Map
MSN Map
OSM Map
General Map
Google Map
MSN Map
Please wait while loading the map...
Real estate property taxes paid for housing units in 2022:
This zip code:
0.6% ($1,630)
Florida:
0.7% ($2,529)
Median real estate property taxes paid for housing units with mortgages in 2022: $1,838 (0.6%) Median real estate property taxes paid for housing units with no mortgage in 2022: $1,360 (0.6%)
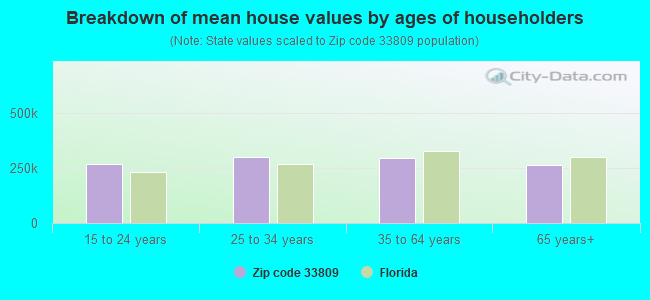
Estimated median house/condo value in 2022: $268,786
33809:
$268,786
Florida:
$354,100
According to our research of Florida and other state lists, there were 56 registered sex offenders living in 33809 zip code as of April 27, 2024. The ratio of all residents to sex offenders in zip code 33809 is 520 to 1. The ratio of registered sex offenders to all residents in this zip code is near the state average.
Median resident age:
This zip code:
42.9 years
Florida median age:
42.7 years
Average household size:
This zip code:
2.6 people
Florida:
2.5 people
Averages for the 2020 tax year for zip code 33809, filed in 2021:
Average Adjusted Gross Income (AGI) in 2020: $52,666 (Individual Income Tax Returns)
Here:
$52,666
State:
$82,200
Salary/wage: $46,463 (reported on 79.4% of returns)
Here:
$46,463
State:
$58,347
(% of AGI for various income ranges: 1158.4% for AGIs below $25k, 3499.2% for AGIs $25k-50k, 6080.5% for AGIs $50k-75k, 9104.1% for AGIs $75k-100k, 15645.2% for AGIs $100k-200k, 49393.3% for AGIs over 200k)
Taxable interest for individuals: $1,635 (reported on 21.2% of returns)
This zip code:
$1,635
Florida:
$4,272
(% of AGI for various income ranges: 15.4% for AGIs below $25k, 19.9% for AGIs $25k-50k, 51.9% for AGIs $50k-75k, 75.6% for AGIs $75k-100k, 143.3% for AGIs $100k-200k, 988.9% for AGIs over 200k)
Ordinary dividends: $6,809 (reported on 17.3% of returns)
Here:
$6,809
State:
$15,863
(% of AGI for various income ranges: 24.8% for AGIs below $25k, 40.0% for AGIs $25k-50k, 127.1% for AGIs $50k-75k, 281.5% for AGIs $75k-100k, 644.4% for AGIs $100k-200k, 4583.3% for AGIs over 200k)
Net capital gain/loss in AGI: +$11,399 (reported on 12.0% of returns)
Here:
+$11,399
State:
+$62,983
(% of AGI for various income ranges: 6.7% for AGIs below $25k, 18.1% for AGIs $25k-50k, 94.5% for AGIs $50k-75k, 211.7% for AGIs $75k-100k, 601.9% for AGIs $100k-200k, 11105.6% for AGIs over 200k)
Profit/loss from business: +$7,413 (reported on 14.3% of returns)
Here:
+$7,413
State:
+$9,719
(% of AGI for various income ranges: 95.9% for AGIs below $25k, 85.4% for AGIs $25k-50k, 137.8% for AGIs $50k-75k, 213.0% for AGIs $75k-100k, 261.2% for AGIs $100k-200k, 2428.9% for AGIs over 200k)
Taxable individual retirement arrangement distribution: $17,381 (reported on 10.1% of returns)
33809:
$17,381
Florida:
$24,823
(% of AGI for various income ranges: 68.3% for AGIs below $25k, 96.7% for AGIs $25k-50k, 227.8% for AGIs $50k-75k, 471.5% for AGIs $75k-100k, 766.7% for AGIs $100k-200k, 4883.3% for AGIs over 200k)
Total itemized deductions: $34,268 (reported on 5.2% of returns)
Here:
$34,268
State:
$45,393
(% of AGI for various income ranges: 42.8% for AGIs below $25k, 121.4% for AGIs $25k-50k, 362.5% for AGIs $50k-75k, 406.4% for AGIs $75k-100k, 725.4% for AGIs $100k-200k, 4207.8% for AGIs over 200k)
Charity contributions: $10,871 (reported on 4.2% of returns)
Here:
$10,871
State:
$20,178
(% of AGI for various income ranges: 2.7% for AGIs below $25k, 18.9% for AGIs $25k-50k, 66.6% for AGIs $50k-75k, 82.2% for AGIs $75k-100k, 237.9% for AGIs $100k-200k, 2047.8% for AGIs over 200k)
Taxes paid: $4,631 (reported on 5.0% of returns)
33809:
$4,631
State:
$6,967
(% of AGI for various income ranges: 4.6% for AGIs below $25k, 16.7% for AGIs $25k-50k, 41.0% for AGIs $50k-75k, 59.0% for AGIs $75k-100k, 91.9% for AGIs $100k-200k, 626.7% for AGIs over 200k)
Earned income credit: $2,363 (reported on 18.3% of returns)
Here:
$2,363
State:
$2,306
(% of AGI for various income ranges: 102.1% for AGIs below $25k, 69.7% for AGIs $25k-50k, 1.3% for AGIs $50k-75k)
Percentage of individuals using paid preparers for their 2020 taxes: 92.5%
Here:
92%
State:
92%
(% for various income ranges: 91.5% for AGIs below $25k, 93.8% for AGIs $25k-50k, 92.3% for AGIs $50k-75k, 92.9% for AGIs $75k-100k, 92.0% for AGIs $100k-200k, 92.9% for AGIs over 200k)
Averages for the 2012 tax year for zip code 33809, filed in 2013:
Average Adjusted Gross Income (AGI) in 2012: $44,929 (Individual Income Tax Returns)
Here:
$44,929
State:
$60,316
Salary/wage: $40,189 (reported on 80.8% of returns)
Here:
$40,189
State:
$45,277
(% of AGI for various income ranges: 73.5% for AGIs below $25k, 78.0% for AGIs $25k-50k, 74.2% for AGIs $50k-75k, 72.7% for AGIs $75k-100k, 71.7% for AGIs $100k-200k, 49.1% for AGIs over 200k)
Taxable interest for individuals: $1,556 (reported on 29.6% of returns)
This zip code:
$1,556
Florida:
$3,587
(% of AGI for various income ranges: 1.5% for AGIs below $25k, 0.8% for AGIs $25k-50k, 0.9% for AGIs $50k-75k, 0.9% for AGIs $75k-100k, 1.0% for AGIs $100k-200k, 1.9% for AGIs over 200k)
Ordinary dividends: $6,056 (reported on 19.8% of returns)
Here:
$6,056
State:
$12,831
(% of AGI for various income ranges: 2.6% for AGIs below $25k, 1.7% for AGIs $25k-50k, 2.0% for AGIs $50k-75k, 2.4% for AGIs $75k-100k, 3.5% for AGIs $100k-200k, 5.4% for AGIs over 200k)
Net capital gain/loss in AGI: +$5,315 (reported on 11.8% of returns)
Here:
+$5,315
State:
+$33,493
(% of AGI for various income ranges: 0.2% for AGIs $25k-50k, 0.5% for AGIs $50k-75k, 0.7% for AGIs $75k-100k, 1.4% for AGIs $100k-200k, 11.3% for AGIs over 200k)
Profit/loss from business: +$7,539 (reported on 12.7% of returns)
Here:
+$7,539
State:
+$10,012
(% of AGI for various income ranges: 5.6% for AGIs below $25k, 2.0% for AGIs $25k-50k, 1.2% for AGIs $50k-75k, 1.2% for AGIs $75k-100k, 1.5% for AGIs $100k-200k, 3.4% for AGIs over 200k)
Taxable individual retirement arrangement distribution: $12,550 (reported on 12.1% of returns)
33809:
$12,550
Florida:
$21,544
(% of AGI for various income ranges: 3.6% for AGIs below $25k, 2.9% for AGIs $25k-50k, 3.4% for AGIs $50k-75k, 3.5% for AGIs $75k-100k, 3.7% for AGIs $100k-200k, 3.2% for AGIs over 200k)
Self-employment retirement plans: $15,650 (reported on 0.2% of returns)
33809:
$15,650
Florida:
$20,611
Total itemized deductions: $19,526 (25% of AGI, reported on 22.4% of returns)
Here:
$19,526
State:
$25,533
Here:
25.0% of AGI
State:
18.0% of AGI
(% of AGI for various income ranges: 8.7% for AGIs below $25k, 9.4% for AGIs $25k-50k, 9.7% for AGIs $50k-75k, 10.3% for AGIs $75k-100k, 10.9% for AGIs $100k-200k, 7.6% for AGIs over 200k)
Charity contributions: $4,624 (reported on 17.7% of returns)
Here:
$4,624
State:
$5,698
(% of AGI for various income ranges: 0.6% for AGIs below $25k, 1.2% for AGIs $25k-50k, 1.8% for AGIs $50k-75k, 2.1% for AGIs $75k-100k, 2.8% for AGIs $100k-200k, 2.3% for AGIs over 200k)
Taxes paid: $2,923 (reported on 21.7% of returns)
33809:
$2,923
State:
$6,203
(% of AGI for various income ranges: 0.9% for AGIs below $25k, 1.1% for AGIs $25k-50k, 1.3% for AGIs $50k-75k, 1.5% for AGIs $75k-100k, 2.0% for AGIs $100k-200k, 1.5% for AGIs over 200k)
Earned income credit: $2,369 (reported on 20.5% of returns)
Here:
$2,369
State:
$2,372
(% of AGI for various income ranges: 6.9% for AGIs below $25k, 1.2% for AGIs $25k-50k)
Percentage of individuals using paid preparers for their 2012 taxes: 44.6%
Here:
45%
State:
54%
(% for various income ranges: 40.3% for AGIs below $25k, 43.7% for AGIs $25k-50k, 48.7% for AGIs $50k-75k, 51.3% for AGIs $75k-100k, 50.5% for AGIs $100k-200k, 76.9% for AGIs over 200k)
Averages for the 2004 tax year for zip code 33809, filed in 2005:
Average Adjusted Gross Income (AGI) in 2004: $40,969 (Individual Income Tax Returns)
Here:
$40,969
State:
$50,523
Salary/wage: $36,944 (reported on 82.6% of returns)
Here:
$36,944
State:
$39,563
(% of AGI for various income ranges: 99.6% for AGIs below $10k, 72.6% for AGIs $10k-25k, 78.3% for AGIs $25k-50k, 76.2% for AGIs $50k-75k, 80.9% for AGIs $75k-100k, 62.9% for AGIs over 100k)
Taxable interest for individuals: $1,945 (reported on 42.7% of returns)
This zip code:
$1,945
Florida:
$3,211
(% of AGI for various income ranges: 5.1% for AGIs below $10k, 2.8% for AGIs $10k-25k, 1.7% for AGIs $25k-50k, 1.9% for AGIs $50k-75k, 1.6% for AGIs $75k-100k, 2.2% for AGIs over 100k)
Taxable dividends: $2,776 (reported on 23.0% of returns)
Here:
$2,776
State:
$6,129
(% of AGI for various income ranges: 3.8% for AGIs below $10k, 1.8% for AGIs $10k-25k, 1.1% for AGIs $25k-50k, 1.3% for AGIs $50k-75k, 1.0% for AGIs $75k-100k, 2.4% for AGIs over 100k)
Net capital gain/loss: +$7,263 (reported on 16.6% of returns)
Here:
+$7,263
State:
+$27,205
(% of AGI for various income ranges: -0.9% for AGIs below $10k, -0.1% for AGIs $10k-25k, 0.4% for AGIs $25k-50k, 1.2% for AGIs $50k-75k, 1.9% for AGIs $75k-100k, 9.9% for AGIs over 100k)
Profit/loss from business: +$8,540 (reported on 12.2% of returns)
Here:
+$8,540
State:
+$10,634
(% of AGI for various income ranges: 3.7% for AGIs below $10k, 4.5% for AGIs $10k-25k, 2.3% for AGIs $25k-50k, 2.2% for AGIs $50k-75k, 1.7% for AGIs $75k-100k, 2.8% for AGIs over 100k)
IRA payment deduction: $3,014 (reported on 2.2% of returns)
33809:
$3,014
Florida:
$3,082
(% of AGI for various income ranges: 0.2% for AGIs $10k-25k, 0.2% for AGIs $25k-50k, 0.2% for AGIs $50k-75k, 0.1% for AGIs $75k-100k, 0.1% for AGIs over 100k)
Self-employed pension: $10,250 (reported on 0.3% of returns)
Here:
$10,250
Florida:
$15,857
(% of AGI for various income ranges: 0.1% for AGIs $10k-25k, 0.1% for AGIs $50k-75k, 0.2% for AGIs over 100k)
Total itemized deductions: $16,800 (25% of AGI, reported on 28.1% of returns)
Here:
$16,800
State:
$20,370
Here:
25.4% of AGI
State:
20.7% of AGI
(% of AGI for various income ranges: 15.9% for AGIs below $10k, 9.4% for AGIs $10k-25k, 10.6% for AGIs $25k-50k, 12.6% for AGIs $50k-75k, 12.8% for AGIs $75k-100k, 11.0% for AGIs over 100k)
Charity contributions deductions: $3,789 (5% of AGI, reported on 23.7% of returns)
Here:
$3,789
State:
$4,064
Here:
5.5% of AGI
State:
3.8% of AGI
(% of AGI for various income ranges: 1.0% for AGIs below $10k, 1.0% for AGIs $10k-25k, 1.6% for AGIs $25k-50k, 2.4% for AGIs $50k-75k, 2.4% for AGIs $75k-100k, 3.1% for AGIs over 100k)
Total tax: $5,227 (reported on 75.4% of returns)
33809:
$5,227
State:
$9,431
(% of AGI for various income ranges: 2.6% for AGIs below $10k, 3.8% for AGIs $10k-25k, 6.6% for AGIs $25k-50k, 8.6% for AGIs $50k-75k, 10.5% for AGIs $75k-100k, 16.5% for AGIs over 100k)
Earned income credit: $1,737 (reported on 15.3% of returns)
Here:
$1,737
State:
$1,808
Percentage of individuals using paid preparers for their 2004 taxes: 53.7%
Here:
54%
State:
60%
(% for various income ranges: 47.0% for AGIs below $10k, 55.7% for AGIs $10k-25k, 54.5% for AGIs $25k-50k, 54.5% for AGIs $50k-75k, 50.7% for AGIs $75k-100k, 61.9% for AGIs over 100k)
Likely homosexual households (counted as self-reported same-sex unmarried-partner households)
Lesbian couples: 0.1% of all households
Gay men: 0.0% of all households
Household received Food Stamps/SNAP in the past 12 months: 1,585 Household did not receive Food Stamps/SNAP in the past 12 months: 10,449
Women who had a birth in the past 12 months: 184 (162 now married, 27 unmarried) Women who did not have a birth in the past 12 months: 6,936 (2,849 now married, 4,086 unmarried)
Housing units in zip code 33809 with a mortgage: 4,172 (380 second mortgage, 22 home equity loan, 338 both second mortgage and home equity loan) Houses without a mortgage: 135
Median monthly owner costs for units with a mortgage: $1,439 Median monthly owner costs for units without a mortgage: $445
Residents with income below the poverty level in 2022:
This zip code:
10.0%
Whole state:
12.7%
Residents with income below 50% of the poverty level in 2022:
This zip code:
4.8%
Whole state:
6.6%
Median number of rooms in houses and condos:
Here:
6.0
State:
5.9
Median number of rooms in apartments:
Here:
4.4
State:
4.2
Notable locations in this zip code not listed on our city pages
Notable locations in zip code 33809: La Cita Golf and Country Club (A), Kissimmee Bay Country Club (B), Polk County Emergency Medical Services Station 10 - 24 Lakeland North (C), Polk County Sheriff's Office Northwest District Substation (D). Display/hide their locations on the map
Churches in zip code 33809 include: Providence Church (A), Christ the King Episcopal Church (B), Bible Presbyterian Church (C), Our Savior Lutheran Church (D), Lake Gibson Church (E), Crestview Church (F), Lake Gibson United Methodist Church (G). Display/hide their locations on the map
Lakes and swamps: Sick Lake (A), Lake Bowles (B), Lake Cameron (C), Country Oaks Lake (D), Lake Ennis (E), Lake French (F), Hidden Lake (G), Lake Gibson (H). Display/hide their locations on the map
3,599 married couples with children.
2,099 single-parent households (219 men, 1,880 women).
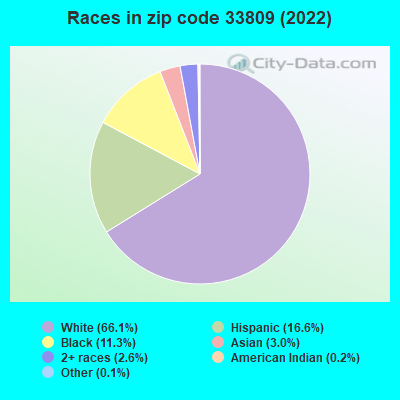
81.1% of residents of 33809 zip code speak English at home.
14.4% of residents speak Spanish at home (54% very well, 26% well, 13% not well, 7% not at all).
2.7% of residents speak other Indo-European language at home (56% very well, 32% well, 4% not well, 8% not at all).
1.4% of residents speak Asian or Pacific Island language at home (47% very well, 38% well, 16% not well).
0.1% of residents speak other language at home (47% very well, 53% well).
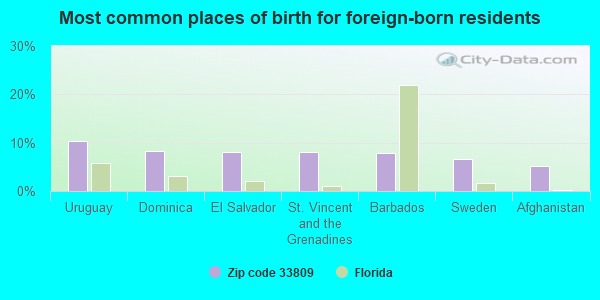
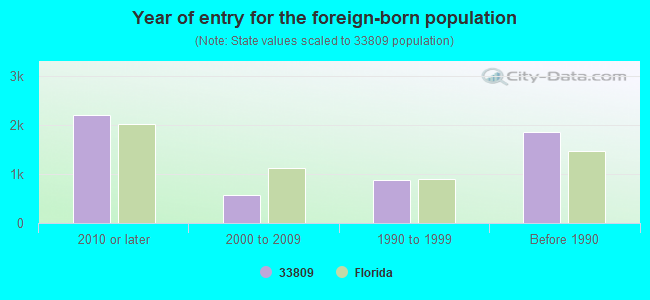
Foreign born population: 3,828 (12.1%) (62.9% of them are naturalized citizens)
Major facilities with environmental interests located in this zip code:
MIAMI SUBS - MOBIL OIL CORP #02 - GNV (3430 US HIGHWAY 98 NORTH in LAKELAND, FL)
STATE MASTER (FDM) - WAFR-FLG910578, INDUSTRIAL WASTEWATER PROGRAM, WAFR-FLG910697, National Pollutant Discharge Elimination System NON-MAJOR (Tracking pollutant discharge elimination systems) - permit Business SIC classification: GASOLINE SERVICE STATIONS Organizations: OHM REMEDIATION SERVICES CORP., MOBIL OIL CORPORATION, FLORIDA DEPT. OF TRANSPORTATION DIST. 1 (CONTACT/APPLICANT)
, OHM REMEDIATION SERVICES CORP. (CONTACT/APPLICANT)
Alternative names: FORMER MIAMI SUBS/FORMER MOBIL, FORMER MIAMI SUBS/FORMER MOBIL OIL CORP NO 02-GNV
SAI TRANSPORT (3420 YOUNGS RIDGE RD in LAKELAND, FL)
STATE MASTER (FDM) - CHAZ-FLR000030197, HAZARDOUS WASTE REGULATION PROGRAM (Resource Conservation and Recovery Act (tracking hazardous waste)) Business SIC classification: LOCAL TRUCKING WITH STORAGE Organizations: VICENT S COLLURA (CONTACT/OWNER)
, AMERICAN ENVIRONMENTAL CONTAINER CORP (CONTACT/OWNER)
Alternative names: S A I TRANSPORT
NATIONAL RV INC (8030 US HWY 98 N in LAKELAND, FL)
STATE MASTER (FDM) - CHAZ-FLD984217208, HAZARDOUS WASTE REGULATION PROGRAM Small Quantity Generators, between 100 kg and 1000 kg of hazardous waste/month (Resource Conservation and Recovery Act (tracking hazardous waste)) - notification Business SIC classification: RECREATIONAL VEHICLE DEALERS Organizations: HOWDY JONES USED EQUIPMENT, ROBERT TOCHENY (CONTACT/OWNER)
Alternative names: HOWDY JONES USED EQUIPMENT
CYPRESS LAKES PHASE 7 (10000 US 98 NORTH in LAKELAND, FL)
National Pollutant Discharge Elimination System NON-MAJOR (Tracking pollutant discharge elimination systems) - permit National Pollutant Discharge Elimination System NON-MAJOR (Tracking pollutant discharge elimination systems) - permit National Pollutant Discharge Elimination System NON-MAJOR (Tracking pollutant discharge elimination systems) - permit Organizations: DAVID FELICE (CONTACT/OWNER)
, SEAN RILEY (CONTACT/OWNER)
, DAVID FELICE (CONTACT/OWNER)
Alternative names: CYPRESS LAKES ASSOCIATES LTD, CYPRESS LAKES PHASE 10, CYPRESS LAKES, UNIT 11, PALAZZO
AVANTI COACH CORPORATION (8330 EPICENTER BLVD in LAKELAND, FL)
STATE MASTER (FDM) - CHAZ-FLR000055483, HAZARDOUS WASTE REGULATION PROGRAM (Resource Conservation and Recovery Act (tracking hazardous waste)) Business SIC classification: TOP, BODY, AND UPHOLSTERY REPAIR SHOPS AND PAINT SHOPS Business NAICS classification: AUTOMOTIVE BODY, PAINT, AND INTERIOR REPAIR AND MAINTENANCE. Organizations: KEVIN SCHWARTZ (CONTACT/OWNER)
JENKINS NISSAN (4315 US 98 N in LAKELAND, FL)
STATE MASTER (FDM) - CHAZ-FLD981754690, HAZARDOUS WASTE REGULATION PROGRAM (Resource Conservation and Recovery Act (tracking hazardous waste)) Business SIC classification: MOTOR VEHICLE DEALERS (USED ONLY); AUTOMOTIVE SERVICES, EXCEPT REPAIR AND CARWASHES Business NAICS classification: ALL OTHER AUTOMOTIVE REPAIR AND MAINTENANCE. Organizations: JAMES JENKINS (CONTACT/OWNER)
Alternative names: WEDGEWOOD ACURA
LAKE GIBSON SENIOR HIGH SCHOOL (7007 N SOCRUM LOOP RD in LAKELAND, FL)
(Geographic Names Information System) (National Center for Education Statistics) - STATE ID-1762 Organizations: POLK COUNTY SCHOOL DISTRICT (SCHOOL DISTRICT)
PET SUPERMARKET, INC. (3523 U.S. HWY 98 N in LAKELAND, FL)
(Integrated Compliance Information System) - ICIS-04-2001-3017, FORMAL ENFORCEMENT ACTION, ICIS-04-2000-0074, ICIS-04-2001-3017, COMPLIANCE ACTIVITY (Tracking inspections of insecticide, fungicide, and rodenticide, and toxic substances) Business SIC classification: MISCELLANEOUS RETAIL STORES
ARC - ACADEMIC RESEARCH CENTER (7007 NORTH SOCRUM LOOP RD in LAKELAND, FL)
(National Center for Education Statistics) - STATE ID-1763 Organizations: POLK COUNTY SCHOOL DISTRICT (SCHOOL DISTRICT)
CREATIVE COACH (8250 SR 33 N in LAKELAND, FL)
National Pollutant Discharge Elimination System NON-MAJOR (Tracking pollutant discharge elimination systems) - permit (Resource Conservation and Recovery Act (tracking hazardous waste)) Business NAICS classification: AUTOMOTIVE BODY, PAINT, AND INTERIOR REPAIR AND MAINTENANCE. Organizations: KEITH C ROBIN ARONOFF (CONTACT/OWNER)
, KEITH ARONOFF (CONTACT/OWNER)
LAKE GIBSON MIDDLE SCHOOL (6901 N SOCRUM LOOP RD in LAKELAND, FL)
(National Center for Education Statistics) - STATE ID-1761 Organizations: POLK COUNTY SCHOOL DISTRICT (SCHOOL DISTRICT)
SOCRUM ELEMENTARY SCHOOL (9400 OLD DADE CITY RD in LAKELAND, FL)
(National Center for Education Statistics) - STATE ID-1901 Organizations: POLK COUNTY SCHOOL DISTRICT (SCHOOL DISTRICT)
HUNTINGTON RIDGE (DUFF RD in LAKELAND, FL)
National Pollutant Discharge Elimination System NON-MAJOR (Tracking pollutant discharge elimination systems) - permit National Pollutant Discharge Elimination System NON-MAJOR (Tracking pollutant discharge elimination systems) - permit Alternative names: CLARANCE SOCIA
Housing units lacking complete plumbing facilities: 0.4% Housing units lacking complete kitchen facilities: 0.7%
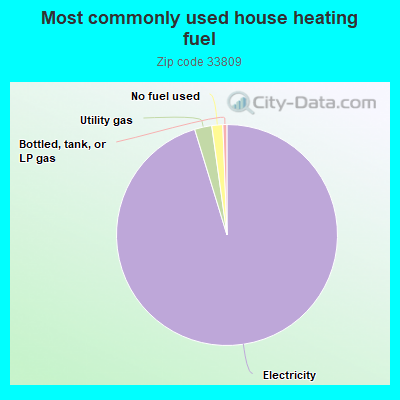
95.1%Electricity
2.5%Utility gas
1.6%No fuel used
0.6%Bottled, tank, or LP gas
Population in 1990: 39,958.
Place of birth for U.S.-born residents:
This state: 12,941
Northeast: 4,769
Midwest: 4,529
South: 3,107
West: 886
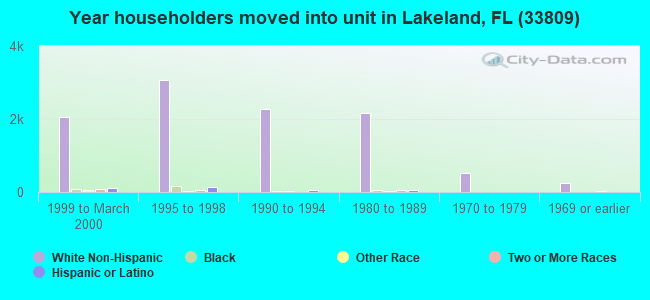
50% of the 33809 zip code residents lived in the same house 5 years ago. Out of people who lived in different houses, 56% lived in this county. Out of people who lived in different counties, 50% lived in Florida.
87% of the 33809 zip code residents lived in the same house 1 year ago. Out of people who lived in different houses, 49% moved from this county. Out of people who lived in different houses, 18% moved from different county within same state. Out of people who lived in different houses, 25% moved from different state. Out of people who lived in different houses, 5% moved from abroad.
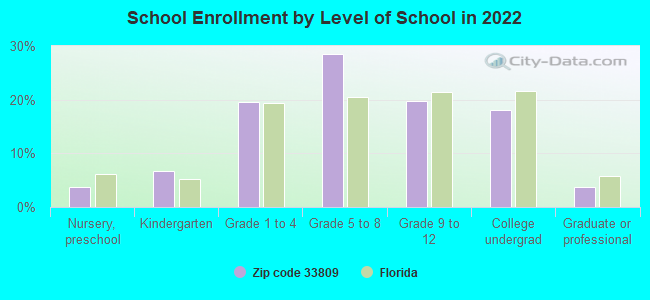
Private vs. public school enrollment:
Students in private schools in grades 1 to 8 (elementary and middle school): 517
Here:
16.1%
Florida:
15.8%
Students in private schools in grades 9 to 12 (high school): 275
Here:
20.8%
Florida:
12.9%
Students in private undergraduate colleges: 205
Here:
17.1%
Florida:
23.6%
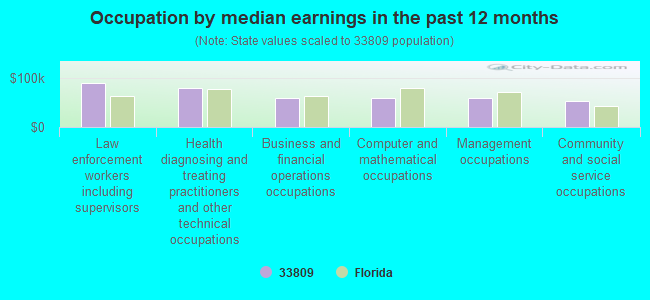
Occupation by median earnings in the past 12 months ($)
90,127Law enforcement workers including supervisors
79,157Health diagnosing and treating practitioners and other technical occupations
59,887Business and financial operations occupations
59,690Computer and mathematical occupations
59,227Management occupations
53,666Community and social service occupations
Companies with federal contracts located in this zip code:
LAKELAND WELLESLEY INN (3520 US HIGHWAY 98 N in LAKELAND, FL; small business) : $17,883 in 4 contractsfrom 2003 to 2004
$17,346 with Army for Lodging - Hotel/Motel. Signed on 2003-02-28. Completion date: 2003-02-09.
$301, same as above.Signed on 2004-02-19. Completion date: 2003-02-28.
$236, same as above.Signed on 2003-04-08. Completion date: 2003-02-09.
$0, same as above.Signed on 2004-02-19. Completion date: 2003-02-28.
Top industries in this zip code by the number of employees in 2005:
2004 - 2018 National Fire Incident Reporting System (NFIRS) incidents
According to the data from the years 2004 - 2018 the average number of fires per year is 78. The highest number of reported fire incidents - 127 took place in 2017, and the least - 16 in 2004. The data has a rising trend.
When looking into fire subcategories, the most reports belonged to: Outside Fires (46.7%), and Structure Fires (32.3%).
Fire incident types reported to NFIRS in Zip Code 33809


 Nearest zip codes: 33849, 33810, 33805, 33868, 33540, 33815.
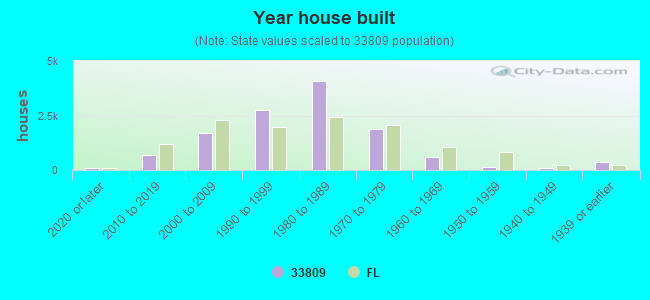


 According to the data from the years 2004 - 2018 the average number of fires per year is 78. The highest number of reported fire incidents - 127 took place in 2017, and the least - 16 in 2004. The data has a rising trend.
 When looking into fire subcategories, the most reports belonged to: Outside Fires (46.7%), and Structure Fires (32.3%).