Cities: Crystal Springs, FL (16.06%) ,
Zephyrhills, FL (3.20%) ,
Zephyrhills North, FL (0.36%) ,
Pasadena Hills, FL (0.10%) Counties: Pasco County, FL (89.13%) ,
Hillsborough County, FL (10.87%) Estimated zip code population in 2022: 10,572
Zip code population in 2010: 8,752
Zip code population in 2000: 18,837
Houses and condos: 5,537
Renter-occupied apartments: 802
% of renters here:
17%State:
33%
March 2022 cost of living index in zip code 33540: 95.2
(near average, U.S. average is 100)
Land area: 35.0
sq. mi.
Water area: 0.1
sq. mi.
Population density: 302 people per square mile (very low).
OSM Map
General Map
Google Map
MSN Map
OSM Map
General Map
Google Map
MSN Map
OSM Map
General Map
Google Map
MSN Map
OSM Map
General Map
Google Map
MSN Map
Please wait while loading the map...
Real estate property taxes paid for housing units in 2022:
This zip code:
0.8% ($1,067)Florida:
0.7% ($2,529)
Median real estate property taxes paid for housing units with mortgages in 2022: $1,622 (0.7%)
Median real estate property taxes paid for housing units with no mortgage in 2022: $776 (0.8%)
Profiles of local businesses
Business Search - 14 Million verified businesses
Males: 5,249 Females: 5,322
For population 25 years and over in 33540:
High school or higher: 84.7%Bachelor's degree or higher: 15.4%Graduate or professional degree: 5.1%Unemployed: 5.8%Mean travel time to work (commute): 29.4 minutes
For population 15 years and over in 33540:
Never married: 20.0%Now married: 51.5%Separated: 1.3%Widowed: 12.1%Divorced: 15.2%
Zip code 33540 compared to state average:
Median house value significantly below state average. Black race population percentage significantly below state average. Hispanic race population percentage below state average. Median age significantly above state average. Foreign-born population percentage significantly below state average. Renting percentage below state average. Percentage of population with a bachelor's degree or higher below state average. 8,693 82.3% White 1,340 12.7% Hispanic or Latino 318 3.0% Black 135 1.3% Two or more races 57 0.5% Asian 16 0.2% Some other race 9 0.09% American Indian
Data:
Median household income ($)
Median household income (% change since 2000)
Household income diversity
Ratio of average income to average house value (%)
Ratio of average income to average rent
Median household income ($) - White
Median household income ($) - Black or African American
Median household income ($) - Asian
Median household income ($) - Hispanic or Latino
Median household income ($) - American Indian and Alaska Native
Median household income ($) - Multirace
Median household income ($) - Other Race
Median household income for houses/condos with a mortgage ($)
Median household income for apartments without a mortgage ($)
Races - White alone (%)
Races - White alone (% change since 2000)
Races - Black alone (%)
Races - Black alone (% change since 2000)
Races - American Indian alone (%)
Races - American Indian alone (% change since 2000)
Races - Asian alone (%)
Races - Asian alone (% change since 2000)
Races - Hispanic (%)
Races - Hispanic (% change since 2000)
Races - Native Hawaiian and Other Pacific Islander alone (%)
Races - Native Hawaiian and Other Pacific Islander alone (% change since 2000)
Races - Two or more races (%)
Races - Two or more races (% change since 2000)
Races - Other race alone (%)
Races - Other race alone (% change since 2000)
Racial diversity
Unemployment (%)
Unemployment (% change since 2000)
Unemployment (%) - White
Unemployment (%) - Black or African American
Unemployment (%) - Asian
Unemployment (%) - Hispanic or Latino
Unemployment (%) - American Indian and Alaska Native
Unemployment (%) - Multirace
Unemployment (%) - Other Race
Population density (people per square mile)
Population - Males (%)
Population - Females (%)
Population - Males (%) - White
Population - Males (%) - Black or African American
Population - Males (%) - Asian
Population - Males (%) - Hispanic or Latino
Population - Males (%) - American Indian and Alaska Native
Population - Males (%) - Multirace
Population - Males (%) - Other Race
Population - Females (%) - White
Population - Females (%) - Black or African American
Population - Females (%) - Asian
Population - Females (%) - Hispanic or Latino
Population - Females (%) - American Indian and Alaska Native
Population - Females (%) - Multirace
Population - Females (%) - Other Race
Coronavirus confirmed cases (Apr 27, 2024)
Deaths caused by coronavirus (Apr 27, 2024)
Coronavirus confirmed cases (per 100k population) (Apr 27, 2024)
Deaths caused by coronavirus (per 100k population) (Apr 27, 2024)
Daily increase in number of cases (Apr 27, 2024)
Weekly increase in number of cases (Apr 27, 2024)
Cases doubled (in days) (Apr 27, 2024)
Hospitalized patients (Apr 18, 2022)
Negative test results (Apr 18, 2022)
Total test results (Apr 18, 2022)
COVID Vaccine doses distributed (per 100k population) (Sep 19, 2023)
COVID Vaccine doses administered (per 100k population) (Sep 19, 2023)
COVID Vaccine doses distributed (Sep 19, 2023)
COVID Vaccine doses administered (Sep 19, 2023)
Likely homosexual households (%)
Likely homosexual households (% change since 2000)
Likely homosexual households - Lesbian couples (%)
Likely homosexual households - Lesbian couples (% change since 2000)
Likely homosexual households - Gay men (%)
Likely homosexual households - Gay men (% change since 2000)
Cost of living index
Median gross rent ($)
Median contract rent ($)
Median monthly housing costs ($)
Median house or condo value ($)
Median house or condo value ($ change since 2000)
Mean house or condo value by units in structure - 1, detached ($)
Mean house or condo value by units in structure - 1, attached ($)
Mean house or condo value by units in structure - 2 ($)
Mean house or condo value by units in structure by units in structure - 3 or 4 ($)
Mean house or condo value by units in structure - 5 or more ($)
Mean house or condo value by units in structure - Boat, RV, van, etc. ($)
Mean house or condo value by units in structure - Mobile home ($)
Median house or condo value ($) - White
Median house or condo value ($) - Black or African American
Median house or condo value ($) - Asian
Median house or condo value ($) - Hispanic or Latino
Median house or condo value ($) - American Indian and Alaska Native
Median house or condo value ($) - Multirace
Median house or condo value ($) - Other Race
Median resident age
Resident age diversity
Median resident age - Males
Median resident age - Females
Median resident age - White
Median resident age - Black or African American
Median resident age - Asian
Median resident age - Hispanic or Latino
Median resident age - American Indian and Alaska Native
Median resident age - Multirace
Median resident age - Other Race
Median resident age - Males - White
Median resident age - Males - Black or African American
Median resident age - Males - Asian
Median resident age - Males - Hispanic or Latino
Median resident age - Males - American Indian and Alaska Native
Median resident age - Males - Multirace
Median resident age - Males - Other Race
Median resident age - Females - White
Median resident age - Females - Black or African American
Median resident age - Females - Asian
Median resident age - Females - Hispanic or Latino
Median resident age - Females - American Indian and Alaska Native
Median resident age - Females - Multirace
Median resident age - Females - Other Race
Commute - mean travel time to work (minutes)
Travel time to work - Less than 5 minutes (%)
Travel time to work - Less than 5 minutes (% change since 2000)
Travel time to work - 5 to 9 minutes (%)
Travel time to work - 5 to 9 minutes (% change since 2000)
Travel time to work - 10 to 19 minutes (%)
Travel time to work - 10 to 19 minutes (% change since 2000)
Travel time to work - 20 to 29 minutes (%)
Travel time to work - 20 to 29 minutes (% change since 2000)
Travel time to work - 30 to 39 minutes (%)
Travel time to work - 30 to 39 minutes (% change since 2000)
Travel time to work - 40 to 59 minutes (%)
Travel time to work - 40 to 59 minutes (% change since 2000)
Travel time to work - 60 to 89 minutes (%)
Travel time to work - 60 to 89 minutes (% change since 2000)
Travel time to work - 90 or more minutes (%)
Travel time to work - 90 or more minutes (% change since 2000)
Marital status - Never married (%)
Marital status - Now married (%)
Marital status - Separated (%)
Marital status - Widowed (%)
Marital status - Divorced (%)
Median family income ($)
Median family income (% change since 2000)
Median non-family income ($)
Median non-family income (% change since 2000)
Median per capita income ($)
Median per capita income (% change since 2000)
Median family income ($) - White
Median family income ($) - Black or African American
Median family income ($) - Asian
Median family income ($) - Hispanic or Latino
Median family income ($) - American Indian and Alaska Native
Median family income ($) - Multirace
Median family income ($) - Other Race
Median year house/condo built
Median year apartment built
Year house built - Built 2005 or later (%)
Year house built - Built 2000 to 2004 (%)
Year house built - Built 1990 to 1999 (%)
Year house built - Built 1980 to 1989 (%)
Year house built - Built 1970 to 1979 (%)
Year house built - Built 1960 to 1969 (%)
Year house built - Built 1950 to 1959 (%)
Year house built - Built 1940 to 1949 (%)
Year house built - Built 1939 or earlier (%)
Average household size
Household density (households per square mile)
Average household size - White
Average household size - Black or African American
Average household size - Asian
Average household size - Hispanic or Latino
Average household size - American Indian and Alaska Native
Average household size - Multirace
Average household size - Other Race
Occupied housing units (%)
Vacant housing units (%)
Owner occupied housing units (%)
Renter occupied housing units (%)
Vacancy status - For rent (%)
Vacancy status - For sale only (%)
Vacancy status - Rented or sold, not occupied (%)
Vacancy status - For seasonal, recreational, or occasional use (%)
Vacancy status - For migrant workers (%)
Vacancy status - Other vacant (%)
Residents with income below the poverty level (%)
Residents with income below 50% of the poverty level (%)
Children below poverty level (%)
Poor families by family type - Married-couple family (%)
Poor families by family type - Male, no wife present (%)
Poor families by family type - Female, no husband present (%)
Poverty status for native-born residents (%)
Poverty status for foreign-born residents (%)
Poverty among high school graduates not in families (%)
Poverty among people who did not graduate high school not in families (%)
Residents with income below the poverty level (%) - White
Residents with income below the poverty level (%) - Black or African American
Residents with income below the poverty level (%) - Asian
Residents with income below the poverty level (%) - Hispanic or Latino
Residents with income below the poverty level (%) - American Indian and Alaska Native
Residents with income below the poverty level (%) - Multirace
Residents with income below the poverty level (%) - Other Race
Air pollution - Air Quality Index (AQI)
Air pollution - CO
Air pollution - NO2
Air pollution - SO2
Air pollution - Ozone
Air pollution - PM10
Air pollution - PM25
Air pollution - Pb
Crime - Murders per 100,000 population
Crime - Rapes per 100,000 population
Crime - Robberies per 100,000 population
Crime - Assaults per 100,000 population
Crime - Burglaries per 100,000 population
Crime - Thefts per 100,000 population
Crime - Auto thefts per 100,000 population
Crime - Arson per 100,000 population
Crime - City-data.com crime index
Crime - Violent crime index
Crime - Property crime index
Crime - Murders per 100,000 population (5 year average)
Crime - Rapes per 100,000 population (5 year average)
Crime - Robberies per 100,000 population (5 year average)
Crime - Assaults per 100,000 population (5 year average)
Crime - Burglaries per 100,000 population (5 year average)
Crime - Thefts per 100,000 population (5 year average)
Crime - Auto thefts per 100,000 population (5 year average)
Crime - Arson per 100,000 population (5 year average)
Crime - City-data.com crime index (5 year average)
Crime - Violent crime index (5 year average)
Crime - Property crime index (5 year average)
1996 Presidential Elections Results (%) - Democratic Party (Clinton)
1996 Presidential Elections Results (%) - Republican Party (Dole)
1996 Presidential Elections Results (%) - Other
2000 Presidential Elections Results (%) - Democratic Party (Gore)
2000 Presidential Elections Results (%) - Republican Party (Bush)
2000 Presidential Elections Results (%) - Other
2004 Presidential Elections Results (%) - Democratic Party (Kerry)
2004 Presidential Elections Results (%) - Republican Party (Bush)
2004 Presidential Elections Results (%) - Other
2008 Presidential Elections Results (%) - Democratic Party (Obama)
2008 Presidential Elections Results (%) - Republican Party (McCain)
2008 Presidential Elections Results (%) - Other
2012 Presidential Elections Results (%) - Democratic Party (Obama)
2012 Presidential Elections Results (%) - Republican Party (Romney)
2012 Presidential Elections Results (%) - Other
2016 Presidential Elections Results (%) - Democratic Party (Clinton)
2016 Presidential Elections Results (%) - Republican Party (Trump)
2016 Presidential Elections Results (%) - Other
2020 Presidential Elections Results (%) - Democratic Party (Biden)
2020 Presidential Elections Results (%) - Republican Party (Trump)
2020 Presidential Elections Results (%) - Other
Ancestries Reported - Arab (%)
Ancestries Reported - Czech (%)
Ancestries Reported - Danish (%)
Ancestries Reported - Dutch (%)
Ancestries Reported - English (%)
Ancestries Reported - French (%)
Ancestries Reported - French Canadian (%)
Ancestries Reported - German (%)
Ancestries Reported - Greek (%)
Ancestries Reported - Hungarian (%)
Ancestries Reported - Irish (%)
Ancestries Reported - Italian (%)
Ancestries Reported - Lithuanian (%)
Ancestries Reported - Norwegian (%)
Ancestries Reported - Polish (%)
Ancestries Reported - Portuguese (%)
Ancestries Reported - Russian (%)
Ancestries Reported - Scotch-Irish (%)
Ancestries Reported - Scottish (%)
Ancestries Reported - Slovak (%)
Ancestries Reported - Subsaharan African (%)
Ancestries Reported - Swedish (%)
Ancestries Reported - Swiss (%)
Ancestries Reported - Ukrainian (%)
Ancestries Reported - United States (%)
Ancestries Reported - Welsh (%)
Ancestries Reported - West Indian (%)
Ancestries Reported - Other (%)
Educational Attainment - No schooling completed (%)
Educational Attainment - Less than high school (%)
Educational Attainment - High school or equivalent (%)
Educational Attainment - Less than 1 year of college (%)
Educational Attainment - 1 or more years of college (%)
Educational Attainment - Associate degree (%)
Educational Attainment - Bachelor's degree (%)
Educational Attainment - Master's degree (%)
Educational Attainment - Professional school degree (%)
Educational Attainment - Doctorate degree (%)
School Enrollment - Nursery, preschool (%)
School Enrollment - Kindergarten (%)
School Enrollment - Grade 1 to 4 (%)
School Enrollment - Grade 5 to 8 (%)
School Enrollment - Grade 9 to 12 (%)
School Enrollment - College undergrad (%)
School Enrollment - Graduate or professional (%)
School Enrollment - Not enrolled in school (%)
School enrollment - Public schools (%)
School enrollment - Private schools (%)
School enrollment - Not enrolled (%)
Median number of rooms in houses and condos
Median number of rooms in apartments
Housing units lacking complete plumbing facilities (%)
Housing units lacking complete kitchen facilities (%)
Density of houses
Urban houses (%)
Rural houses (%)
Households with people 60 years and over (%)
Households with people 65 years and over (%)
Households with people 75 years and over (%)
Households with one or more nonrelatives (%)
Households with no nonrelatives (%)
Population in households (%)
Family households (%)
Nonfamily households (%)
Population in families (%)
Family households with own children (%)
Median number of bedrooms in owner occupied houses
Mean number of bedrooms in owner occupied houses
Median number of bedrooms in renter occupied houses
Mean number of bedrooms in renter occupied houses
Median number of vehichles in owner occupied houses
Mean number of vehichles in owner occupied houses
Median number of vehichles in renter occupied houses
Mean number of vehichles in renter occupied houses
Mortgage status - with mortgage (%)
Mortgage status - with second mortgage (%)
Mortgage status - with home equity loan (%)
Mortgage status - with both second mortgage and home equity loan (%)
Mortgage status - without a mortgage (%)
Average family size
Average family size - White
Average family size - Black or African American
Average family size - Asian
Average family size - Hispanic or Latino
Average family size - American Indian and Alaska Native
Average family size - Multirace
Average family size - Other Race
Geographical mobility - Same house 1 year ago (%)
Geographical mobility - Moved within same county (%)
Geographical mobility - Moved from different county within same state (%)
Geographical mobility - Moved from different state (%)
Geographical mobility - Moved from abroad (%)
Place of birth - Born in state of residence (%)
Place of birth - Born in other state (%)
Place of birth - Native, outside of US (%)
Place of birth - Foreign born (%)
Housing units in structures - 1, detached (%)
Housing units in structures - 1, attached (%)
Housing units in structures - 2 (%)
Housing units in structures - 3 or 4 (%)
Housing units in structures - 5 to 9 (%)
Housing units in structures - 10 to 19 (%)
Housing units in structures - 20 to 49 (%)
Housing units in structures - 50 or more (%)
Housing units in structures - Mobile home (%)
Housing units in structures - Boat, RV, van, etc. (%)
House/condo owner moved in on average (years ago)
Renter moved in on average (years ago)
Year householder moved into unit - Moved in 1999 to March 2000 (%)
Year householder moved into unit - Moved in 1995 to 1998 (%)
Year householder moved into unit - Moved in 1990 to 1994 (%)
Year householder moved into unit - Moved in 1980 to 1989 (%)
Year householder moved into unit - Moved in 1970 to 1979 (%)
Year householder moved into unit - Moved in 1969 or earlier (%)
Means of transportation to work - Drove car alone (%)
Means of transportation to work - Carpooled (%)
Means of transportation to work - Public transportation (%)
Means of transportation to work - Bus or trolley bus (%)
Means of transportation to work - Streetcar or trolley car (%)
Means of transportation to work - Subway or elevated (%)
Means of transportation to work - Railroad (%)
Means of transportation to work - Ferryboat (%)
Means of transportation to work - Taxicab (%)
Means of transportation to work - Motorcycle (%)
Means of transportation to work - Bicycle (%)
Means of transportation to work - Walked (%)
Means of transportation to work - Other means (%)
Working at home (%)
Industry diversity
Most Common Industries - Agriculture, forestry, fishing and hunting, and mining (%)
Most Common Industries - Agriculture, forestry, fishing and hunting (%)
Most Common Industries - Mining, quarrying, and oil and gas extraction (%)
Most Common Industries - Construction (%)
Most Common Industries - Manufacturing (%)
Most Common Industries - Wholesale trade (%)
Most Common Industries - Retail trade (%)
Most Common Industries - Transportation and warehousing, and utilities (%)
Most Common Industries - Transportation and warehousing (%)
Most Common Industries - Utilities (%)
Most Common Industries - Information (%)
Most Common Industries - Finance and insurance, and real estate and rental and leasing (%)
Most Common Industries - Finance and insurance (%)
Most Common Industries - Real estate and rental and leasing (%)
Most Common Industries - Professional, scientific, and management, and administrative and waste management services (%)
Most Common Industries - Professional, scientific, and technical services (%)
Most Common Industries - Management of companies and enterprises (%)
Most Common Industries - Administrative and support and waste management services (%)
Most Common Industries - Educational services, and health care and social assistance (%)
Most Common Industries - Educational services (%)
Most Common Industries - Health care and social assistance (%)
Most Common Industries - Arts, entertainment, and recreation, and accommodation and food services (%)
Most Common Industries - Arts, entertainment, and recreation (%)
Most Common Industries - Accommodation and food services (%)
Most Common Industries - Other services, except public administration (%)
Most Common Industries - Public administration (%)
Occupation diversity
Most Common Occupations - Management, business, science, and arts occupations (%)
Most Common Occupations - Management, business, and financial occupations (%)
Most Common Occupations - Management occupations (%)
Most Common Occupations - Business and financial operations occupations (%)
Most Common Occupations - Computer, engineering, and science occupations (%)
Most Common Occupations - Computer and mathematical occupations (%)
Most Common Occupations - Architecture and engineering occupations (%)
Most Common Occupations - Life, physical, and social science occupations (%)
Most Common Occupations - Education, legal, community service, arts, and media occupations (%)
Most Common Occupations - Community and social service occupations (%)
Most Common Occupations - Legal occupations (%)
Most Common Occupations - Education, training, and library occupations (%)
Most Common Occupations - Arts, design, entertainment, sports, and media occupations (%)
Most Common Occupations - Healthcare practitioners and technical occupations (%)
Most Common Occupations - Health diagnosing and treating practitioners and other technical occupations (%)
Most Common Occupations - Health technologists and technicians (%)
Most Common Occupations - Service occupations (%)
Most Common Occupations - Healthcare support occupations (%)
Most Common Occupations - Protective service occupations (%)
Most Common Occupations - Fire fighting and prevention, and other protective service workers including supervisors (%)
Most Common Occupations - Law enforcement workers including supervisors (%)
Most Common Occupations - Food preparation and serving related occupations (%)
Most Common Occupations - Building and grounds cleaning and maintenance occupations (%)
Most Common Occupations - Personal care and service occupations (%)
Most Common Occupations - Sales and office occupations (%)
Most Common Occupations - Sales and related occupations (%)
Most Common Occupations - Office and administrative support occupations (%)
Most Common Occupations - Natural resources, construction, and maintenance occupations (%)
Most Common Occupations - Farming, fishing, and forestry occupations (%)
Most Common Occupations - Construction and extraction occupations (%)
Most Common Occupations - Installation, maintenance, and repair occupations (%)
Most Common Occupations - Production, transportation, and material moving occupations (%)
Most Common Occupations - Production occupations (%)
Most Common Occupations - Transportation occupations (%)
Most Common Occupations - Material moving occupations (%)
People in Group quarters - Institutionalized population (%)
People in Group quarters - Correctional institutions (%)
People in Group quarters - Federal prisons and detention centers (%)
People in Group quarters - Halfway houses (%)
People in Group quarters - Local jails and other confinement facilities (including police lockups) (%)
People in Group quarters - Military disciplinary barracks (%)
People in Group quarters - State prisons (%)
People in Group quarters - Other types of correctional institutions (%)
People in Group quarters - Nursing homes (%)
People in Group quarters - Hospitals/wards, hospices, and schools for the handicapped (%)
People in Group quarters - Hospitals/wards and hospices for chronically ill (%)
People in Group quarters - Hospices or homes for chronically ill (%)
People in Group quarters - Military hospitals or wards for chronically ill (%)
People in Group quarters - Other hospitals or wards for chronically ill (%)
People in Group quarters - Hospitals or wards for drug/alcohol abuse (%)
People in Group quarters - Mental (Psychiatric) hospitals or wards (%)
People in Group quarters - Schools, hospitals, or wards for the mentally retarded (%)
People in Group quarters - Schools, hospitals, or wards for the physically handicapped (%)
People in Group quarters - Institutions for the deaf (%)
People in Group quarters - Institutions for the blind (%)
People in Group quarters - Orthopedic wards and institutions for the physically handicapped (%)
People in Group quarters - Wards in general hospitals for patients who have no usual home elsewhere (%)
People in Group quarters - Wards in military hospitals for patients who have no usual home elsewhere (%)
People in Group quarters - Juvenile institutions (%)
People in Group quarters - Long-term care (%)
People in Group quarters - Homes for abused, dependent, and neglected children (%)
People in Group quarters - Residential treatment centers for emotionally disturbed children (%)
People in Group quarters - Training schools for juvenile delinquents (%)
People in Group quarters - Short-term care, detention or diagnostic centers for delinquent children (%)
People in Group quarters - Type of juvenile institution unknown (%)
People in Group quarters - Noninstitutionalized population (%)
People in Group quarters - College dormitories (includes college quarters off campus) (%)
People in Group quarters - Military quarters (%)
People in Group quarters - On base (%)
People in Group quarters - Barracks, unaccompanied personnel housing (UPH), (Enlisted/Officer), ;and similar group living quarters for military personnel (%)
People in Group quarters - Transient quarters for temporary residents (%)
People in Group quarters - Military ships (%)
People in Group quarters - Group homes (%)
People in Group quarters - Homes or halfway houses for drug/alcohol abuse (%)
People in Group quarters - Homes for the mentally ill (%)
People in Group quarters - Homes for the mentally retarded (%)
People in Group quarters - Homes for the physically handicapped (%)
People in Group quarters - Other group homes (%)
People in Group quarters - Religious group quarters (%)
People in Group quarters - Dormitories (%)
People in Group quarters - Agriculture workers' dormitories on farms (%)
People in Group quarters - Job Corps and vocational training facilities (%)
People in Group quarters - Other workers' dormitories (%)
People in Group quarters - Crews of maritime vessels (%)
People in Group quarters - Other nonhousehold living situations (%)
People in Group quarters - Other noninstitutional group quarters (%)
Residents speaking English at home (%)
Residents speaking English at home - Born in the United States (%)
Residents speaking English at home - Native, born elsewhere (%)
Residents speaking English at home - Foreign born (%)
Residents speaking Spanish at home (%)
Residents speaking Spanish at home - Born in the United States (%)
Residents speaking Spanish at home - Native, born elsewhere (%)
Residents speaking Spanish at home - Foreign born (%)
Residents speaking other language at home (%)
Residents speaking other language at home - Born in the United States (%)
Residents speaking other language at home - Native, born elsewhere (%)
Residents speaking other language at home - Foreign born (%)
Class of Workers - Employee of private company (%)
Class of Workers - Self-employed in own incorporated business (%)
Class of Workers - Private not-for-profit wage and salary workers (%)
Class of Workers - Local government workers (%)
Class of Workers - State government workers (%)
Class of Workers - Federal government workers (%)
Class of Workers - Self-employed workers in own not incorporated business and Unpaid family workers (%)
House heating fuel used in houses and condos - Utility gas (%)
House heating fuel used in houses and condos - Bottled, tank, or LP gas (%)
House heating fuel used in houses and condos - Electricity (%)
House heating fuel used in houses and condos - Fuel oil, kerosene, etc. (%)
House heating fuel used in houses and condos - Coal or coke (%)
House heating fuel used in houses and condos - Wood (%)
House heating fuel used in houses and condos - Solar energy (%)
House heating fuel used in houses and condos - Other fuel (%)
House heating fuel used in houses and condos - No fuel used (%)
House heating fuel used in apartments - Utility gas (%)
House heating fuel used in apartments - Bottled, tank, or LP gas (%)
House heating fuel used in apartments - Electricity (%)
House heating fuel used in apartments - Fuel oil, kerosene, etc. (%)
House heating fuel used in apartments - Coal or coke (%)
House heating fuel used in apartments - Wood (%)
House heating fuel used in apartments - Solar energy (%)
House heating fuel used in apartments - Other fuel (%)
House heating fuel used in apartments - No fuel used (%)
Armed forces status - In Armed Forces (%)
Armed forces status - Civilian (%)
Armed forces status - Civilian - Veteran (%)
Armed forces status - Civilian - Nonveteran (%)
Fatal accidents locations in years 2005-2021
Fatal accidents locations in 2005
Fatal accidents locations in 2006
Fatal accidents locations in 2007
Fatal accidents locations in 2008
Fatal accidents locations in 2009
Fatal accidents locations in 2010
Fatal accidents locations in 2011
Fatal accidents locations in 2012
Fatal accidents locations in 2013
Fatal accidents locations in 2014
Fatal accidents locations in 2015
Fatal accidents locations in 2016
Fatal accidents locations in 2017
Fatal accidents locations in 2018
Fatal accidents locations in 2019
Fatal accidents locations in 2020
Fatal accidents locations in 2021
Alcohol use - People drinking some alcohol every month (%)
Alcohol use - People not drinking at all (%)
Alcohol use - Average days/month drinking alcohol
Alcohol use - Average drinks/week
Alcohol use - Average days/year people drink much
Audiometry - Average condition of hearing (%)
Audiometry - People that can hear a whisper from across a quiet room (%)
Audiometry - People that can hear normal voice from across a quiet room (%)
Audiometry - Ears ringing, roaring, buzzing (%)
Audiometry - Had a job exposure to loud noise (%)
Audiometry - Had off-work exposure to loud noise (%)
Blood Pressure & Cholesterol - Has high blood pressure (%)
Blood Pressure & Cholesterol - Checking blood pressure at home (%)
Blood Pressure & Cholesterol - Frequently checking blood cholesterol (%)
Blood Pressure & Cholesterol - Has high cholesterol level (%)
Consumer Behavior - Money monthly spent on food at supermarket/grocery store
Consumer Behavior - Money monthly spent on food at other stores
Consumer Behavior - Money monthly spent on eating out
Consumer Behavior - Money monthly spent on carryout/delivered foods
Consumer Behavior - Income spent on food at supermarket/grocery store (%)
Consumer Behavior - Income spent on food at other stores (%)
Consumer Behavior - Income spent on eating out (%)
Consumer Behavior - Income spent on carryout/delivered foods (%)
Current Health Status - General health condition (%)
Current Health Status - Blood donors (%)
Current Health Status - Has blood ever tested for HIV virus (%)
Current Health Status - Left-handed people (%)
Dermatology - People using sunscreen (%)
Diabetes - Diabetics (%)
Diabetes - Had a blood test for high blood sugar (%)
Diabetes - People taking insulin (%)
Diet Behavior & Nutrition - Diet health (%)
Diet Behavior & Nutrition - Milk product consumption (# of products/month)
Diet Behavior & Nutrition - Meals not home prepared (#/week)
Diet Behavior & Nutrition - Meals from fast food or pizza place (#/week)
Diet Behavior & Nutrition - Ready-to-eat foods (#/month)
Diet Behavior & Nutrition - Frozen meals/pizza (#/month)
Drug Use - People that ever used marijuana or hashish (%)
Drug Use - Ever used hard drugs (%)
Drug Use - Ever used any form of cocaine (%)
Drug Use - Ever used heroin (%)
Drug Use - Ever used methamphetamine (%)
Health Insurance - People covered by health insurance (%)
Kidney Conditions-Urology - Avg. # of times urinating at night
Medical Conditions - People with asthma (%)
Medical Conditions - People with anemia (%)
Medical Conditions - People with psoriasis (%)
Medical Conditions - People with overweight (%)
Medical Conditions - Elderly people having difficulties in thinking or remembering (%)
Medical Conditions - People who ever received blood transfusion (%)
Medical Conditions - People having trouble seeing even with glass/contacts (%)
Medical Conditions - People with arthritis (%)
Medical Conditions - People with gout (%)
Medical Conditions - People with congestive heart failure (%)
Medical Conditions - People with coronary heart disease (%)
Medical Conditions - People with angina pectoris (%)
Medical Conditions - People who ever had heart attack (%)
Medical Conditions - People who ever had stroke (%)
Medical Conditions - People with emphysema (%)
Medical Conditions - People with thyroid problem (%)
Medical Conditions - People with chronic bronchitis (%)
Medical Conditions - People with any liver condition (%)
Medical Conditions - People who ever had cancer or malignancy (%)
Mental Health - People who have little interest in doing things (%)
Mental Health - People feeling down, depressed, or hopeless (%)
Mental Health - People who have trouble sleeping or sleeping too much (%)
Mental Health - People feeling tired or having little energy (%)
Mental Health - People with poor appetite or overeating (%)
Mental Health - People feeling bad about themself (%)
Mental Health - People who have trouble concentrating on things (%)
Mental Health - People moving or speaking slowly or too fast (%)
Mental Health - People having thoughts they would be better off dead (%)
Oral Health - Average years since last visit a dentist
Oral Health - People embarrassed because of mouth (%)
Oral Health - People with gum disease (%)
Oral Health - General health of teeth and gums (%)
Oral Health - Average days a week using dental floss/device
Oral Health - Average days a week using mouthwash for dental problem
Oral Health - Average number of teeth
Pesticide Use - Households using pesticides to control insects (%)
Pesticide Use - Households using pesticides to kill weeds (%)
Physical Activity - People doing vigorous-intensity work activities (%)
Physical Activity - People doing moderate-intensity work activities (%)
Physical Activity - People walking or bicycling (%)
Physical Activity - People doing vigorous-intensity recreational activities (%)
Physical Activity - People doing moderate-intensity recreational activities (%)
Physical Activity - Average hours a day doing sedentary activities
Physical Activity - Average hours a day watching TV or videos
Physical Activity - Average hours a day using computer
Physical Functioning - People having limitations keeping them from working (%)
Physical Functioning - People limited in amount of work they can do (%)
Physical Functioning - People that need special equipment to walk (%)
Physical Functioning - People experiencing confusion/memory problems (%)
Physical Functioning - People requiring special healthcare equipment (%)
Prescription Medications - Average number of prescription medicines taking
Preventive Aspirin Use - Adults 40+ taking low-dose aspirin (%)
Reproductive Health - Vaginal deliveries (%)
Reproductive Health - Cesarean deliveries (%)
Reproductive Health - Deliveries resulted in a live birth (%)
Reproductive Health - Pregnancies resulted in a delivery (%)
Reproductive Health - Women breastfeeding newborns (%)
Reproductive Health - Women that had a hysterectomy (%)
Reproductive Health - Women that had both ovaries removed (%)
Reproductive Health - Women that have ever taken birth control pills (%)
Reproductive Health - Women taking birth control pills (%)
Reproductive Health - Women that have ever used Depo-Provera or injectables (%)
Reproductive Health - Women that have ever used female hormones (%)
Sexual Behavior - People 18+ that ever had sex (vaginal, anal, or oral) (%)
Sexual Behavior - Males 18+ that ever had vaginal sex with a woman (%)
Sexual Behavior - Males 18+ that ever performed oral sex on a woman (%)
Sexual Behavior - Males 18+ that ever had anal sex with a woman (%)
Sexual Behavior - Males 18+ that ever had any sex with a man (%)
Sexual Behavior - Females 18+ that ever had vaginal sex with a man (%)
Sexual Behavior - Females 18+ that ever performed oral sex on a man (%)
Sexual Behavior - Females 18+ that ever had anal sex with a man (%)
Sexual Behavior - Females 18+ that ever had any kind of sex with a woman (%)
Sexual Behavior - Average age people first had sex
Sexual Behavior - Average number of female sex partners in lifetime (males 18+)
Sexual Behavior - Average number of female vaginal sex partners in lifetime (males 18+)
Sexual Behavior - Average age people first performed oral sex on a woman (18+)
Sexual Behavior - Average number of woman performed oral sex on in lifetime (18+)
Sexual Behavior - Average number of male sex partners in lifetime (males 18+)
Sexual Behavior - Average number of male anal sex partners in lifetime (males 18+)
Sexual Behavior - Average age people first performed oral sex on a man (18+)
Sexual Behavior - Average number of male oral sex partners in lifetime (18+)
Sexual Behavior - People using protection when performing oral sex (%)
Sexual Behavior - Average number of times people have vaginal or anal sex a year
Sexual Behavior - People having sex without condom (%)
Sexual Behavior - Average number of male sex partners in lifetime (females 18+)
Sexual Behavior - Average number of male vaginal sex partners in lifetime (females 18+)
Sexual Behavior - Average number of female sex partners in lifetime (females 18+)
Sexual Behavior - Circumcised males 18+ (%)
Sleep Disorders - Average hours sleeping at night
Sleep Disorders - People that has trouble sleeping (%)
Smoking-Cigarette Use - People smoking cigarettes (%)
Taste & Smell - People 40+ having problems with smell (%)
Taste & Smell - People 40+ having problems with taste (%)
Taste & Smell - People 40+ that ever had wisdom teeth removed (%)
Taste & Smell - People 40+ that ever had tonsils teeth removed (%)
Taste & Smell - People 40+ that ever had a loss of consciousness because of a head injury (%)
Taste & Smell - People 40+ that ever had a broken nose or other serious injury to face or skull (%)
Taste & Smell - People 40+ that ever had two or more sinus infections (%)
Weight - Average height (inches)
Weight - Average weight (pounds)
Weight - Average BMI
Weight - People that are obese (%)
Weight - People that ever were obese (%)
Weight - People trying to lose weight (%)
Urban population: 9,438
Rural population: 1,133
Estimated median house/condo value in 2022: $138,271
33540:
$138,271Florida:
$354,100
Median resident age: This zip code:
56.7 yearsFlorida median age:
42.7 years
Average household size: This zip code:
2.2 peopleFlorida:
2.5 people
Averages for the 2020 tax year for zip code 33540, filed in 2021:
Average Adjusted Gross Income (AGI) in 2020: $46,338 (Individual Income Tax Returns) Here:
$46,338State:
$82,200
Salary/wage: $43,085 (reported on 76.5% of returns )Here:
$43,085State:
$58,347
(% of AGI for various income ranges: 1073.0% for AGIs below $25k , 3393.6% for AGIs $25k-50k , 6074.9% for AGIs $50k-75k , 8751.9% for AGIs $75k-100k , 14244.6% for AGIs $100k-200k ) Taxable interest for individuals: $879 (reported on 19.2% of returns )This zip code:
$879Florida:
$4,272
(% of AGI for various income ranges: 8.1% for AGIs below $25k , 12.3% for AGIs $25k-50k , 19.1% for AGIs $50k-75k , 55.8% for AGIs $75k-100k , 60.4% for AGIs $100k-200k ) Ordinary dividends: $3,614 (reported on 10.6% of returns )(% of AGI for various income ranges: 17.2% for AGIs below $25k , 17.5% for AGIs $25k-50k , 45.1% for AGIs $50k-75k , 108.5% for AGIs $75k-100k , 289.6% for AGIs $100k-200k ) Net capital gain/loss in AGI: +$9,589 (reported on 9.9% of returns )Here:
+$9,589State:
+$62,983
(% of AGI for various income ranges: 2.1% for AGIs below $25k , 23.0% for AGIs $25k-50k , 70.4% for AGIs $50k-75k , 215.4% for AGIs $75k-100k , 1138.9% for AGIs $100k-200k ) Profit/loss from business: +$3,720 (reported on 14.9% of returns )Here:
+$3,720State:
+$9,719
(% of AGI for various income ranges: 102.0% for AGIs below $25k , 108.5% for AGIs $25k-50k , 51.6% for AGIs $50k-75k ) Taxable individual retirement arrangement distribution: $15,651 (reported on 9.3% of returns )33540:
$15,651Florida:
$24,823
(% of AGI for various income ranges: 62.0% for AGIs below $25k , 95.8% for AGIs $25k-50k , 215.3% for AGIs $50k-75k , 421.5% for AGIs $75k-100k , 911.1% for AGIs $100k-200k ) Total itemized deductions: $31,955 (reported on 2.4% of returns )Here:
$31,955State:
$45,393
(% of AGI for various income ranges: 69.8% for AGIs $25k-50k , 180.4% for AGIs $50k-75k , 203.8% for AGIs $75k-100k , 445.0% for AGIs $100k-200k ) Charity contributions: $8,362 (reported on 1.7% of returns )(% of AGI for various income ranges: 57.1% for AGIs $50k-75k , 126.8% for AGIs $100k-200k ) Taxes paid: $5,782 (reported on 2.4% of returns )(% of AGI for various income ranges: 13.8% for AGIs $25k-50k , 44.0% for AGIs $50k-75k , 87.9% for AGIs $100k-200k ) Earned income credit: $2,386 (reported on 21.4% of returns )(% of AGI for various income ranges: 107.7% for AGIs below $25k , 78.8% for AGIs $25k-50k ) Percentage of individuals using paid preparers for their 2020 taxes: 93.5%(% for various income ranges: 92.7% for AGIs below $25k , 93.8% for AGIs $25k-50k , 94.4% for AGIs $50k-75k , 94.6% for AGIs $75k-100k , 92.9% for AGIs $100k-200k , 100.0% for AGIs over 200k )
Averages for the 2012 tax year for zip code 33540, filed in 2013:
Average Adjusted Gross Income (AGI) in 2012: $38,689 (Individual Income Tax Returns) Here:
$38,689State:
$60,316
Salary/wage: $34,170 (reported on 75.5% of returns )Here:
$34,170State:
$45,277
(% of AGI for various income ranges: 65.1% for AGIs below $25k , 68.2% for AGIs $25k-50k , 71.9% for AGIs $50k-75k , 69.8% for AGIs $75k-100k , 57.7% for AGIs $100k-200k ) Taxable interest for individuals: $1,681 (reported on 24.2% of returns )This zip code:
$1,681Florida:
$3,587
(% of AGI for various income ranges: 1.4% for AGIs below $25k , 0.7% for AGIs $25k-50k , 0.6% for AGIs $50k-75k , 0.6% for AGIs $75k-100k , 2.0% for AGIs $100k-200k ) Ordinary dividends: $7,810 (reported on 15.7% of returns )(% of AGI for various income ranges: 3.2% for AGIs below $25k , 7.0% for AGIs $25k-50k , 1.2% for AGIs $50k-75k , 1.3% for AGIs $75k-100k , 1.5% for AGIs $100k-200k ) Net capital gain/loss in AGI: +$2,647 (reported on 9.4% of returns )Here:
+$2,647State:
+$33,493
(% of AGI for various income ranges: 0.8% for AGIs $25k-50k , 0.6% for AGIs $50k-75k , 0.6% for AGIs $75k-100k , 1.1% for AGIs $100k-200k ) Profit/loss from business: +$6,848 (reported on 12.6% of returns )Here:
+$6,848State:
+$10,012
(% of AGI for various income ranges: 7.2% for AGIs below $25k , 1.6% for AGIs $25k-50k , 1.5% for AGIs $50k-75k , 0.6% for AGIs $75k-100k , 1.5% for AGIs $100k-200k ) Taxable individual retirement arrangement distribution: $13,384 (reported on 11.6% of returns )33540:
$13,384Florida:
$21,544
(% of AGI for various income ranges: 4.1% for AGIs below $25k , 2.4% for AGIs $25k-50k , 3.5% for AGIs $50k-75k , 4.5% for AGIs $75k-100k , 6.4% for AGIs $100k-200k ) Total itemized deductions: $17,787 (27% of AGI, reported on 14.2% of returns )Here:
$17,787State:
$25,533
Here:
26.6% of AGIState:
18.0% of AGI
(% of AGI for various income ranges: 4.0% for AGIs below $25k , 6.0% for AGIs $25k-50k , 8.1% for AGIs $50k-75k , 6.3% for AGIs $75k-100k , 7.5% for AGIs $100k-200k ) Charity contributions: $3,916 (reported on 10.1% of returns )(% of AGI for various income ranges: 0.2% for AGIs below $25k , 1.0% for AGIs $25k-50k , 1.2% for AGIs $50k-75k , 1.1% for AGIs $75k-100k , 1.3% for AGIs $100k-200k ) Taxes paid: $2,945 (reported on 13.8% of returns )(% of AGI for various income ranges: 0.5% for AGIs below $25k , 0.8% for AGIs $25k-50k , 1.2% for AGIs $50k-75k , 1.1% for AGIs $75k-100k , 1.7% for AGIs $100k-200k ) Earned income credit: $2,275 (reported on 23.9% of returns )(% of AGI for various income ranges: 7.1% for AGIs below $25k , 1.3% for AGIs $25k-50k ) Percentage of individuals using paid preparers for their 2012 taxes: 43.7%(% for various income ranges: 42.6% for AGIs below $25k , 40.0% for AGIs $25k-50k , 47.6% for AGIs $50k-75k , 47.8% for AGIs $75k-100k , 58.8% for AGIs $100k-200k )
Averages for the 2004 tax year for zip code 33540, filed in 2005:
Average Adjusted Gross Income (AGI) in 2004: $32,704 (Individual Income Tax Returns) Here:
$32,704State:
$50,523
Salary/wage: $30,973 (reported on 77.0% of returns )Here:
$30,973State:
$39,563
(% of AGI for various income ranges: 103.5% for AGIs below $10k , 66.0% for AGIs $10k-25k , 71.9% for AGIs $25k-50k , 79.6% for AGIs $50k-75k , 81.4% for AGIs $75k-100k , 56.9% for AGIs over 100k ) Taxable interest for individuals: $1,641 (reported on 39.4% of returns )This zip code:
$1,641Florida:
$3,211
(% of AGI for various income ranges: 12.8% for AGIs below $10k , 3.2% for AGIs $10k-25k , 2.1% for AGIs $25k-50k , 1.0% for AGIs $50k-75k , 0.6% for AGIs $75k-100k , 1.6% for AGIs over 100k ) Taxable dividends: $1,604 (reported on 17.6% of returns )(% of AGI for various income ranges: 3.4% for AGIs below $10k , 1.3% for AGIs $10k-25k , 1.2% for AGIs $25k-50k , 0.5% for AGIs $50k-75k , 0.2% for AGIs $75k-100k , 0.3% for AGIs over 100k ) Net capital gain/loss: +$4,490 (reported on 13.9% of returns )Here:
+$4,490State:
+$27,205
(% of AGI for various income ranges: -1.3% for AGIs below $10k , 0.1% for AGIs $10k-25k , 0.4% for AGIs $25k-50k , 1.0% for AGIs $50k-75k , 1.4% for AGIs $75k-100k , 10.5% for AGIs over 100k ) Profit/loss from business: +$5,670 (reported on 14.0% of returns )Here:
+$5,670State:
+$10,634
(% of AGI for various income ranges: 5.6% for AGIs below $10k , 4.4% for AGIs $10k-25k , 3.4% for AGIs $25k-50k , 1.2% for AGIs $50k-75k , 1.2% for AGIs $75k-100k , 0.7% for AGIs over 100k ) IRA payment deduction: $2,690 (reported on 1.8% of returns )33540:
$2,690Florida:
$3,082
(% of AGI for various income ranges: 0.2% for AGIs $10k-25k , 0.1% for AGIs $25k-50k , 0.2% for AGIs $50k-75k , 0.3% for AGIs $75k-100k ) Total itemized deductions: $15,027 (26% of AGI, reported on 17.6% of returns )Here:
$15,027State:
$20,370
Here:
25.7% of AGIState:
20.7% of AGI
(% of AGI for various income ranges: 12.2% for AGIs below $10k , 5.6% for AGIs $10k-25k , 8.2% for AGIs $25k-50k , 8.2% for AGIs $50k-75k , 9.6% for AGIs $75k-100k , 8.5% for AGIs over 100k ) Charity contributions deductions: $2,881 (5% of AGI, reported on 12.9% of returns )Here:
4.6% of AGIState:
3.8% of AGI
(% of AGI for various income ranges: 1.0% for AGIs below $10k , 0.6% for AGIs $10k-25k , 1.0% for AGIs $25k-50k , 1.2% for AGIs $50k-75k , 1.5% for AGIs $75k-100k , 1.8% for AGIs over 100k ) Total tax: $3,796 (reported on 71.2% of returns )(% of AGI for various income ranges: 2.7% for AGIs below $10k , 3.6% for AGIs $10k-25k , 6.4% for AGIs $25k-50k , 8.6% for AGIs $50k-75k , 10.4% for AGIs $75k-100k , 16.6% for AGIs over 100k ) Earned income credit: $1,605 (reported on 17.6% of returns )Percentage of individuals using paid preparers for their 2004 taxes: 55.6%(% for various income ranges: 52.8% for AGIs below $10k , 56.5% for AGIs $10k-25k , 53.3% for AGIs $25k-50k , 58.3% for AGIs $50k-75k , 59.3% for AGIs $75k-100k , 67.8% for AGIs over 100k )
Estimated median household income in 2022: This zip code:
$47,176Florida:
$69,303
Nearest zip codes: 33542 ,
33849 ,
33541 ,
33525 ,
33810 ,
33809 .
Zephyrhills North Zip Code Map
Percentage of family households: This zip code:
30.2%Florida:
41.2%
Percentage of households with unmarried partners: This zip code:
7.3%Florida:
46.7%
Likely homosexual households (counted as self-reported same-sex unmarried-partner households)
Lesbian couples: 0.5% of all households Gay men: 0.4% of all households
Household received Food Stamps/SNAP in the past 12 months: 647Household did not receive Food Stamps/SNAP in the past 12 months: 4,106
Women who had a birth in the past 12 months: 187 (85 now married , 97 unmarried) Women who did not have a birth in the past 12 months: 1,369 (603 now married , 766 unmarried)
Housing units in zip code 33540 with a mortgage: 1,440 (25
second mortgage , 6
both second mortgage and home equity loan )
Houses without a mortgage: 28
Median monthly owner costs for units with a mortgage: $1,250
Median monthly owner costs for units without a mortgage: $360
Residents with income below the poverty level in 2022:
This zip code:
19.8%Whole state:
12.7%
Residents with income below 50% of the poverty level in 2022:
This zip code:
8.8%Whole state:
6.6%
Median number of rooms in houses and condos: Median number of rooms in apartments:
Year house built (houses)
64 2020 or later606 2010 to 2019879 2000 to 20091,547 1990 to 19991,283 1980 to 1989742 1970 to 1979155 1960 to 196927 1950 to 195947 1940 to 194926 1939 or earlier
Zip code 33540 household income distribution in 2022 345 Less than $10,000271 $10,000 to $14,999238 $15,000 to $19,999188 $20,000 to $24,999346 $25,000 to $29,999333 $30,000 to $34,999224 $35,000 to $39,999350 $40,000 to $44,999132 $45,000 to $49,999649 $50,000 to $59,999360 $60,000 to $74,999481 $75,000 to $99,999273 $100,000 to $124,999107 $125,000 to $149,999200 $150,000 to $199,999222 $200,000 or moreEstimate of home value of owner-occupied houses/condos in 2022 in zip code 33540 121 Less than $10,000155 $10,000 to $14,99920 $15,000 to $19,99955 $20,000 to $24,99944 $25,000 to $29,999182 $30,000 to $34,999208 $35,000 to $39,999108 $40,000 to $49,999120 $50,000 to $59,999170 $60,000 to $69,999217 $70,000 to $79,999122 $80,000 to $89,99990 $90,000 to $99,999219 $100,000 to $124,999172 $125,000 to $149,999170 $150,000 to $174,999100 $175,000 to $199,999224 $200,000 to $249,999237 $250,000 to $299,999520 $300,000 to $399,99919 $400,000 to $499,99957 $500,000 to $749,99915 $750,000 to $999,99929 $1,500,000 to $1,999,999Rent paid by renters in 2022 in zip code 33540 32 $450 to $49944 $500 to $54948 $600 to $64946 $650 to $69963 $700 to $74947 $750 to $79993 $800 to $89943 $900 to $999113 $1,000 to $1,24951 $1,250 to $1,49955 $1,500 to $1,99913 $2,000 to $2,49915 $3,500 or more83 No cash rent
Median gross rent in 2022: $1,052.
Estimated median house (or condo) value in 2022 for: White Non-Hispanic householders: $167,406Black or African American householders: $127,653American Indian or Alaska Native householders: $277,776Asian householders: $30,864Some other race householders: $136,789Two or more races householders: $143,703Hispanic or Latino householders: $130,122Estimated median house or condo value in 2022: $138,271
33540:
$138,271Florida:
$354,100
Lower value quartile - upper value quartile: $67,224 - $266,880
Mean price in 2022: Detached houses: $382,870Here:
$382,870State:
$500,941
Townhouses or other attached units: $293,775Here:
$293,775State:
$370,869
In 2-unit structures: $216,640Here:
$216,640State:
$423,188
In 3-to-4-unit structures: $193,355Here:
$193,355State:
$309,944
In 5-or-more-unit structures: $213,163Here:
$213,163State:
$447,145
Mobile homes: $93,244Here:
$93,244State:
$113,202
Occupied boats, RVs, vans, etc.: $110,991Here:
$110,991State:
$73,933
Housing units in structures:
One, detached: 1,949One, attached: 68Two: 4010 to 19: 5120 to 49: 6150 or more: 209Mobile homes: 3,001Boats, RVs, vans, etc.: 133Unemployment : 5.8%
Means of transportation to work in zip code 33540 68.8% 2,440 Drove a car alone10.7% 381 Carpooled0.5% 19 Bus or trolley bus0.7% 24 Bicycle1.4% 50 Walked1.9% 68 Other means15.7% 558 Worked at homeTravel time to work (commute) in zip code 33540 33 Less than 5 minutes353 5 to 9 minutes300 10 to 14 minutes339 15 to 19 minutes348 20 to 24 minutes168 25 to 29 minutes399 30 to 34 minutes123 35 to 39 minutes183 40 to 44 minutes420 45 to 59 minutes282 60 to 89 minutes28 90 or more minutes
Neighborhoods in zip code 33540: Percentage of zip code residents living and working in this county: 64.6%
Household type by relationship:
Households: 10,572
Male householders: 2,243 (794 living alone ), Female householders: 2,517 (718 living alone )2,172 spouses (2,168 opposite-sex spouses ), 435 unmarried partners , (420 opposite-sex unmarried partners ), 2,017 children (1,965 natural , 39 adopted , 17 stepchildren ), 319 grandchildren , 96 brothers or sisters , 116 parents , 0 foster children , 232 other relatives , 323 non-relatives In group quarters: 159 (-1 institutionalized population )
Size of family households: 1,586 2-persons , 707 3-persons , 415 4-persons , 66 5-persons , 32 6-persons , 58 7-or-more-persons
Size of nonfamily households: 1,509 1-person , 342 2-persons , 35 4-persons , 10 5-persons
625 married couples with children. single-parent households (99 men , 447 women ).
89.1% of residents of 33540 zip code speak English at home. of residents speak Spanish at home (56% very well, 25% well, 4% not well, 15% not at all ).of residents speak other Indo-European language at home (39% very well, 57% well, 4% not well ).of residents speak Asian or Pacific Island language at home (53% very well, 47% well ).of residents speak other language at home (100% very well ).
Foreign born population: 814 (7.7%)
(30.6%
of them are naturalized citizens )
This zip code:
7.7%Whole state:
21.7%
10% Sweden 8% Haiti 7% United Kingdom, excluding England and Scotland 6% Honduras 6% Barbados 3% Malaysia 2% France 18% American 13% English 9% German 7% Irish 3% European 3% Italian 3% Canadian
Year of entry for the foreign-born population
767 2010 or later 193 2000 to 2009 143 1990 to 1999 287 Before 1990
Major facilities with environmental interests located in this zip code:
GREAT SPRING WATERS OF AMER (4330 20TH ST. in ZEPHYRHILLS, FL)
STATE MASTER (Pennsylvania database) - PWSID-9996457, DRINKING WATER PROGRAM National Pollutant Discharge Elimination System NON-MAJOR (Tracking pollutant discharge elimination systems) - permit National Pollutant Discharge Elimination System NON-MAJOR (Tracking pollutant discharge elimination systems) - permit Organizations: TIMOTHY GOOD (CONTACT/OWNER)
Alternative names: ZEPHYRHILLS NATURAL SPRINGWATE, ZEPHYRHILLS SPRING WATER
RIGSBY'S AUTO PARTS & SALES (41147 LYNBROOK DR in ZEPHYRHILLS, FL)
(Integrated Compliance Information System) - ICIS-04-2000-0068, FORMAL ENFORCEMENT ACTION Business SIC classification: MOTOR VEHICLE PARTS, USED
NEW CHANCE HOMES (38607 TUCKER in ZEPHYRHILLS, FL)
National Pollutant Discharge Elimination System NON-MAJOR (Tracking pollutant discharge elimination systems) - permit Organizations: TIMOTHY HEALEY (CONTACT/OWNER)
OTIS ALLEN ROAD (CONNECTING C.R. 41 TO U.S. 301 in ZEPHYRHILLS, FL)
National Pollutant Discharge Elimination System NON-MAJOR (Tracking pollutant discharge elimination systems) - permit Organizations: JAMES WIDMAN (CONTACT/OWNER)
CRESTVIEW HILLS (NE CORNER OF PETTY POND RD & W in ZEPHYRHILLS, FL)
National Pollutant Discharge Elimination System NON-MAJOR (Tracking pollutant discharge elimination systems) - permit Organizations: FRANCINE MILLER (CONTACT/OWNER)
MIRCOTEL INNS & SUITES (US 301: 700 FT OF KOSSICK RD. in ZEPHYRHILLS, FL)
National Pollutant Discharge Elimination System NON-MAJOR (Tracking pollutant discharge elimination systems) - permit Organizations: MARIAN GOODMAN (CONTACT/OWNER)
NORTH TOWN CENTER (US 301; 700 FT S. OF KOSSICK R in ZEPHYRHILLS, FL)
National Pollutant Discharge Elimination System NON-MAJOR (Tracking pollutant discharge elimination systems) - permit Organizations: JAMES BINGHAM (CONTACT/OWNER)
PHOTEC (38835 CR 54 E in ZEPHYRHILLS, FL)
(Resource Conservation and Recovery Act (tracking hazardous waste)) Organizations: FREDERICK GRINDLE, OWNER (CONTACT/OWNER)
RIGSBY'S AUTO PARTS AND SALES (40147 LYNBROOK DR in ZEPHYRHILLS, FL)
National Pollutant Discharge Elimination System NON-MAJOR (Tracking pollutant discharge elimination systems) - permit Business SIC classification: MOTOR VEHICLE PARTS, USEDOrganizations: EVERETT RIGSBY (CONTACT/OWNER)
RIGSBYS AUTO SALVAGE (40147 LYNBROOK DR in ZEPHYRHILLS, FL)
(Resource Conservation and Recovery Act (tracking hazardous waste)) Organizations: RIGSBYS AUTO PARTS & SALES INC (CONTACT/OWNER)
RIVERWOOD - PHASE 1A & 2A ( in UNINCORPORATED, FL)
National Pollutant Discharge Elimination System NON-MAJOR (Tracking pollutant discharge elimination systems) - permit Organizations: DOUGLAS WEILAND (CONTACT/OWNER)
INDOOR ENVIRONMENTAL HEALTH (38922 BAY AVE in ZEPHYRHILLS, FL)
TRANSPORTER (Resource Conservation and Recovery Act (tracking hazardous waste)) Organizations: VICTOR FEENEY, OWNER (CONTACT/OWNER)
COUNTRY AIRE VILLAGE (39333 BLUE SKY DR in ZEPHYRHILLS, FL)
Small Quantity Generators, between 100 kg and 1000 kg of hazardous waste/month (Resource Conservation and Recovery Act (tracking hazardous waste)) - notification Organizations: NON NOTIFIED (CONTACT/OWNER)
Housing units lacking complete plumbing facilities: 0.6%
Housing units lacking complete kitchen facilities: 2.3%
97.1% Electricity 1.4% Bottled, tank, or LP gas 0.8% Utility gas
Population in 1990: 15,608. Population change in the 1990s: +3,229 (+20.7%).
Place of birth for U.S.-born residents:
This state: 3,841Northeast: 1,839Midwest: 2,025South: 1,005West: 510
50% of the 33540 zip code residents lived in the same house 5 years ago.
Out of people who lived in different houses, 48% lived in this county.
Out of people who lived in different counties, 50% lived in Florida.
84% of the 33540 zip code residents lived in the same house 1 year ago.
Out of people who lived in different houses, 31% moved from this county.
Out of people who lived in different houses, 24% moved from different county within same state.
Out of people who lived in different houses, 27% moved from different state.
Out of people who lived in different houses, 23% moved from abroad.
Private vs. public school enrollment:
Students in private schools in grades 1 to 8 (elementary and middle school): 65
Students in private schools in grades 9 to 12 (high school): 36
Students in private undergraduate colleges: 13
Occupation by median earnings in the past 12 months ($)
86,239 Health diagnosing and treating practitioners and other technical occupations 69,901 Business and financial operations occupations 60,718 Computer and mathematical occupations 56,149 Transportation occupations 55,776 Installation, maintenance, and repair occupations 48,974 Production occupations
Companies with federal contracts located in this zip code:
KURTH, RONALD (41219 HOCKEY DR LOT 184 in ZEPHYRHILLS, FL; small business)
$9,380 with U.S. Army Corps of Engineers - civil program financing only for Recreation Site Maintenance Services (non-construction). Signed on 2003-02-25. Completion date: 2003-11-20.
PACKING PLACE (10827 FRIENDLY PL in ZEPHYRHILLS, FL; small business) in 2 contracts from 2003 to 2004
$15,600 with Army for Parachutes; Aerial Pick Up, Delivery, Recovery Systems; and Cargo Tie Down Equipment. Signed on 2003-12-11. Completion date: 2004-03-03.
, same as above. Signed on 2004-06-30. Completion date: 2004-03-03.
Top industries in this zip code by the number of employees in 2005:
Health Care and Social Assistance: Nursing Care Facilities (100-249 employees: 2 establishments, 5-9 employees: 1 establishment, 1-4 employees: 1 establishment)Health Care and Social Assistance: Offices of Physicians (except Mental Health Specialists) (20-49: 1, 10-19: 3, 5-9: 5, 1-4: 7)Accommodation and Food Services: Full-Service Restaurants (50-99: 1, 5-9: 1, 1-4: 1)Finance and Insurance: Insurance Agencies and Brokerages (10-19: 3, 1-4: 2)
People in group quarters in 2010:
81 people in nursing facilities/skilled-nursing facilities
5 people in emergency and transitional shelters (with sleeping facilities) for people experiencing homelessness
People in group quarters in 2000:
216 people in nursing homes
95 people in other noninstitutional group quarters
20 people in homes for the mentally retarded
Fatal accident statistics in 2014:
Fatal accident count: 3Vehicles involved in fatal accidents: 6Fatal accidents caused by drunken drivers: 0Fatalities: 3Persons involved in fatal accidents: 6Pedestrians involved in fatal accidents: 0
Fatal accident statistics in 2013:
Fatal accident count: 2Vehicles involved in fatal accidents: 3Fatal accidents caused by drunken drivers: 1Fatalities: 2Persons involved in fatal accidents: 6Pedestrians involved in fatal accidents: 0
Home Mortgage Disclosure Act Aggregated Statistics For Year 2009(Based on 1 full and 10 partial tracts) A) FHA, FSA/RHS & VA B) Conventional C) Refinancings D) Home Improvement Loans E) Loans on Dwellings For 5+ Families F) Non-occupant Loans on G) Loans On Manufactured Number Average Value Number Average Value Number Average Value Number Average Value Number Average Value Number Average Value Number Average Value
LOANS ORIGINATED 101 $107,108 92 $73,688 189 $108,676 24 $31,838 2 $375,720 37 $58,344 100 $60,231 APPLICATIONS APPROVED, NOT ACCEPTED 2 $66,110 11 $72,490 28 $99,791 11 $30,975 0 $0 3 $15,277 22 $70,741 APPLICATIONS DENIED 24 $108,299 40 $66,246 161 $120,898 37 $23,797 1 $180,800 20 $92,689 67 $59,938 APPLICATIONS WITHDRAWN 10 $118,335 6 $141,945 77 $127,873 2 $45,420 0 $0 5 $122,076 21 $97,084 FILES CLOSED FOR INCOMPLETENESS 7 $96,280 5 $42,258 7 $113,626 1 $64,100 0 $0 0 $0 6 $52,952
Aggregated Statistics For Year 2008(Based on 1 full and 10 partial tracts) A) FHA, FSA/RHS & VA B) Conventional C) Refinancings D) Home Improvement Loans E) Loans on Dwellings For 5+ Families F) Non-occupant Loans on G) Loans On Manufactured Number Average Value Number Average Value Number Average Value Number Average Value Number Average Value Number Average Value Number Average Value
LOANS ORIGINATED 110 $119,724 157 $85,853 215 $122,581 37 $27,639 1 $1,185,850 66 $73,029 130 $64,107 APPLICATIONS APPROVED, NOT ACCEPTED 13 $123,241 23 $93,493 72 $93,520 12 $70,569 0 $0 12 $68,506 33 $78,619 APPLICATIONS DENIED 44 $125,775 61 $79,618 311 $132,356 95 $39,727 1 $268,490 55 $109,480 107 $85,256 APPLICATIONS WITHDRAWN 18 $120,744 12 $114,292 71 $144,322 4 $114,302 0 $0 6 $126,163 15 $114,627 FILES CLOSED FOR INCOMPLETENESS 5 $99,284 5 $157,634 25 $134,808 3 $22,237 0 $0 0 $0 4 $122,170
Aggregated Statistics For Year 2007(Based on 1 full and 10 partial tracts) A) FHA, FSA/RHS & VA B) Conventional C) Refinancings D) Home Improvement Loans E) Loans on Dwellings For 5+ Families F) Non-occupant Loans on G) Loans On Manufactured Number Average Value Number Average Value Number Average Value Number Average Value Number Average Value Number Average Value Number Average Value
LOANS ORIGINATED 75 $131,112 346 $103,972 548 $123,591 82 $56,026 8 $184,232 114 $117,842 260 $78,828 APPLICATIONS APPROVED, NOT ACCEPTED 7 $136,559 60 $107,293 153 $124,802 32 $57,018 0 $0 25 $104,768 55 $84,193 APPLICATIONS DENIED 32 $120,678 142 $110,515 558 $136,174 156 $74,898 0 $0 49 $129,250 174 $77,766 APPLICATIONS WITHDRAWN 12 $88,378 55 $105,179 208 $131,288 25 $104,901 0 $0 31 $143,688 43 $86,594 FILES CLOSED FOR INCOMPLETENESS 1 $205,000 19 $106,467 57 $138,572 4 $90,020 0 $0 6 $118,767 3 $73,217
Aggregated Statistics For Year 2006(Based on 1 full and 10 partial tracts) A) FHA, FSA/RHS & VA B) Conventional C) Refinancings D) Home Improvement Loans E) Loans on Dwellings For 5+ Families F) Non-occupant Loans on G) Loans On Manufactured Number Average Value Number Average Value Number Average Value Number Average Value Number Average Value Number Average Value Number Average Value
LOANS ORIGINATED 82 $133,991 752 $113,554 687 $123,868 125 $45,557 3 $352,123 228 $114,940 269 $78,778 APPLICATIONS APPROVED, NOT ACCEPTED 7 $160,873 127 $96,187 156 $113,037 38 $53,208 0 $0 40 $100,482 82 $72,305 APPLICATIONS DENIED 25 $130,509 284 $107,998 542 $123,514 151 $47,972 0 $0 86 $101,314 217 $74,701 APPLICATIONS WITHDRAWN 10 $109,901 147 $117,178 323 $120,311 34 $86,427 0 $0 65 $104,008 49 $72,824 FILES CLOSED FOR INCOMPLETENESS 1 $143,140 32 $101,031 111 $135,968 5 $228,160 0 $0 15 $73,721 8 $78,834
Aggregated Statistics For Year 2005(Based on 1 full and 10 partial tracts) A) FHA, FSA/RHS & VA B) Conventional C) Refinancings D) Home Improvement Loans E) Loans on Dwellings For 5+ Families F) Non-occupant Loans on G) Loans On Manufactured Number Average Value Number Average Value Number Average Value Number Average Value Number Average Value Number Average Value Number Average Value
LOANS ORIGINATED 83 $115,763 793 $97,966 634 $106,140 95 $65,117 1 $373,280 225 $91,751 317 $69,390 APPLICATIONS APPROVED, NOT ACCEPTED 4 $86,942 134 $89,408 170 $97,233 25 $53,811 2 $197,960 39 $91,774 76 $58,446 APPLICATIONS DENIED 13 $112,301 250 $124,546 562 $100,468 148 $41,884 0 $0 47 $80,757 191 $116,231 APPLICATIONS WITHDRAWN 6 $126,155 132 $102,482 350 $110,376 41 $149,647 0 $0 42 $87,394 67 $76,664 FILES CLOSED FOR INCOMPLETENESS 1 $116,620 20 $118,487 158 $115,638 10 $40,779 0 $0 9 $93,848 25 $88,886
Aggregated Statistics For Year 2004(Based on 1 full and 10 partial tracts) A) FHA, FSA/RHS & VA B) Conventional C) Refinancings D) Home Improvement Loans E) Loans on Dwellings For 5+ Families F) Non-occupant Loans on G) Loans On Manufactured Number Average Value Number Average Value Number Average Value Number Average Value Number Average Value Number Average Value Number Average Value
LOANS ORIGINATED 96 $101,534 661 $81,821 489 $86,268 79 $41,858 1 $769,200 169 $78,252 327 $57,262 APPLICATIONS APPROVED, NOT ACCEPTED 10 $88,124 146 $72,373 161 $76,643 15 $35,122 0 $0 22 $75,327 117 $51,288 APPLICATIONS DENIED 19 $99,207 169 $82,328 457 $79,408 117 $33,657 0 $0 51 $63,844 187 $60,012 APPLICATIONS WITHDRAWN 13 $117,919 76 $88,816 219 $91,857 20 $37,398 0 $0 30 $77,166 41 $73,215 FILES CLOSED FOR INCOMPLETENESS 2 $94,850 18 $102,510 147 $104,056 7 $41,880 0 $0 4 $72,895 40 $94,168
Aggregated Statistics For Year 2003(Based on 1 full and 10 partial tracts) A) FHA, FSA/RHS & VA B) Conventional C) Refinancings D) Home Improvement Loans E) Loans on Dwellings For 5+ Families F) Non-occupant Loans on Number Average Value Number Average Value Number Average Value Number Average Value Number Average Value Number Average Value
LOANS ORIGINATED 107 $94,898 541 $70,894 867 $80,712 59 $21,046 0 $0 139 $53,172 APPLICATIONS APPROVED, NOT ACCEPTED 11 $91,558 63 $63,047 204 $76,093 11 $22,999 0 $0 19 $54,748 APPLICATIONS DENIED 14 $94,339 166 $56,008 553 $76,939 65 $17,592 1 $50,000 45 $53,811 APPLICATIONS WITHDRAWN 14 $78,240 51 $83,162 163 $87,280 5 $42,092 2 $201,190 19 $65,923 FILES CLOSED FOR INCOMPLETENESS 4 $67,160 16 $98,369 35 $78,370 2 $37,605 0 $0 3 $73,497
Aggregated Statistics For Year 2002(Based on 1 full and 10 partial tracts) A) FHA, FSA/RHS & VA B) Conventional C) Refinancings D) Home Improvement Loans E) Loans on Dwellings For 5+ Families F) Non-occupant Loans on Number Average Value Number Average Value Number Average Value Number Average Value Number Average Value Number Average Value
LOANS ORIGINATED 106 $87,736 472 $63,760 575 $71,088 44 $16,934 5 $389,666 130 $52,916 APPLICATIONS APPROVED, NOT ACCEPTED 6 $79,297 64 $66,843 150 $62,896 20 $20,215 0 $0 11 $50,456 APPLICATIONS DENIED 17 $87,108 154 $54,232 432 $70,167 66 $16,087 0 $0 28 $50,717 APPLICATIONS WITHDRAWN 5 $86,956 34 $63,810 151 $71,922 6 $25,147 2 $727,200 10 $49,220 FILES CLOSED FOR INCOMPLETENESS 4 $76,455 12 $84,164 53 $75,601 2 $65,705 0 $0 3 $86,420
Aggregated Statistics For Year 2001(Based on 1 full and 10 partial tracts) A) FHA, FSA/RHS & VA B) Conventional C) Refinancings D) Home Improvement Loans E) Loans on Dwellings For 5+ Families F) Non-occupant Loans on Number Average Value Number Average Value Number Average Value Number Average Value Number Average Value Number Average Value
LOANS ORIGINATED 113 $86,005 467 $63,554 529 $64,072 73 $17,888 2 $171,130 93 $43,011 APPLICATIONS APPROVED, NOT ACCEPTED 4 $73,652 111 $52,222 92 $56,483 28 $30,986 0 $0 16 $40,381 APPLICATIONS DENIED 20 $79,186 243 $55,731 456 $58,205 93 $13,589 0 $0 20 $35,664 APPLICATIONS WITHDRAWN 12 $81,214 36 $69,951 196 $61,746 18 $25,376 0 $0 12 $57,468 FILES CLOSED FOR INCOMPLETENESS 1 $105,700 10 $57,763 41 $72,476 1 $20,340 0 $0 1 $102,560
Aggregated Statistics For Year 2000(Based on 1 full and 10 partial tracts) A) FHA, FSA/RHS & VA B) Conventional C) Refinancings D) Home Improvement Loans E) Loans on Dwellings For 5+ Families F) Non-occupant Loans on Number Average Value Number Average Value Number Average Value Number Average Value Number Average Value Number Average Value
LOANS ORIGINATED 98 $71,959 510 $56,982 242 $63,923 92 $13,370 4 $146,402 85 $43,803 APPLICATIONS APPROVED, NOT ACCEPTED 3 $72,793 114 $49,033 82 $55,865 33 $17,818 0 $0 8 $35,915 APPLICATIONS DENIED 7 $63,346 347 $57,652 264 $47,939 86 $20,982 1 $234,140 21 $54,237 APPLICATIONS WITHDRAWN 8 $74,044 47 $63,794 170 $53,859 9 $29,956 1 $256,740 5 $46,386 FILES CLOSED FOR INCOMPLETENESS 9 $67,553 8 $88,561 87 $62,979 4 $18,332 0 $0 3 $55,750
Aggregated Statistics For Year 1999(Based on 1 full and 5 partial tracts) A) FHA, FSA/RHS & VA B) Conventional C) Refinancings D) Home Improvement Loans E) Loans on Dwellings For 5+ Families F) Non-occupant Loans on Number Average Value Number Average Value Number Average Value Number Average Value Number Average Value Number Average Value
LOANS ORIGINATED 53 $65,905 321 $55,485 246 $56,147 60 $17,044 1 $61,430 54 $49,596 APPLICATIONS APPROVED, NOT ACCEPTED 1 $113,490 63 $54,482 95 $49,314 16 $24,342 1 $10,000 7 $44,816 APPLICATIONS DENIED 6 $67,578 233 $58,093 201 $48,565 63 $17,284 0 $0 16 $31,184 APPLICATIONS WITHDRAWN 5 $52,918 21 $62,662 82 $52,680 11 $43,635 0 $0 4 $22,425 FILES CLOSED FOR INCOMPLETENESS 1 $41,860 13 $52,711 50 $60,225 3 $18,230 0 $0 2 $41,385
Private Mortgage Insurance Companies Aggregated Statistics For Year 2009(Based on 1 full and 8 partial tracts) A) Conventional B) Refinancings C) Non-occupant Loans on Number Average Value Number Average Value Number Average Value
LOANS ORIGINATED 3 $92,467 1 $214,940 0 $0 APPLICATIONS APPROVED, NOT ACCEPTED 1 $132,420 2 $210,660 1 $184,380 APPLICATIONS DENIED 0 $0 0 $0 0 $0 APPLICATIONS WITHDRAWN 1 $163,140 0 $0 0 $0 FILES CLOSED FOR INCOMPLETENESS 0 $0 0 $0 0 $0
Aggregated Statistics For Year 2008(Based on 1 full and 10 partial tracts) A) Conventional B) Refinancings C) Non-occupant Loans on D) Loans On Manufactured Number Average Value Number Average Value Number Average Value Number Average Value
LOANS ORIGINATED 18 $117,121 11 $191,001 3 $123,997 3 $101,497 APPLICATIONS APPROVED, NOT ACCEPTED 13 $156,245 13 $168,720 2 $237,510 1 $129,000 APPLICATIONS DENIED 3 $101,243 1 $199,720 0 $0 3 $88,940 APPLICATIONS WITHDRAWN 0 $0 0 $0 0 $0 0 $0 FILES CLOSED FOR INCOMPLETENESS 1 $141,020 1 $162,130 0 $0 0 $0
Aggregated Statistics For Year 2007(Based on 1 full and 10 partial tracts) A) Conventional B) Refinancings C) Non-occupant Loans on D) Loans On Manufactured Number Average Value Number Average Value Number Average Value Number Average Value
LOANS ORIGINATED 75 $147,806 27 $164,832 14 $151,754 5 $110,652 APPLICATIONS APPROVED, NOT ACCEPTED 17 $127,295 12 $163,701 6 $131,202 2 $105,710 APPLICATIONS DENIED 0 $0 0 $0 0 $0 0 $0 APPLICATIONS WITHDRAWN 5 $118,292 2 $190,860 3 $86,297 0 $0 FILES CLOSED FOR INCOMPLETENESS 0 $0 0 $0 0 $0 0 $0
Aggregated Statistics For Year 2006(Based on 1 full and 10 partial tracts) A) Conventional B) Refinancings C) Non-occupant Loans on D) Loans On Manufactured Number Average Value Number Average Value Number Average Value Number Average Value
LOANS ORIGINATED 93 $151,403 28 $159,634 22 $162,137 5 $114,008 APPLICATIONS APPROVED, NOT ACCEPTED 23 $209,228 13 $116,770 4 $181,010 1 $206,400 APPLICATIONS DENIED 1 $244,780 0 $0 0 $0 0 $0 APPLICATIONS WITHDRAWN 2 $121,130 9 $167,152 1 $150,970 0 $0 FILES CLOSED FOR INCOMPLETENESS 0 $0 2 $75,145 0 $0 0 $0
Aggregated Statistics For Year 2005(Based on 1 full and 10 partial tracts) A) Conventional B) Refinancings C) Non-occupant Loans on D) Loans On Manufactured Number Average Value Number Average Value Number Average Value Number Average Value
LOANS ORIGINATED 127 $134,328 40 $120,458 27 $116,261 17 $86,125 APPLICATIONS APPROVED, NOT ACCEPTED 24 $132,621 6 $143,072 7 $134,030 3 $131,427 APPLICATIONS DENIED 2 $240,785 2 $98,575 0 $0 0 $0 APPLICATIONS WITHDRAWN 3 $201,010 2 $107,665 0 $0 0 $0 FILES CLOSED FOR INCOMPLETENESS 3 $87,063 2 $125,240 0 $0 2 $137,250
Aggregated Statistics For Year 2004(Based on 1 full and 10 partial tracts) A) Conventional B) Refinancings C) Non-occupant Loans on D) Loans On Manufactured Number Average Value Number Average Value Number Average Value Number Average Value
LOANS ORIGINATED 125 $94,340 27 $117,801 25 $67,034 9 $89,657 APPLICATIONS APPROVED, NOT ACCEPTED 57 $136,864 14 $108,639 5 $138,300 4 $88,555 APPLICATIONS DENIED 6 $84,517 0 $0 5 $55,268 0 $0 APPLICATIONS WITHDRAWN 9 $142,024 3 $118,360 0 $0 0 $0 FILES CLOSED FOR INCOMPLETENESS 4 $111,955 0 $0 0 $0 0 $0
Aggregated Statistics For Year 2003(Based on 1 full and 10 partial tracts) A) Conventional B) Refinancings C) Non-occupant Loans on Number Average Value Number Average Value Number Average Value
LOANS ORIGINATED 135 $87,653 101 $96,396 21 $73,875 APPLICATIONS APPROVED, NOT ACCEPTED 42 $120,302 23 $99,238 3 $171,000 APPLICATIONS DENIED 13 $113,993 3 $92,443 5 $164,134 APPLICATIONS WITHDRAWN 12 $147,126 10 $108,111 2 $101,035 FILES CLOSED FOR INCOMPLETENESS 6 $104,063 0 $0 3 $80,800
Aggregated Statistics For Year 2002(Based on 1 full and 10 partial tracts) A) Conventional B) Refinancings C) Non-occupant Loans on Number Average Value Number Average Value Number Average Value
LOANS ORIGINATED 130 $83,574 66 $95,389 18 $70,731 APPLICATIONS APPROVED, NOT ACCEPTED 19 $126,470 18 $85,696 0 $0 APPLICATIONS DENIED 8 $107,281 1 $139,740 0 $0 APPLICATIONS WITHDRAWN 8 $121,935 7 $92,003 0 $0 FILES CLOSED FOR INCOMPLETENESS 3 $124,700 0 $0 0 $0
Aggregated Statistics For Year 2001(Based on 1 full and 10 partial tracts) A) Conventional B) Refinancings C) Non-occupant Loans on Number Average Value Number Average Value Number Average Value
LOANS ORIGINATED 103 $81,656 42 $83,728 7 $69,534 APPLICATIONS APPROVED, NOT ACCEPTED 11 $84,520 13 $95,675 2 $59,215 APPLICATIONS DENIED 3 $53,353 2 $92,640 2 $76,590 APPLICATIONS WITHDRAWN 3 $63,953 1 $151,810 0 $0 FILES CLOSED FOR INCOMPLETENESS 1 $41,120 0 $0 0 $0
Aggregated Statistics For Year 2000(Based on 1 full and 10 partial tracts) A) Conventional B) Refinancings C) Non-occupant Loans on Number Average Value Number Average Value Number Average Value
LOANS ORIGINATED 90 $79,868 18 $62,752 7 $43,904 APPLICATIONS APPROVED, NOT ACCEPTED 18 $82,492 4 $99,188 0 $0 APPLICATIONS DENIED 5 $74,800 1 $47,010 0 $0 APPLICATIONS WITHDRAWN 3 $81,257 2 $58,175 0 $0 FILES CLOSED FOR INCOMPLETENESS 0 $0 0 $0 0 $0
Aggregated Statistics For Year 1999(Based on 1 full and 5 partial tracts) A) Conventional B) Refinancings C) Non-occupant Loans on Number Average Value Number Average Value Number Average Value
LOANS ORIGINATED 61 $75,944 17 $79,043 4 $76,358 APPLICATIONS APPROVED, NOT ACCEPTED 4 $87,915 1 $86,410 0 $0 APPLICATIONS DENIED 8 $71,625 1 $166,080 0 $0 APPLICATIONS WITHDRAWN 5 $107,032 0 $0 1 $108,000 FILES CLOSED FOR INCOMPLETENESS 2 $125,500 0 $0 0 $0
2002 - 2018 National Fire Incident Reporting System (NFIRS) incidents See full 2006 National Fire Incident Reporting System statistics for zip code 33540, Florida
Most common first names in zip code 33540 among deceased individuals Name Count Lived (average)
John 688 74.7 years William 615 75.6 years Charles 399 75.2 years George 387 76.3 years Mary 364 78.4 years Robert 348 71.8 years James 329 73.1 years Joseph 261 75.3 years Frank 259 75.5 years Edward 229 74.9 years
Most common last names in zip code 33540 among deceased individuals Last name Count Lived (average)
Smith 241 76.1 years Miller 129 76.9 years Johnson 126 76.7 years Brown 85 74.6 years Davis 85 76.7 years Anderson 79 76.5 years Jones 68 75.4 years Wilson 65 77.4 years Williams 60 72.9 years Taylor 54 75.0 years
Businesses in zip code 33540
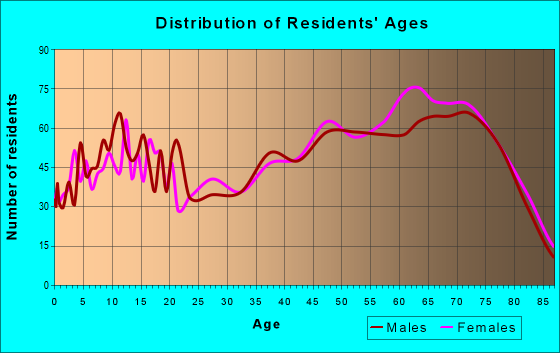
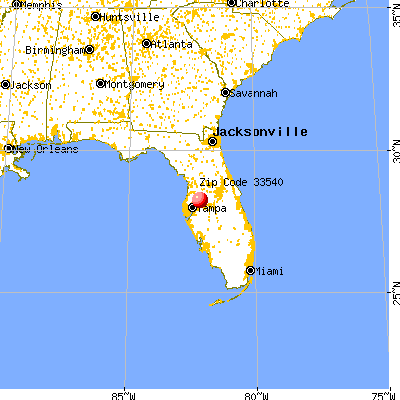


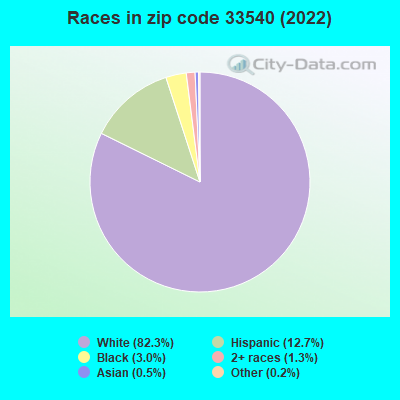


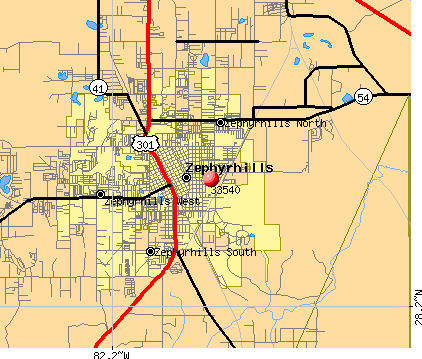 Nearest zip codes: 33542, 33849, 33541, 33525, 33810, 33809.
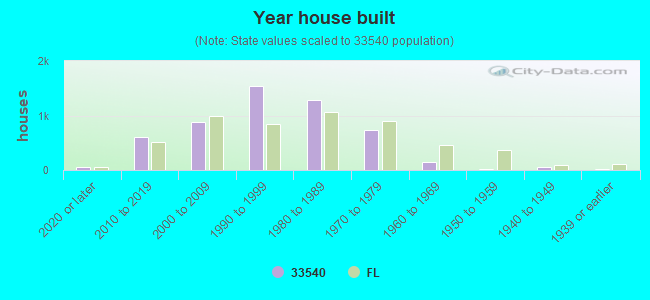
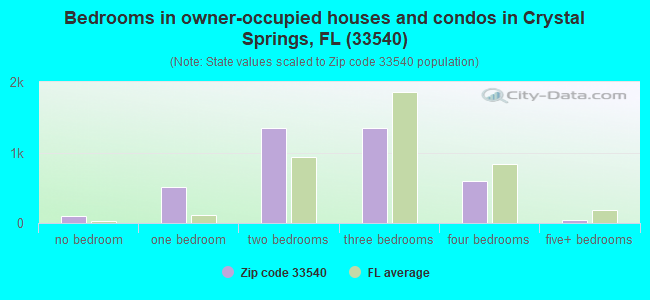
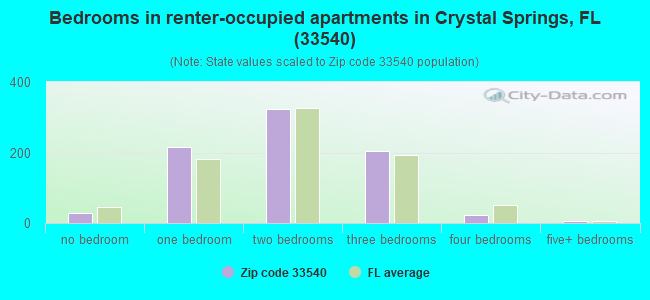
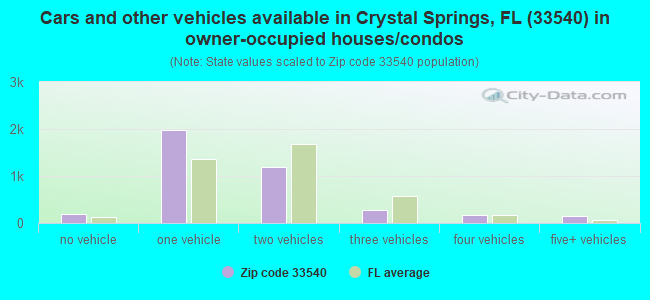
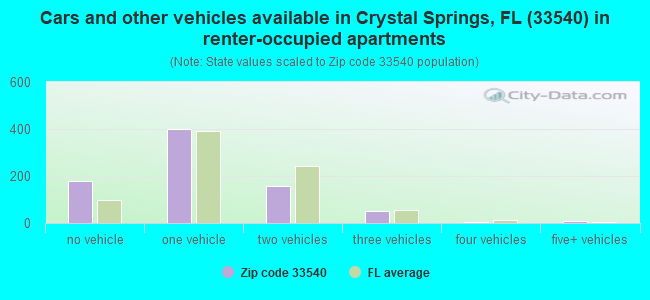


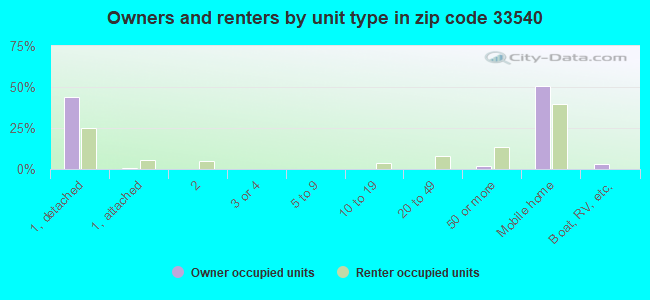
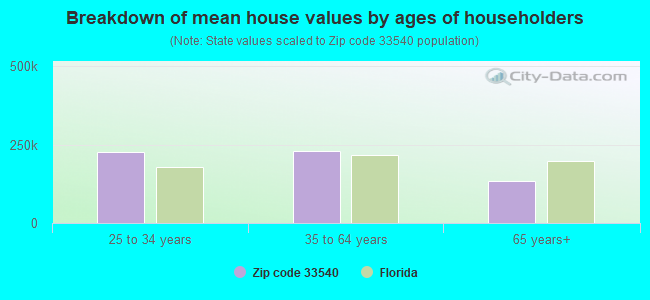


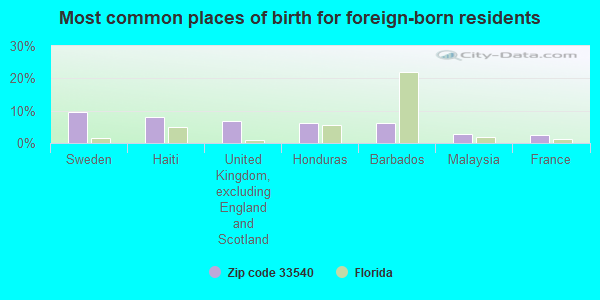
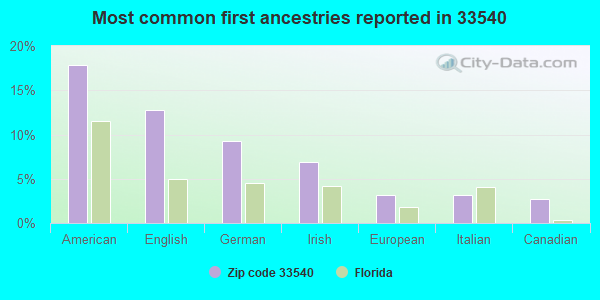
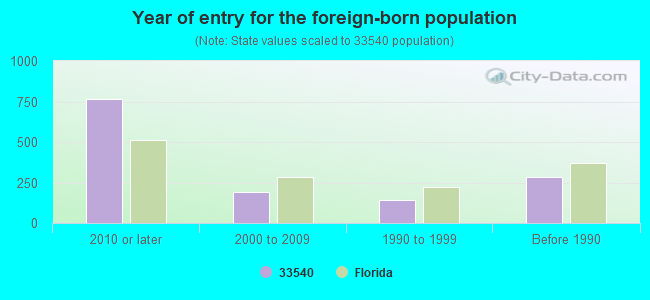
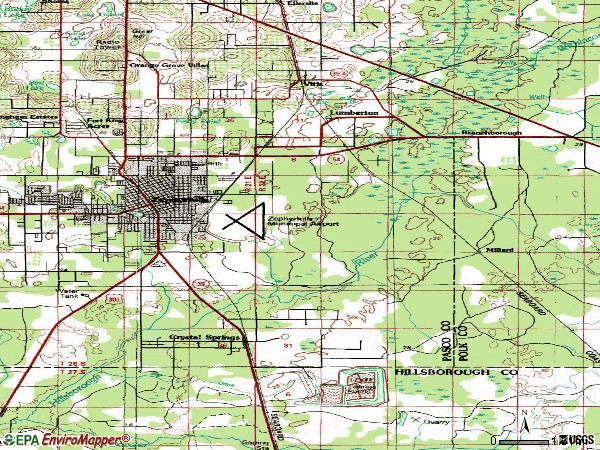

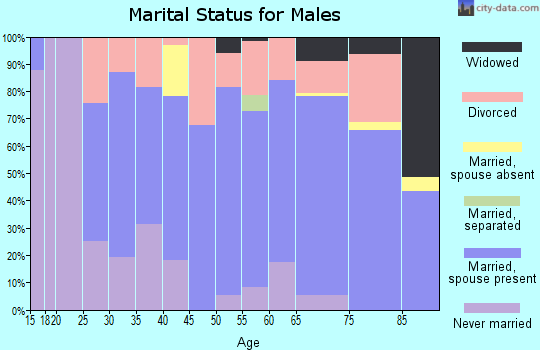
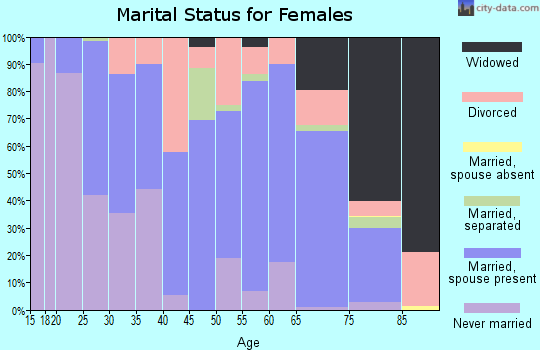
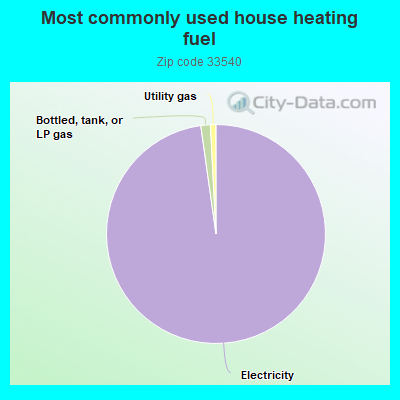
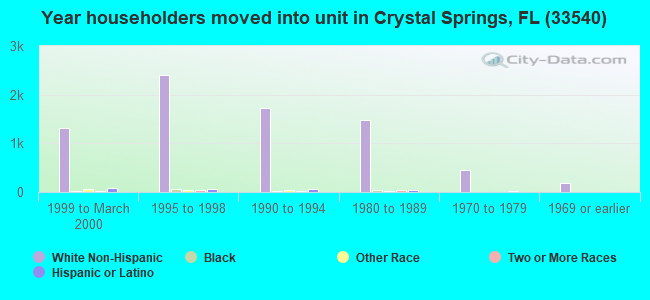
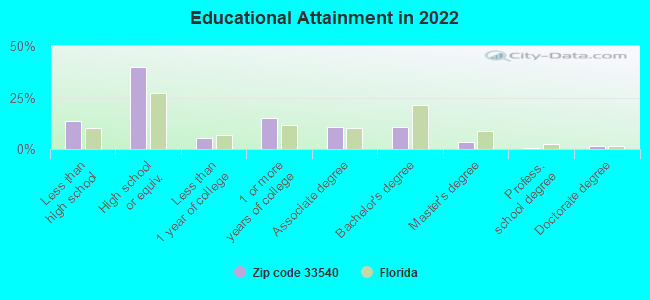
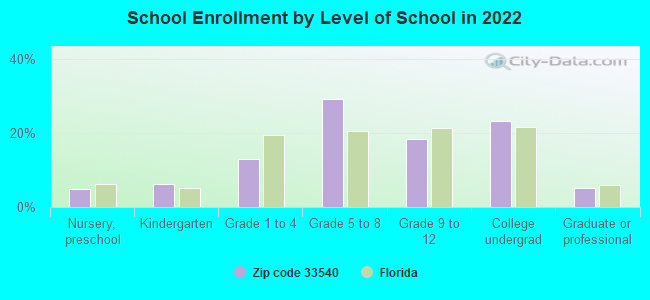
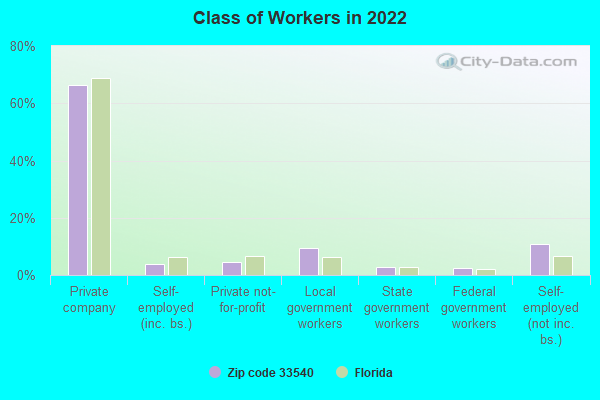
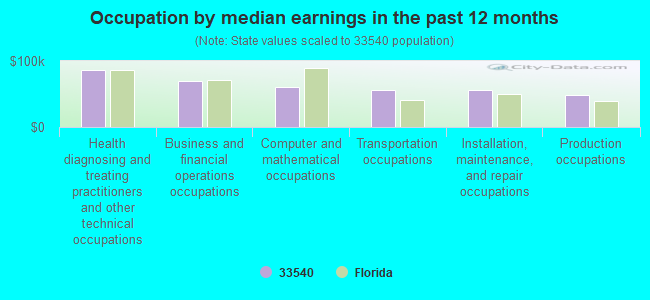
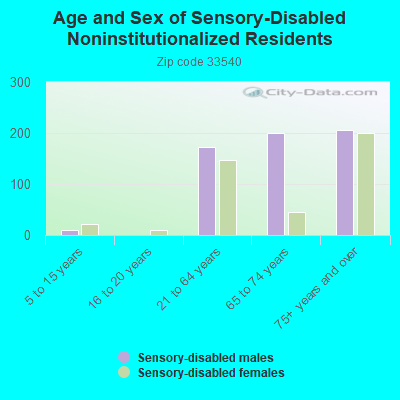
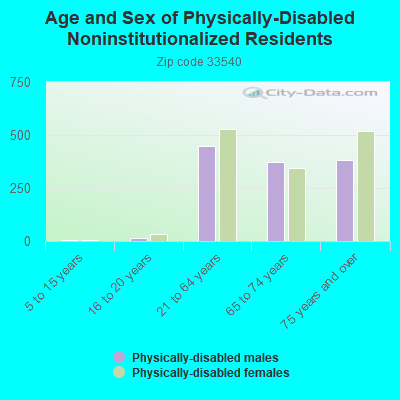
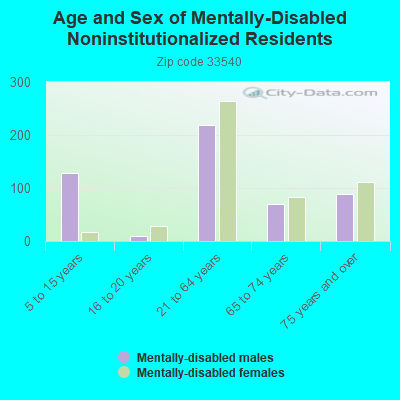
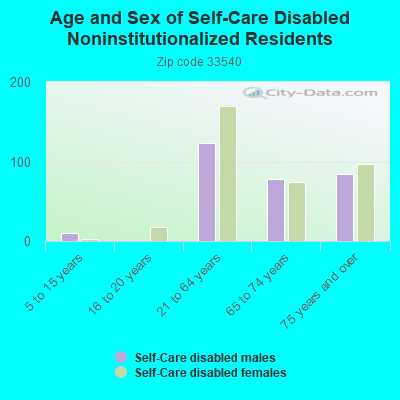
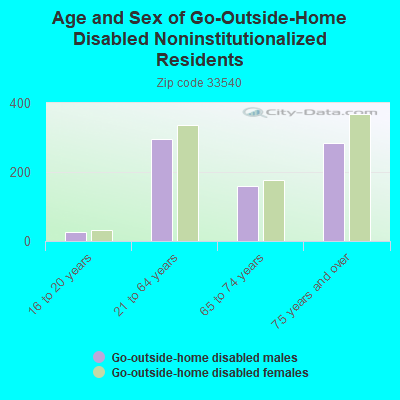
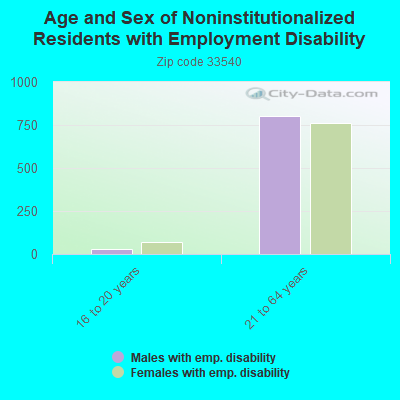
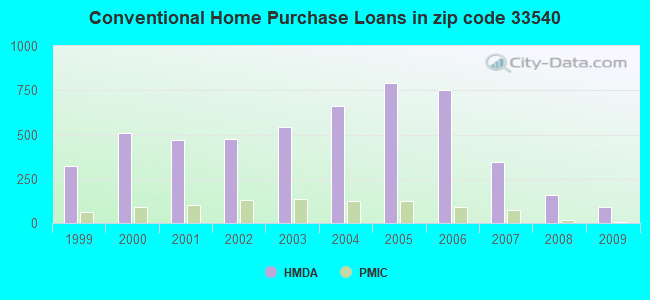
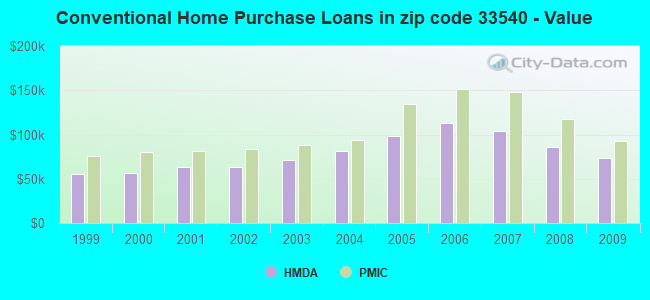
 Based on the data from the years 2002 - 2018 the average number of fire incidents per year is 40. The highest number of fires - 82 took place in 2002, and the least - 16 in 2014. The data has a dropping trend.
 When looking into fire subcategories, the most incidents belonged to: Outside Fires (37.8%), and Structure Fires (29.2%).