Estimated zip code population in 2022: 52,877 Zip code population in 2010: 44,254 Zip code population in 2000: 28,563
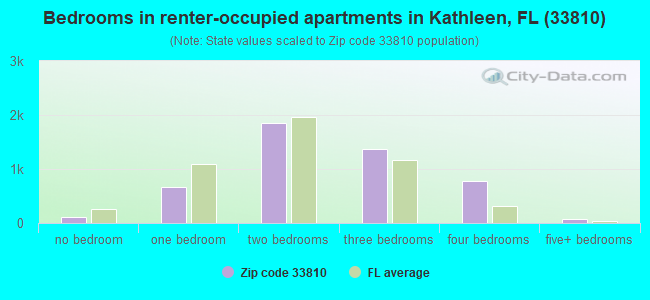
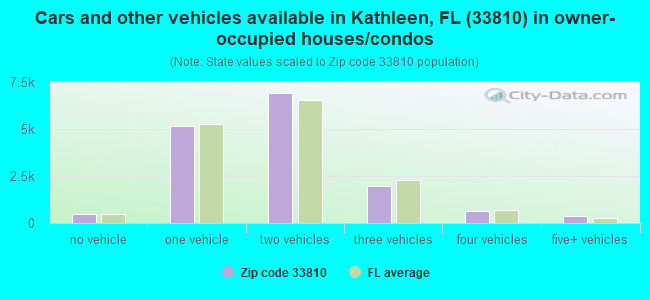
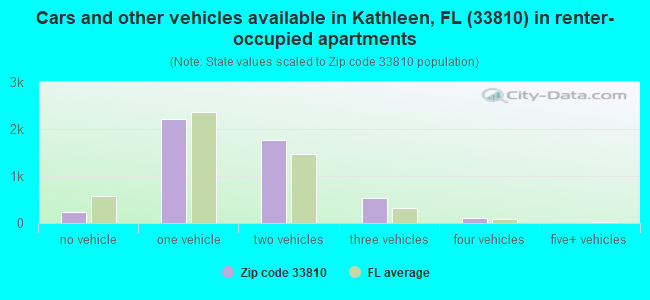
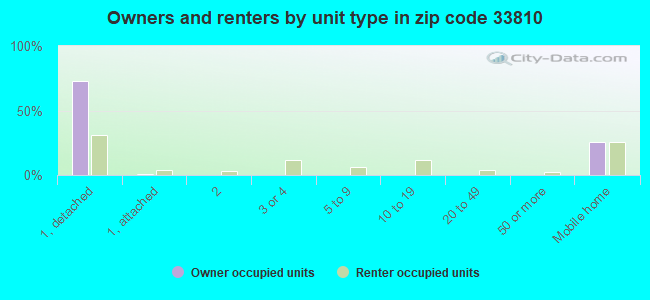
Houses and condos: 22,304 Renter-occupied apartments: 4,844
% of renters here:
24%
State:
33%
March 2022 cost of living index in zip code 33810: 87.3 (less than average, U.S. average is 100)
Land area: 56.1 sq. mi. Water area: 0.9 sq. mi.
Population density: 943 people per square mile
(low).
OSM Map
General Map
Google Map
MSN Map
OSM Map
General Map
Google Map
MSN Map
OSM Map
General Map
Google Map
MSN Map
OSM Map
General Map
Google Map
MSN Map
Please wait while loading the map...
Real estate property taxes paid for housing units in 2022:
This zip code:
0.6% ($1,565)
Florida:
0.7% ($2,529)
Median real estate property taxes paid for housing units with mortgages in 2022: $1,735 (0.6%) Median real estate property taxes paid for housing units with no mortgage in 2022: $1,422 (0.6%)
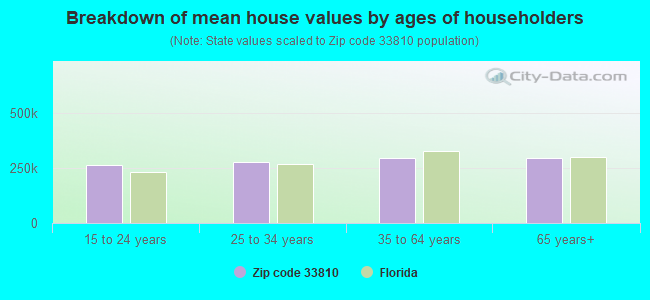
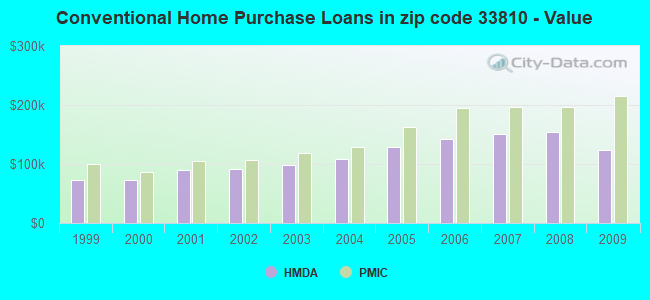
Estimated median house/condo value in 2022: $262,970
33810:
$262,970
Florida:
$354,100
According to our research of Florida and other state lists, there were 93 registered sex offenders living in 33810 zip code as of April 27, 2024. The ratio of all residents to sex offenders in zip code 33810 is 533 to 1. The ratio of registered sex offenders to all residents in this zip code is near the state average.
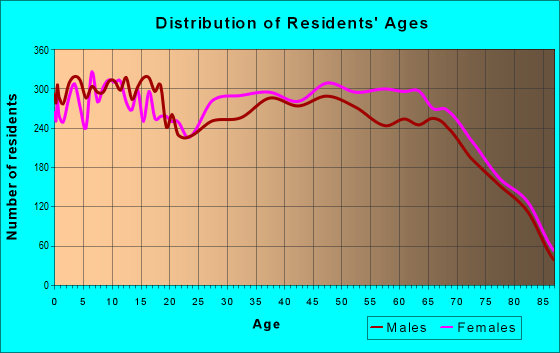
Median resident age:
This zip code:
44.1 years
Florida median age:
42.7 years
Average household size:
This zip code:
2.6 people
Florida:
2.5 people
Averages for the 2020 tax year for zip code 33810, filed in 2021:
Average Adjusted Gross Income (AGI) in 2020: $53,351 (Individual Income Tax Returns)
Here:
$53,351
State:
$82,200
Salary/wage: $46,510 (reported on 81.0% of returns)
Here:
$46,510
State:
$58,347
(% of AGI for various income ranges: 1203.4% for AGIs below $25k, 3517.7% for AGIs $25k-50k, 6183.9% for AGIs $50k-75k, 8990.2% for AGIs $75k-100k, 15581.7% for AGIs $100k-200k, 55327.3% for AGIs over 200k)
Taxable interest for individuals: $1,350 (reported on 19.2% of returns)
This zip code:
$1,350
Florida:
$4,272
(% of AGI for various income ranges: 12.4% for AGIs below $25k, 12.9% for AGIs $25k-50k, 32.6% for AGIs $50k-75k, 42.2% for AGIs $75k-100k, 101.5% for AGIs $100k-200k, 1080.7% for AGIs over 200k)
Ordinary dividends: $7,142 (reported on 15.4% of returns)
Here:
$7,142
State:
$15,863
(% of AGI for various income ranges: 18.0% for AGIs below $25k, 29.0% for AGIs $25k-50k, 82.9% for AGIs $50k-75k, 162.8% for AGIs $75k-100k, 468.6% for AGIs $100k-200k, 7974.7% for AGIs over 200k)
Net capital gain/loss in AGI: +$14,032 (reported on 10.7% of returns)
Here:
+$14,032
State:
+$62,983
(% of AGI for various income ranges: 5.0% for AGIs below $25k, 16.6% for AGIs $25k-50k, 63.6% for AGIs $50k-75k, 164.5% for AGIs $75k-100k, 490.8% for AGIs $100k-200k, 15674.0% for AGIs over 200k)
Profit/loss from business: +$6,121 (reported on 15.3% of returns)
Here:
+$6,121
State:
+$9,719
(% of AGI for various income ranges: 99.1% for AGIs below $25k, 64.8% for AGIs $25k-50k, 108.8% for AGIs $50k-75k, 143.6% for AGIs $75k-100k, 273.4% for AGIs $100k-200k, 2001.3% for AGIs over 200k)
Taxable individual retirement arrangement distribution: $18,235 (reported on 9.4% of returns)
33810:
$18,235
Florida:
$24,823
(% of AGI for various income ranges: 58.3% for AGIs below $25k, 98.1% for AGIs $25k-50k, 216.9% for AGIs $50k-75k, 451.5% for AGIs $75k-100k, 929.2% for AGIs $100k-200k, 3354.0% for AGIs over 200k)
Total itemized deductions: $33,844 (reported on 4.7% of returns)
Here:
$33,844
State:
$45,393
(% of AGI for various income ranges: 25.6% for AGIs below $25k, 134.1% for AGIs $25k-50k, 249.9% for AGIs $50k-75k, 340.1% for AGIs $75k-100k, 655.0% for AGIs $100k-200k, 4913.3% for AGIs over 200k)
Charity contributions: $11,091 (reported on 3.9% of returns)
Here:
$11,091
State:
$20,178
(% of AGI for various income ranges: 1.8% for AGIs below $25k, 20.3% for AGIs $25k-50k, 41.4% for AGIs $50k-75k, 79.9% for AGIs $75k-100k, 237.4% for AGIs $100k-200k, 2198.7% for AGIs over 200k)
Taxes paid: $6,095 (reported on 4.5% of returns)
33810:
$6,095
State:
$6,967
(% of AGI for various income ranges: 3.3% for AGIs below $25k, 23.8% for AGIs $25k-50k, 48.7% for AGIs $50k-75k, 64.1% for AGIs $75k-100k, 110.3% for AGIs $100k-200k, 732.0% for AGIs over 200k)
Earned income credit: $2,506 (reported on 21.6% of returns)
Here:
$2,506
State:
$2,306
(% of AGI for various income ranges: 126.7% for AGIs below $25k, 81.9% for AGIs $25k-50k, 1.3% for AGIs $50k-75k)
Percentage of individuals using paid preparers for their 2020 taxes: 93.3%
Here:
93%
State:
92%
(% for various income ranges: 92.6% for AGIs below $25k, 94.1% for AGIs $25k-50k, 93.5% for AGIs $50k-75k, 93.2% for AGIs $75k-100k, 93.9% for AGIs $100k-200k, 91.8% for AGIs over 200k)
Averages for the 2012 tax year for zip code 33810, filed in 2013:
Average Adjusted Gross Income (AGI) in 2012: $44,658 (Individual Income Tax Returns)
Here:
$44,658
State:
$60,316
Salary/wage: $38,851 (reported on 81.3% of returns)
Here:
$38,851
State:
$45,277
(% of AGI for various income ranges: 73.0% for AGIs below $25k, 78.7% for AGIs $25k-50k, 75.0% for AGIs $50k-75k, 74.3% for AGIs $75k-100k, 72.0% for AGIs $100k-200k, 32.8% for AGIs over 200k)
Taxable interest for individuals: $1,279 (reported on 26.4% of returns)
This zip code:
$1,279
Florida:
$3,587
(% of AGI for various income ranges: 1.4% for AGIs below $25k, 0.6% for AGIs $25k-50k, 0.6% for AGIs $50k-75k, 0.5% for AGIs $75k-100k, 0.9% for AGIs $100k-200k, 0.6% for AGIs over 200k)
Ordinary dividends: $6,012 (reported on 17.9% of returns)
Here:
$6,012
State:
$12,831
(% of AGI for various income ranges: 2.4% for AGIs below $25k, 1.7% for AGIs $25k-50k, 1.6% for AGIs $50k-75k, 2.1% for AGIs $75k-100k, 3.4% for AGIs $100k-200k, 4.0% for AGIs over 200k)
Net capital gain/loss in AGI: +$5,997 (reported on 9.8% of returns)
Here:
+$5,997
State:
+$33,493
(% of AGI for various income ranges: 0.4% for AGIs $25k-50k, 0.6% for AGIs $50k-75k, 0.6% for AGIs $75k-100k, 1.6% for AGIs $100k-200k, 7.1% for AGIs over 200k)
Profit/loss from business: +$5,592 (reported on 12.8% of returns)
Here:
+$5,592
State:
+$10,012
(% of AGI for various income ranges: 5.8% for AGIs below $25k, 0.9% for AGIs $25k-50k, 0.9% for AGIs $50k-75k, 1.1% for AGIs $75k-100k, 1.0% for AGIs $100k-200k, 1.4% for AGIs over 200k)
Taxable individual retirement arrangement distribution: $14,006 (reported on 11.0% of returns)
33810:
$14,006
Florida:
$21,544
(% of AGI for various income ranges: 3.3% for AGIs below $25k, 3.0% for AGIs $25k-50k, 3.2% for AGIs $50k-75k, 4.1% for AGIs $75k-100k, 4.7% for AGIs $100k-200k, 1.4% for AGIs over 200k)
Self-employment retirement plans: $11,800 (reported on 0.1% of returns)
33810:
$11,800
Florida:
$20,611
Total itemized deductions: $19,160 (23% of AGI, reported on 21.1% of returns)
Here:
$19,160
State:
$25,533
Here:
23.1% of AGI
State:
18.0% of AGI
(% of AGI for various income ranges: 7.3% for AGIs below $25k, 8.8% for AGIs $25k-50k, 9.4% for AGIs $50k-75k, 10.0% for AGIs $75k-100k, 10.0% for AGIs $100k-200k, 7.6% for AGIs over 200k)
Charity contributions: $4,569 (reported on 15.7% of returns)
Here:
$4,569
State:
$5,698
(% of AGI for various income ranges: 0.7% for AGIs below $25k, 1.2% for AGIs $25k-50k, 1.6% for AGIs $50k-75k, 1.9% for AGIs $75k-100k, 2.2% for AGIs $100k-200k, 1.9% for AGIs over 200k)
Taxes paid: $3,369 (reported on 20.3% of returns)
33810:
$3,369
State:
$6,203
(% of AGI for various income ranges: 0.8% for AGIs below $25k, 1.1% for AGIs $25k-50k, 1.4% for AGIs $50k-75k, 1.6% for AGIs $75k-100k, 1.9% for AGIs $100k-200k, 2.6% for AGIs over 200k)
Earned income credit: $2,416 (reported on 23.9% of returns)
Here:
$2,416
State:
$2,372
(% of AGI for various income ranges: 8.1% for AGIs below $25k, 1.3% for AGIs $25k-50k)
Percentage of individuals using paid preparers for their 2012 taxes: 44.2%
Here:
44%
State:
54%
(% for various income ranges: 41.5% for AGIs below $25k, 42.0% for AGIs $25k-50k, 47.9% for AGIs $50k-75k, 46.1% for AGIs $75k-100k, 54.8% for AGIs $100k-200k, 76.5% for AGIs over 200k)
Averages for the 2004 tax year for zip code 33810, filed in 2005:
Average Adjusted Gross Income (AGI) in 2004: $37,601 (Individual Income Tax Returns)
Here:
$37,601
State:
$50,523
Salary/wage: $33,602 (reported on 84.0% of returns)
Here:
$33,602
State:
$39,563
(% of AGI for various income ranges: 128.7% for AGIs below $10k, 75.2% for AGIs $10k-25k, 79.9% for AGIs $25k-50k, 79.0% for AGIs $50k-75k, 77.4% for AGIs $75k-100k, 55.6% for AGIs over 100k)
Taxable interest for individuals: $1,648 (reported on 38.3% of returns)
This zip code:
$1,648
Florida:
$3,211
(% of AGI for various income ranges: 6.7% for AGIs below $10k, 2.3% for AGIs $10k-25k, 1.5% for AGIs $25k-50k, 1.1% for AGIs $50k-75k, 1.3% for AGIs $75k-100k, 2.1% for AGIs over 100k)
Taxable dividends: $2,149 (reported on 19.4% of returns)
Here:
$2,149
State:
$6,129
(% of AGI for various income ranges: 3.7% for AGIs below $10k, 1.3% for AGIs $10k-25k, 0.8% for AGIs $25k-50k, 0.8% for AGIs $50k-75k, 0.9% for AGIs $75k-100k, 1.8% for AGIs over 100k)
Net capital gain/loss: +$8,008 (reported on 13.9% of returns)
Here:
+$8,008
State:
+$27,205
(% of AGI for various income ranges: -0.3% for AGIs below $10k, 0.3% for AGIs $10k-25k, 0.5% for AGIs $25k-50k, 0.9% for AGIs $50k-75k, 1.8% for AGIs $75k-100k, 12.8% for AGIs over 100k)
Profit/loss from business: +$7,087 (reported on 11.2% of returns)
Here:
+$7,087
State:
+$10,634
(% of AGI for various income ranges: 6.5% for AGIs below $10k, 4.3% for AGIs $10k-25k, 1.6% for AGIs $25k-50k, 1.6% for AGIs $50k-75k, 1.6% for AGIs $75k-100k, 2.0% for AGIs over 100k)
IRA payment deduction: $2,866 (reported on 1.6% of returns)
33810:
$2,866
Florida:
$3,082
(% of AGI for various income ranges: 0.1% for AGIs $10k-25k, 0.1% for AGIs $25k-50k, 0.1% for AGIs $50k-75k, 0.1% for AGIs $75k-100k, 0.1% for AGIs over 100k)
Self-employed pension: $11,097 (reported on 0.2% of returns)
Here:
$11,097
Florida:
$15,857
Total itemized deductions: $15,785 (25% of AGI, reported on 23.6% of returns)
Here:
$15,785
State:
$20,370
Here:
24.9% of AGI
State:
20.7% of AGI
(% of AGI for various income ranges: 13.5% for AGIs below $10k, 7.9% for AGIs $10k-25k, 9.1% for AGIs $25k-50k, 10.8% for AGIs $50k-75k, 10.7% for AGIs $75k-100k, 10.5% for AGIs over 100k)
Charity contributions deductions: $3,635 (5% of AGI, reported on 19.1% of returns)
Here:
$3,635
State:
$4,064
Here:
5.4% of AGI
State:
3.8% of AGI
(% of AGI for various income ranges: 1.0% for AGIs below $10k, 1.0% for AGIs $10k-25k, 1.4% for AGIs $25k-50k, 2.0% for AGIs $50k-75k, 2.1% for AGIs $75k-100k, 2.8% for AGIs over 100k)
Total tax: $4,650 (reported on 72.8% of returns)
33810:
$4,650
State:
$9,431
(% of AGI for various income ranges: 3.5% for AGIs below $10k, 3.5% for AGIs $10k-25k, 6.2% for AGIs $25k-50k, 8.5% for AGIs $50k-75k, 10.8% for AGIs $75k-100k, 17.0% for AGIs over 100k)
Earned income credit: $1,776 (reported on 19.1% of returns)
Here:
$1,776
State:
$1,808
Percentage of individuals using paid preparers for their 2004 taxes: 54.7%
Here:
55%
State:
60%
(% for various income ranges: 48.4% for AGIs below $10k, 57.1% for AGIs $10k-25k, 54.7% for AGIs $25k-50k, 53.5% for AGIs $50k-75k, 57.0% for AGIs $75k-100k, 65.4% for AGIs over 100k)
Likely homosexual households (counted as self-reported same-sex unmarried-partner households)
Lesbian couples: 0.4% of all households
Gay men: 0.2% of all households
Household received Food Stamps/SNAP in the past 12 months: 2,793 Household did not receive Food Stamps/SNAP in the past 12 months: 17,503
Women who had a birth in the past 12 months: 444 (256 now married, 183 unmarried) Women who did not have a birth in the past 12 months: 10,630 (4,437 now married, 6,193 unmarried)
Housing units in zip code 33810 with a mortgage: 8,006 (477 second mortgage, 20 home equity loan, 331 both second mortgage and home equity loan) Houses without a mortgage: 40
Median monthly owner costs for units with a mortgage: $1,373 Median monthly owner costs for units without a mortgage: $494
Residents with income below the poverty level in 2022:
This zip code:
11.3%
Whole state:
12.7%
Residents with income below 50% of the poverty level in 2022:
This zip code:
5.8%
Whole state:
6.6%
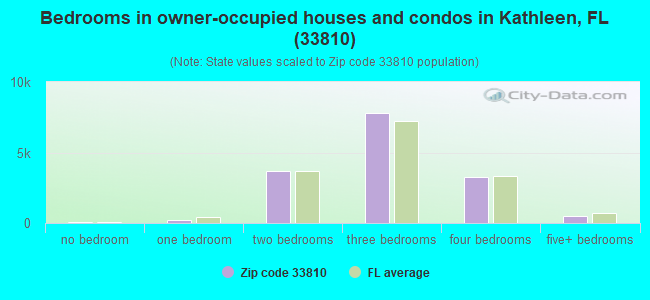
Median number of rooms in houses and condos:
Here:
6.2
State:
5.9
Median number of rooms in apartments:
Here:
5.0
State:
4.2
Notable locations in this zip code not listed on our city pages
Notable locations in zip code 33810: Kings Ridge Golf Club (A), Polk County Fire Department Station 24 Sleepy Hill (B), Polk County Fire Department Station 23 Providence (C), Polk County Fire Department Number 24 (D), Polk County Fire Department (E). Display/hide their locations on the map
Churches in zip code 33810 include: Bethel Church (A), New Home Church (B), Mount Tabor Church (C), American Baptist Church of Lakeland (D), Northside Baptist Church (E), Good Shepherd Church (F), German Church (G), Faith Church (H), Gibsonia Baptist Church (I). Display/hide their locations on the map
Lakes: Lake Winston (A), Avenue Pond (B), Duff Lake (C), Lake Galloway (D), Indian Lake (E), Meadow View Lake (F), Lester Lake (G). Display/hide their locations on the map
5,801 married couples with children.
3,086 single-parent households (842 men, 2,244 women).
80.8% of residents of 33810 zip code speak English at home.
14.9% of residents speak Spanish at home (60% very well, 19% well, 15% not well, 6% not at all).
1.6% of residents speak other Indo-European language at home (71% very well, 20% well, 9% not well).
1.6% of residents speak Asian or Pacific Island language at home (62% very well, 29% well, 9% not well).
0.9% of residents speak other language at home (83% very well, 8% well, 4% not well, 5% not at all).
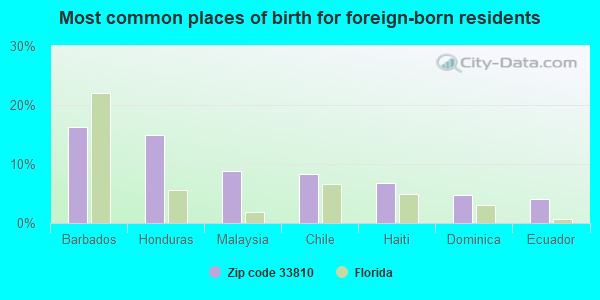
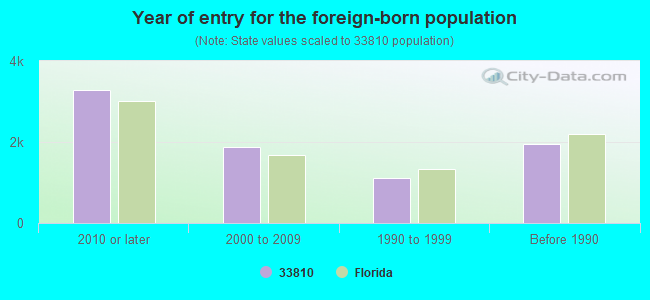
Foreign born population: 4,883 (9.2%) (60.4% of them are naturalized citizens)
Major facilities with environmental interests located in this zip code:
AOC LLC (4620 NORTH GALLOWAY ROAD in LAKELAND, FL)
AIR SYNTHETIC MINOR (AIRS/AFS) SUPERFUND NPL (Superfund database) STATE MASTER (FDM) - WAFR-FL0029653, INDUSTRIAL WASTEWATER PROGRAM, CHAZ-FLD041495441, HAZARDOUS WASTE REGULATION PROGRAM, WAFR-FLR05F484, NPDES STORMWATER PROGRAM, NPDES STORMWATER PERMIT CRITERIA AND HAZARDOUS AIR POLLUTANT INVENTORY (Inventory of air pollution sources) National Pollutant Discharge Elimination System MAJOR (Tracking pollutant discharge elimination systems) - permit National Pollutant Discharge Elimination System NON-MAJOR (Tracking pollutant discharge elimination systems) - permit HAZARDOUS WASTE BIENNIAL REPORTER (Resource Conservation and Recovery Act (tracking hazardous waste)) Large Quantity Generators, more that 1000 kg of hazardous waste/month (Resource Conservation and Recovery Act (tracking hazardous waste)) TRI REPORTER (Tracking of toxic chemicals releasing facilities) Business SIC classification: PLASTICS MATERIALS, SYNTHETIC RESINS, AND NONVULCANIZABLE ELASTOMERS Business NAICS classification: PLASTICS MATERIAL AND RESIN MANUFACTURING.; PLASTICS MATERIAL AND RESIN MANUFACTURING. Organizations: ALPHA/OWENS-CORNING, AOC, L.L.C. (CONTACT/APPLICANT)
, MARTIN MCLEOD (CONTACT/OWNER)
, MARTIN MCLEOD, REG AFFAIRS COORD (CONTACT/OWNER)
, ALPHA/OWENS-CORNING (CONTACT/PERMIT)
, AOC, L.L.C. (CONTACT/PERMIT)
Alternative names: A.O.C., L.L.C., ALPHA CHEMICAL CORP, ALPHA RESINS CORPORATION, AOC L.L.C.
KATHLEEN MIDDLE SCHOOL (3627 KATHLEEN PINES in LAKELAND, FL)
STATE MASTER (FDM) - WAFR-FLA012957, DOMESTIC WASTEWATER PROGRAM (National Center for Education Statistics) - STATE ID-1191 Business SIC classification: SEWERAGE SYSTEMS Organizations: POLK COUNTY SCHOOL BOARD, SUPERINTENDENT, POLK COUNTY SCHOOL DISTRICT (SCHOOL DISTRICT)
R CLEM CHURCHWELL ELEMENTARY SCHOOL (8201 PARK BYRD RD in LAKELAND, FL)
STATE MASTER (FDM) - WAFR-FLA012964, DOMESTIC WASTEWATER PROGRAM (Geographic Names Information System) National Pollutant Discharge Elimination System NON-MAJOR (Tracking pollutant discharge elimination systems) - permit Business SIC classification: SEWERAGE SYSTEMS Organizations: POLK COUNTY SCHOOL BOARD, INDIAN RIVER COUNTY UTILITIES, POLK COUNTY SCHOOL BD MECH SER CTR (CONTACT/APPLICANT)
, SCHOOL BOARD OF POLK CO. (CONTACT/APPLICANT)
, BOB WILLIAMS (CONTACT/OWNER)
, DONALD F WINTER SR (CONTACT/OWNER)
, POLK COUNTY SCHOOL BD MECH SER CTR (CONTACT/PERMIT)
, SCHOOL BOARD OF POLK CO. (CONTACT/PERMIT)
Alternative names: PCSB - CHURCHWELL ELEMENTARY, RC CHURCHWELL ELEMENTARY SCHOOL WWTP
KATHLEEN ELEMENTARY SCHOOL (3515 SHERETZ RD in LAKELAND, FL)
(Geographic Names Information System) (National Center for Education Statistics) - STATE ID-1221 Organizations: POLK COUNTY SCHOOL DISTRICT (SCHOOL DISTRICT)
GRIFFIN ELEMENTARY SCHOOL (3315 KATHLEEN RD in LAKELAND, FL)
(Geographic Names Information System) (National Center for Education Statistics) - STATE ID-1231 Organizations: POLK COUNTY SCHOOL DISTRICT (SCHOOL DISTRICT)
HAMPTON HILLS SOUTH PHASE 1 (SLEEPY HILL RD & HAMPTON HILLS in LAKELAND, FL)
National Pollutant Discharge Elimination System NON-MAJOR (Tracking pollutant discharge elimination systems) - permit National Pollutant Discharge Elimination System NON-MAJOR (Tracking pollutant discharge elimination systems) - permit Organizations: MIKE LAWSON (CONTACT/OWNER)
, MIKE SOUTHWARD (CONTACT/OWNER)
KEYMARK CORPORATION OF FLORIDA (2540 KNIGHTS STATION RD. in LAKELAND, FL)
AIR MAJOR (AIRS/AFS) CRITERIA AND HAZARDOUS AIR POLLUTANT INVENTORY (Inventory of air pollution sources) HAZARDOUS WASTE BIENNIAL REPORTER (Resource Conservation and Recovery Act (tracking hazardous waste)) Large Quantity Generators, more that 1000 kg of hazardous waste/month (Resource Conservation and Recovery Act (tracking hazardous waste)) TRI REPORTER (Tracking of toxic chemicals releasing facilities) Business SIC classification: ALUMINUM EXTRUDED PRODUCTS Business NAICS classification: ALUMINUM EXTRUDED PRODUCT MANUFACTURING.; ALUMINUM EXTRUDED PRODUCT MANUFACTURING.; ORNAMENTAL AND ARCHITECTURAL METAL WORK MANUFACTURING. Organizations: KEYMARK CORP OF FLORIDA (CONTACT/OPERATOR)
COUNTRY CHASE (RITTER ROAD AND COUNTRY CHASE in LAKELAND, FL)
National Pollutant Discharge Elimination System NON-MAJOR (Tracking pollutant discharge elimination systems) - permit National Pollutant Discharge Elimination System NON-MAJOR (Tracking pollutant discharge elimination systems) - permit Organizations: ROBERT HARPER (CONTACT/OWNER)
, CHUCK REEDER (CONTACT/OWNER)
Alternative names: BILLY POLK POULTRY
SLEEPY HILL MIDDLE SCHOOL (2215 SLEEPY HILL ROAD in LAKELAND, FL)
(National Center for Education Statistics) - STATE ID-1971 Organizations: POLK COUNTY SCHOOL DISTRICT (SCHOOL DISTRICT)
CIRCLE K #7087 (3808 DEESON RD in LAKELAND, FL)
National Pollutant Discharge Elimination System NON-MAJOR (Tracking pollutant discharge elimination systems) - permit (Resource Conservation and Recovery Act (tracking hazardous waste)) Organizations: STEVE BELIN, COMPLIANCE MGR (CONTACT/OWNER)
, SCOTT PATTERSON (CONTACT/OWNER)
Alternative names: CIRCLE K STORE #7087
NORTHWEST REGIONAL WWTF (CAMPBELL RD & W SOCRUM LOOP RD in LAKELAND, FL)
National Pollutant Discharge Elimination System NON-MAJOR (Tracking pollutant discharge elimination systems) - permit National Pollutant Discharge Elimination System NON-MAJOR (Tracking pollutant discharge elimination systems) - permit Alternative names: MILMIR CONSTRUCTION INC, POLK COUNTY BOARD OF CY COMM, POLK COUNTY NORTHWEST REGIONAL WWTF
ASHLEY MANOR (CAMPBELL ROAD in LAKELAND, FL)
National Pollutant Discharge Elimination System NON-MAJOR (Tracking pollutant discharge elimination systems) - permit Organizations: MARK WILSON (CONTACT/OWNER)
Housing units lacking complete plumbing facilities: 1.1% Housing units lacking complete kitchen facilities: 1.2%
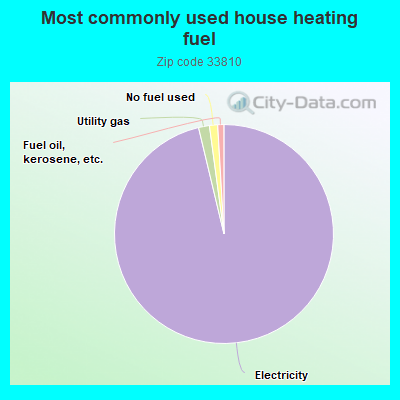
95.5%Electricity
1.6%Utility gas
1.2%No fuel used
0.9%Fuel oil, kerosene, etc.
Place of birth for U.S.-born residents:
This state: 22,981
Northeast: 7,679
Midwest: 7,356
South: 5,367
West: 1,114
52% of the 33810 zip code residents lived in the same house 5 years ago. Out of people who lived in different houses, 67% lived in this county. Out of people who lived in different counties, 50% lived in Florida.
87% of the 33810 zip code residents lived in the same house 1 year ago. Out of people who lived in different houses, 45% moved from this county. Out of people who lived in different houses, 28% moved from different county within same state. Out of people who lived in different houses, 21% moved from different state. Out of people who lived in different houses, 3% moved from abroad.
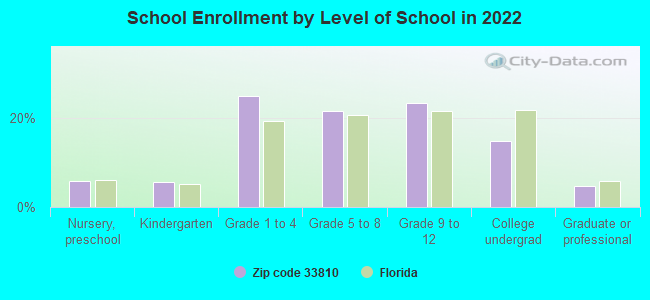
Private vs. public school enrollment:
Students in private schools in grades 1 to 8 (elementary and middle school): 1,035
Here:
20.6%
Florida:
15.8%
Students in private schools in grades 9 to 12 (high school): 465
Here:
18.5%
Florida:
12.9%
Students in private undergraduate colleges: 295
Here:
18.7%
Florida:
23.6%
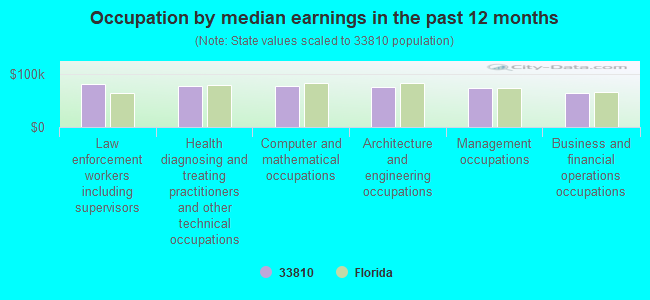
Occupation by median earnings in the past 12 months ($)
80,713Law enforcement workers including supervisors
77,408Health diagnosing and treating practitioners and other technical occupations
77,319Computer and mathematical occupations
75,257Architecture and engineering occupations
73,833Management occupations
64,959Business and financial operations occupations
Companies with federal contracts located in this zip code:
SABCO INDUSTRIES INC (5774 MANCHESTER DRIVE EAST in LAKELAND, FL; small business) : $453,932 in 2 contractsin 2004
$445,077 with Army for Clothing, Special Purpose. Signed on 2004-07-09. Completion date: 2004-11-19.
$8,855 with Army for Individual Equipment. Signed on 2004-07-06. Completion date: 2004-07-30.
PEOPLE MISTERS INTERNATIONAL L (4255 FRONTAGE RD N in LAKELAND, FL; small business) : $81,813 in 6 contractsfrom 2003 to 2005
Contracts for Maintenance, Repair or Alteration of Real Property -- Heating and Cooling Plants, Air Conditioning Equipment, Fans, Air Circulators, and Blower Equipment, Miscellaneous Machine Tools by Army, Navy Signed by year:2000: $0; 2001: $0; 2002: $0; 2003: $46,994; 2004: $27,661; 2005: $7,158; 2006: $0.
Biggest contracts:
$46,994 with Army for Maintenance, Repair or Alteration of Real Property -- Heating and Cooling Plants. Taking place in TX. Signed on 2003-09-30. Completion date: 2003-11-07.
$15,203 with Army for Air Conditioning Equipment. Signed on 2004-09-27. Completion date: 2004-11-26.
$12,458 with Navy for Fans, Air Circulators, and Blower Equipment. Signed on 2004-06-22. Completion date: 2004-07-30.
$6,211 with Navy for Miscellaneous Machine Tools. Signed on 2005-06-24. Completion date: 2005-07-08.
SENSIBLE HEALTHCARE PRODUCTS I (7756 WHICKHAM AVE in LAKELAND, FL; small business) : $33,204 in 2 contractsin 2005
$20,120 with Defense Logistics Agency for Medical and Surgical Instruments, Equipment, and Supplies. Signed on 2005-11-18. Completion date: 2006-06-01.
$13,084, same as above.Signed on 2005-11-02. Completion date: 2006-01-04.
Top industries in this zip code by the number of employees in 2005:
Health Care and Social Assistance: Continuing Care Retirement Communities (250-499 employees: 1 establishment)
Other Services (except Public Administration): Religious Organizations (100-249: 1, 10-19: 1, 5-9: 4, 1-4: 5)
2004 - 2018 National Fire Incident Reporting System (NFIRS) incidents
According to the data from the years 2004 - 2018 the average number of fires per year is 101. The highest number of reported fire incidents - 163 took place in 2006, and the least - 19 in 2004. The data has a rising trend.
When looking into fire subcategories, the most reports belonged to: Outside Fires (44.0%), and Structure Fires (36.4%).
Fire incident types reported to NFIRS in Zip Code 33810


 Nearest zip codes: 33815, 33849, 33809, 33805, 33565, 33811.
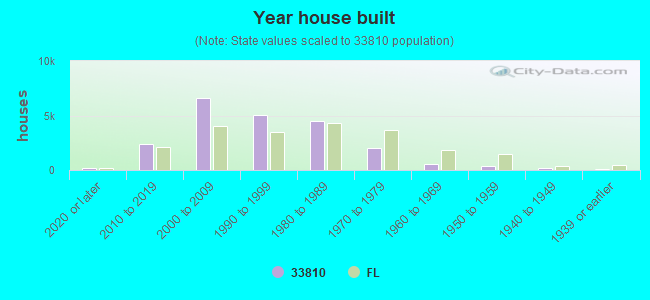


 According to the data from the years 2004 - 2018 the average number of fires per year is 101. The highest number of reported fire incidents - 163 took place in 2006, and the least - 19 in 2004. The data has a rising trend.
 When looking into fire subcategories, the most reports belonged to: Outside Fires (44.0%), and Structure Fires (36.4%).